
- Moving the markets
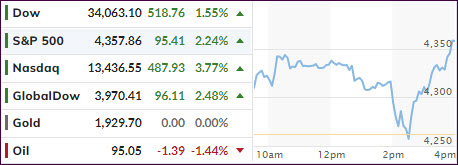
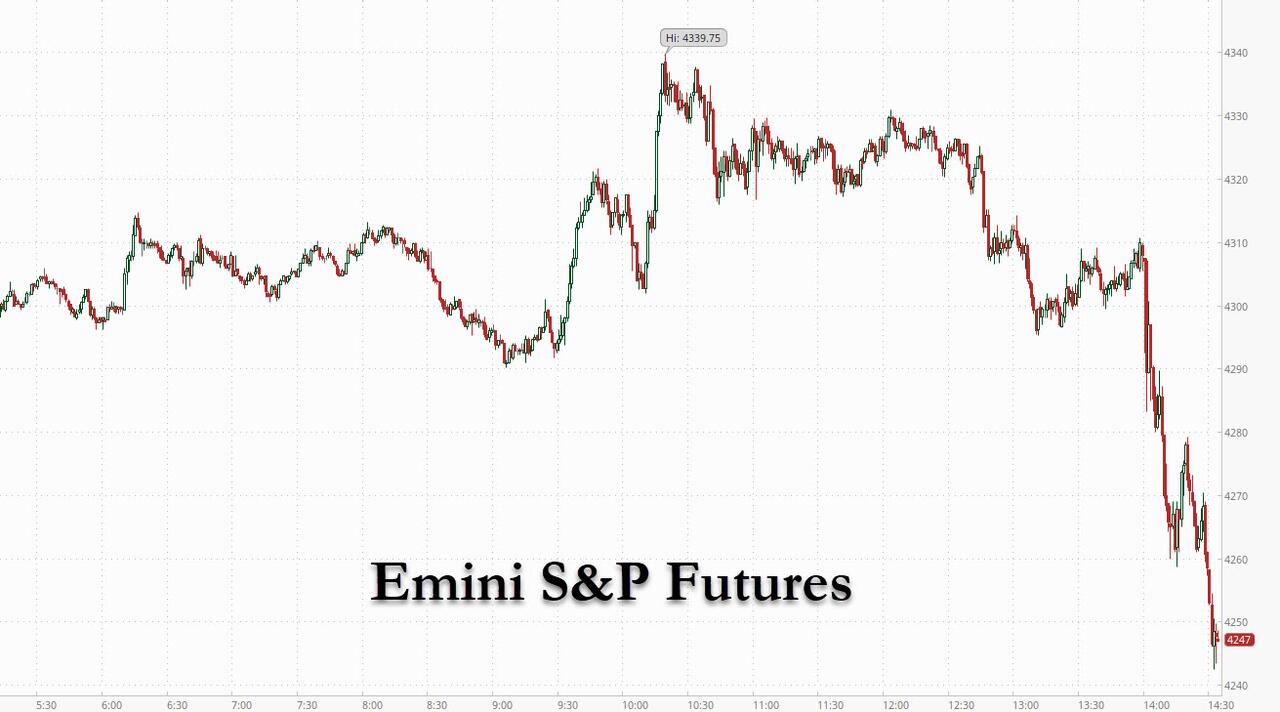
Today’s session turned into another wild ride, when an early 350-point ramp in the Dow was wiped out, with major indexes retreating to their unchanged lines, only to see them as a springboard for a last hour rebound to intra-day highs.
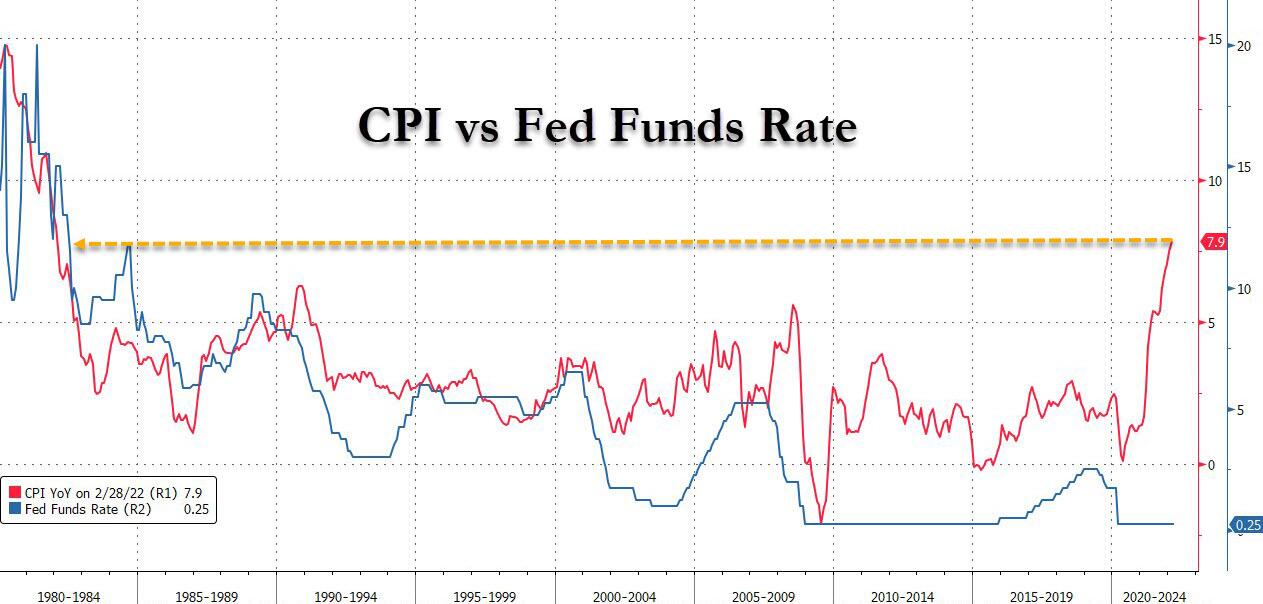
Today we learned that the Fed, as expected, raised their Federal Funds rate from zero to +0.25%, however, I could not find any explanation as to how that tiny change will fight 7.9% runaway inflation.
ZeroHedge added some color by explaining that the Fed is way behind the curve with any inflation fighting efforts, because the last time the CPI was at the current number (1982), the Fed Funds rate was at 13%, as this chart shows.
Makes me wonder how they possibly can expect that such a tiny hike will make a difference. Of course, it won’t, and we all know that any serious attempt to extinguish the inflation monster via a serious increase in rates would instantly prick the various bubbles and destroy the financial and real estate markets.
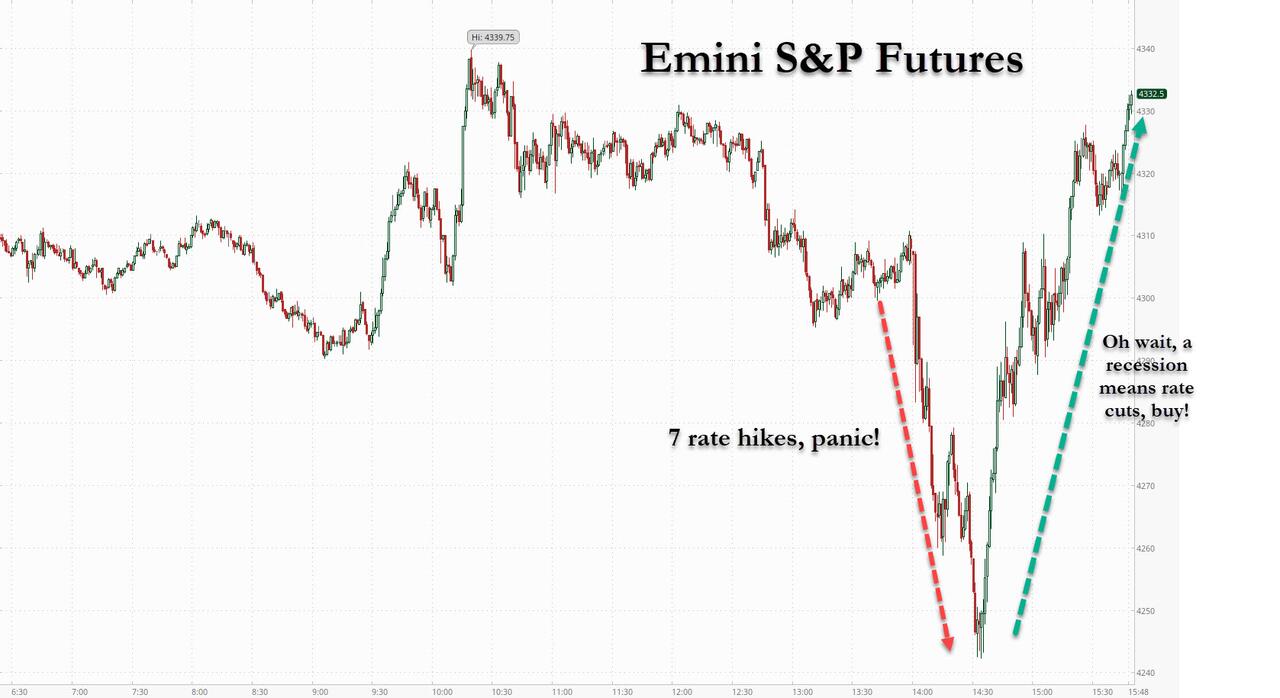
What caused the markets to stage a comeback late in the session? The Fed expects 6 more rate hikes in 2022, as did the market, or one at every meeting. Yet, once the word was out, rate hike odds plunged, and set the stage for the late rebound, which ZH explained this way:
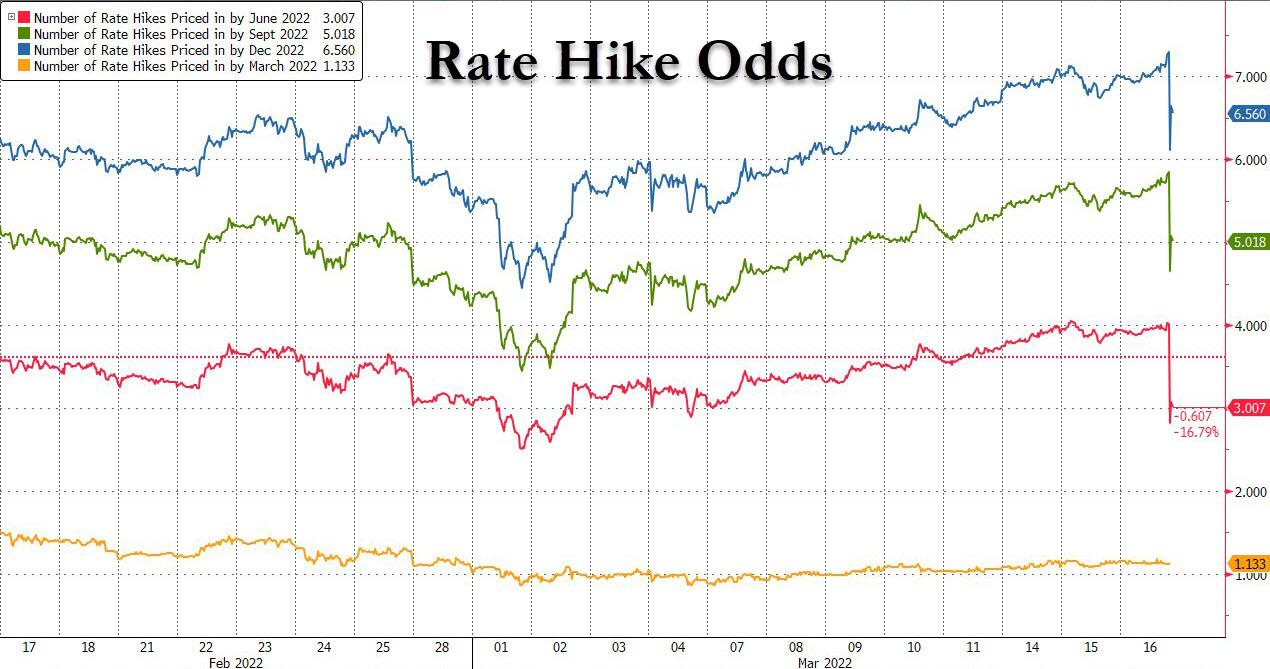
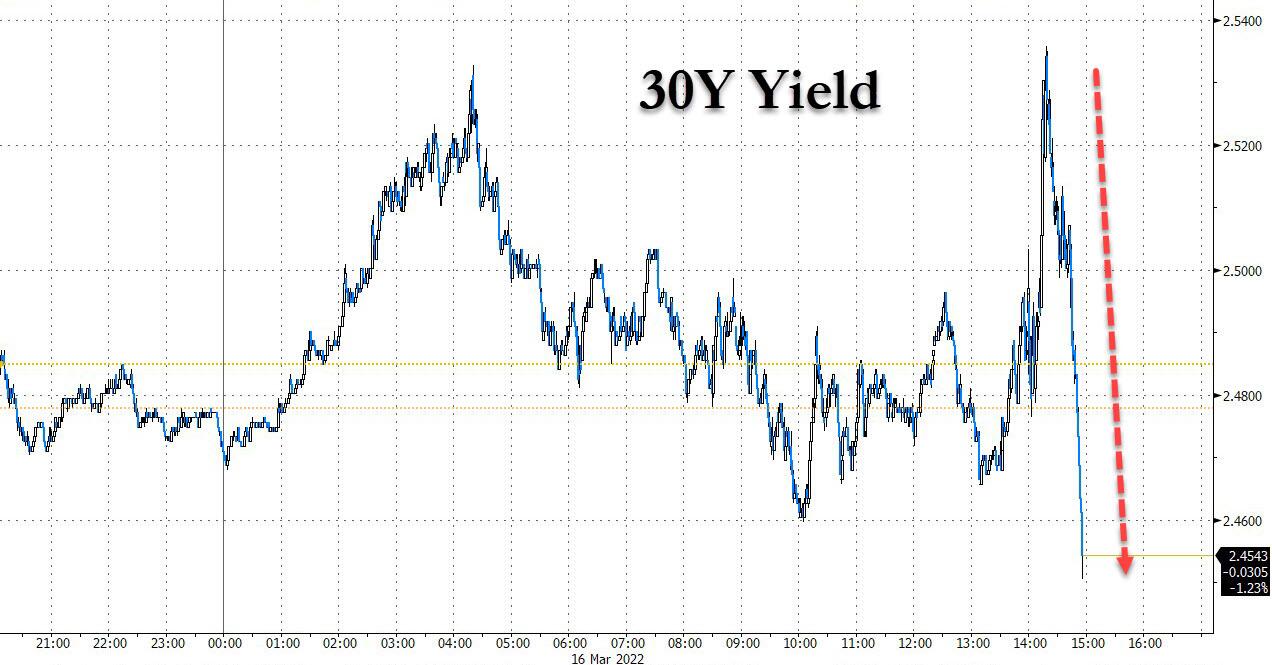
Because with even the Fed now forecasting a big slowdown to growth coupled with a surge in inflation…
… the most likely outcome now is stagflation. This immediately manifested itself in a plunge in 30Y yields…
… culminating with the 5s10s inverting, a clear sign that a recession – the same recession which the Fed hopes to induce to crush commodity demand – is now coming.
… confirming that the Fed, which was trapped long before today’s rate hike, will be forced to ease and/or resume QE in the not-too-distant future even as inflation continues to rage. Translation: policy error.
In short, the more hawkish Powell gets, the bigger the liquidity firehose he will have to unleash in a few months when the economy plummets into an all-out recession, if not depression.
There is a good chance that, if markets continue to view this as a positive for stocks, we may find ourselves back in domestic equities—if only on a temporary basis, and before the bottom drops out.
2. ETFs in the Spotlight
In case you missed the announcement and description of this section, you can read it here again.
It features some of the 10 broadly diversified domestic and sector ETFs from my HighVolume list as posted every Saturday. Furthermore, they are screened for the lowest MaxDD% number meaning they have been showing better resistance to temporary sell offs than all others over the past year.
The below table simply demonstrates the magnitude with which these ETFs are fluctuating above or below their respective individual trend lines (%+/-M/A). A break below, represented by a negative number, shows weakness, while a break above, represented by a positive percentage, shows strength.
For hundreds of ETF choices, be sure to reference Thursday’s StatSheet.
For this just closed-out domestic “Buy” cycle, here’s how some of our candidates have fared:
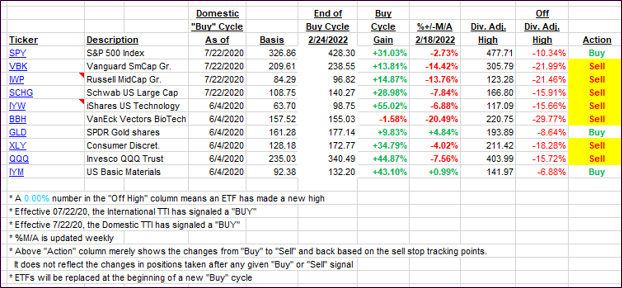
Click image to enlarge.
Again, the %+/-M/A column above shows the position of the various ETFs in relation to their respective long-term trend lines, while the trailing sell stops are being tracked in the “Off High” column. The “Action” column will signal a “Sell” once the -12% point has been taken out in the “Off High” column, which has replaced the prior -8% to -10% limits.
3. Trend Tracking Indexes (TTIs)
Our TTIs jumped, as a last hour lift-a-thon pulled the broad market out of the doldrums. The Domestic TTI is now again in striking distance of a new “Buy” signal.
This is how we closed 03/16/2022:
Domestic TTI: -0.34% below its M/A (prior close -2.18%)—Sell signal effective 02/24/2022.
International TTI: -2.18% below its M/A (prior close -4.34%)—Sell signal effective 03/08/2022.
Disclosure: I am obliged to inform you that I, as well as my advisory clients, own some of the ETFs listed in the above table. Furthermore, they do not represent a specific investment recommendation for you, they merely show which ETFs from the universe I track are falling within the specified guidelines.
All linked charts above are courtesy of Bloomberg via ZeroHedge.
Contact Ulli