Fed’s Hawkish Intentions Hamper Markets

Ulli Market Commentary Contact

[Chart courtesy of MarketWatch.com]

  1. Moving the markets

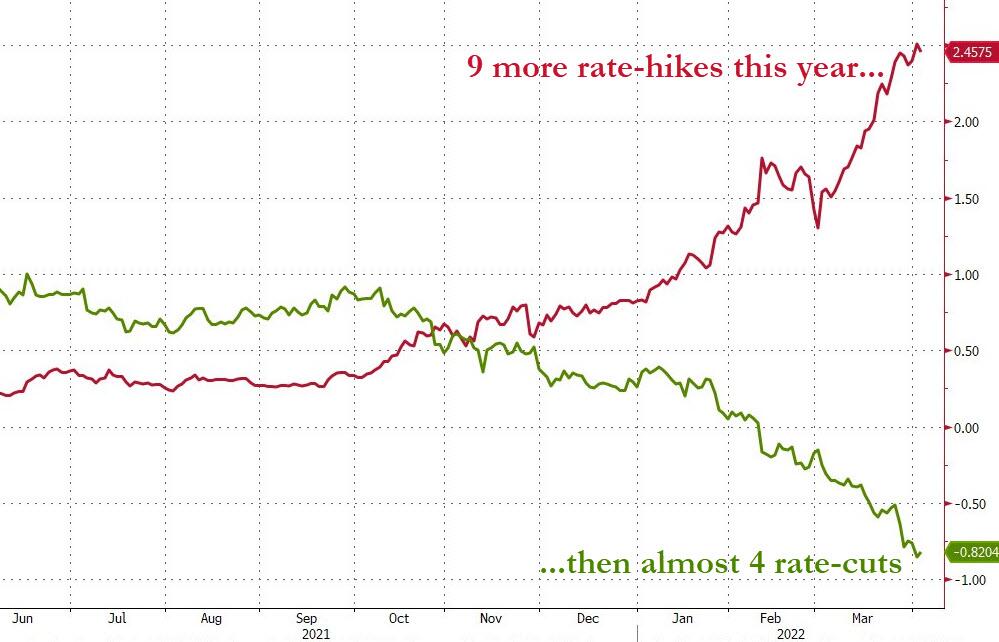
The highly anticipated Fed minutes turned out to be more hawkish than expected in terms of QT (Quantitative Tightening) and future rate hikes, which ZH summed up like this:

  • As much as $95 billion in asset runoff per month ($60-90 bn expected)
  • Many Fed officials say half-point hikes may be warranted
  • Fed sees need to get to neutral posture ‘expeditiously’
  • Fed fears public loss of confidence in is resolve over inflation

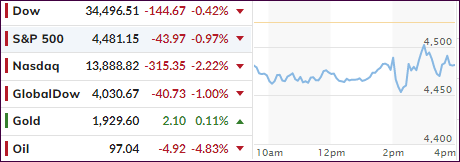
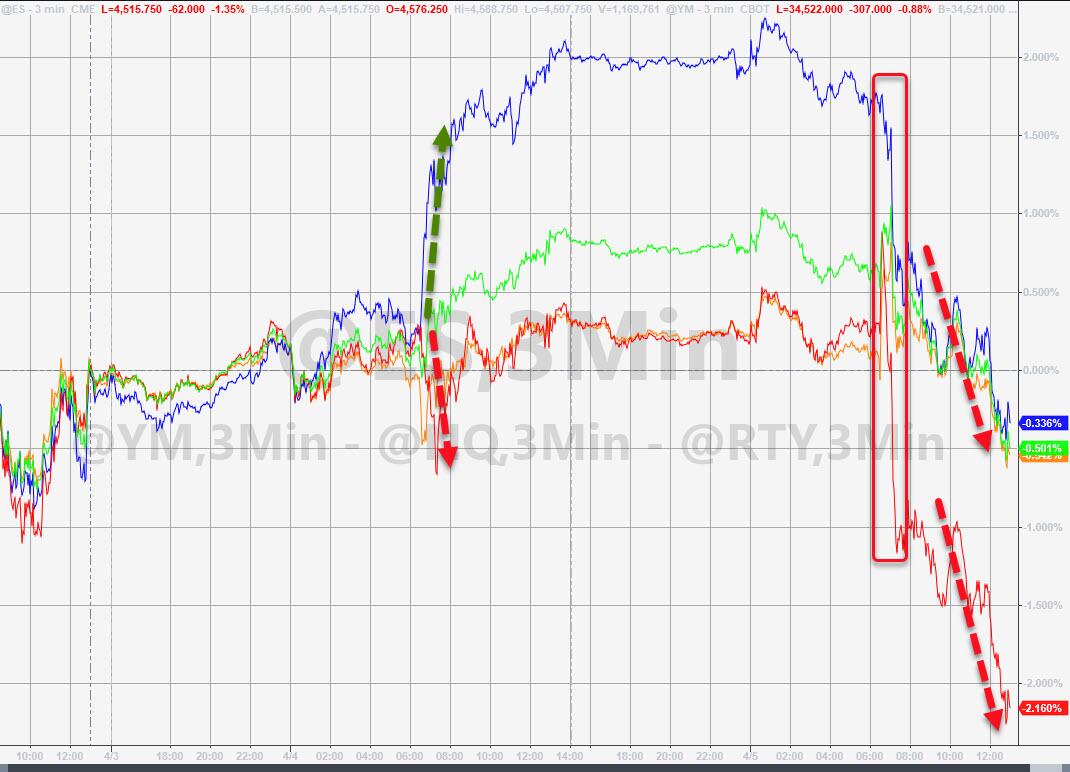
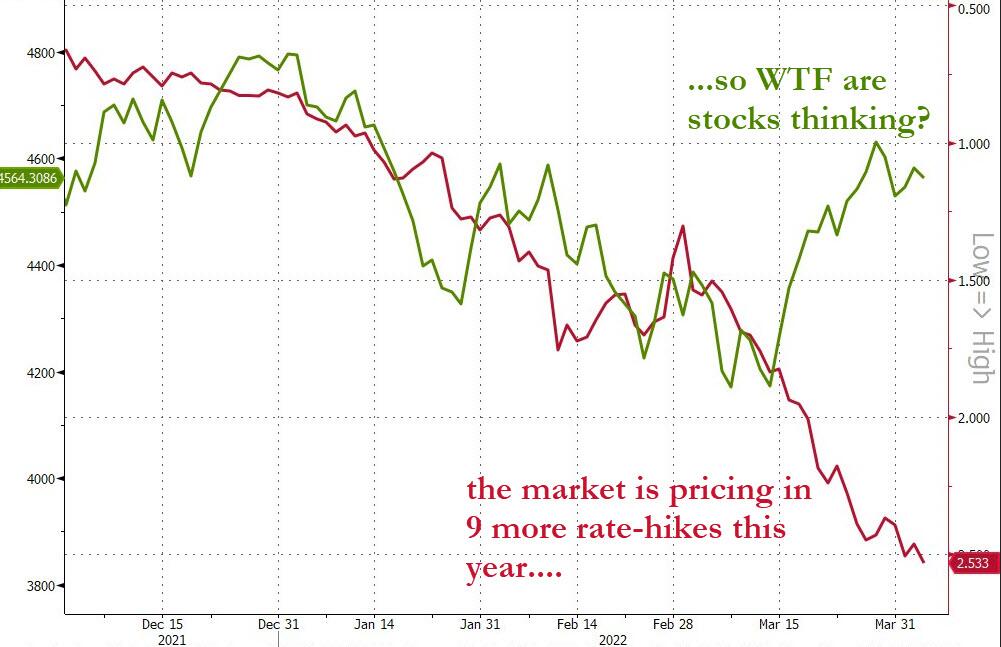
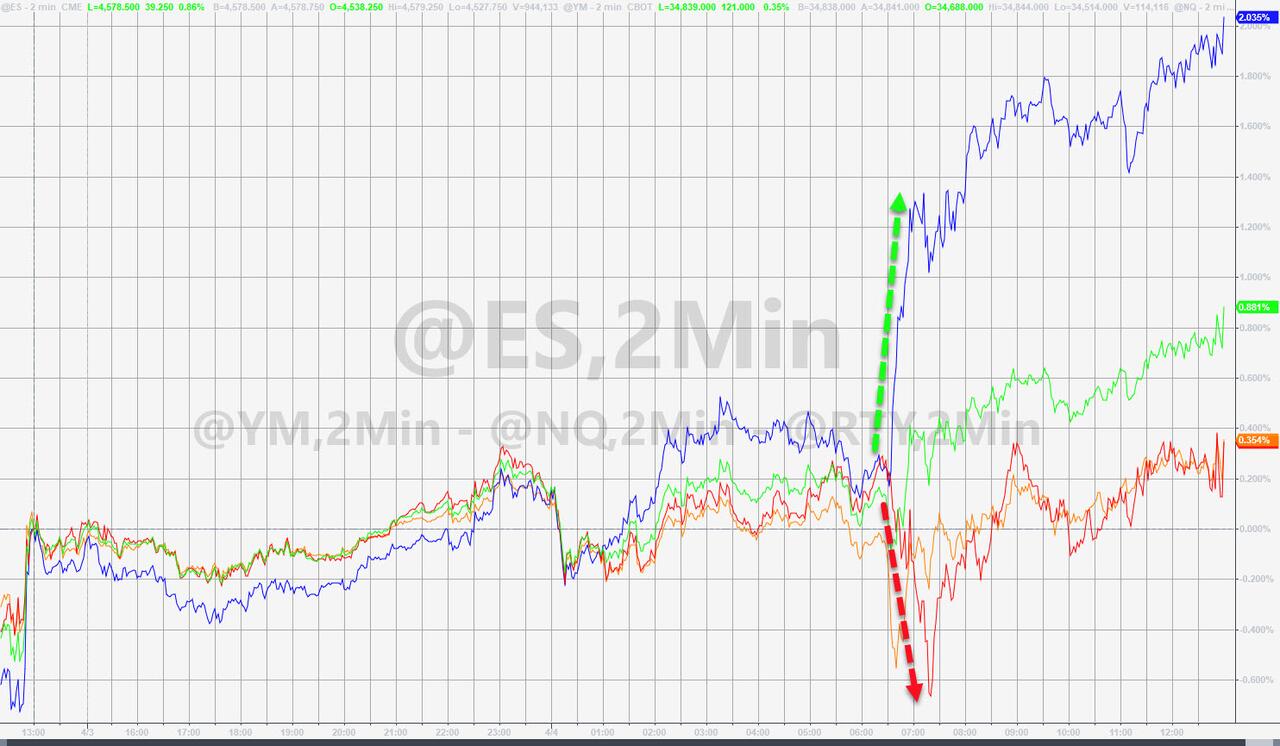
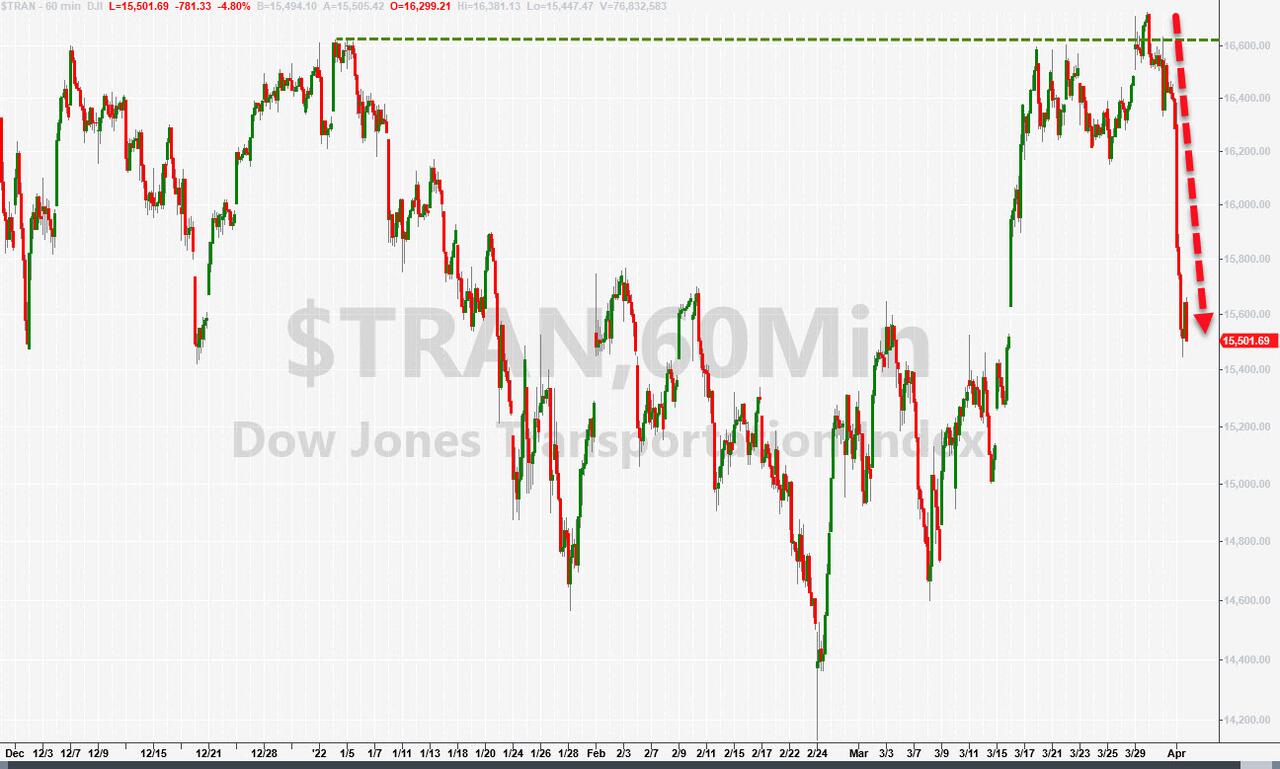
That pushed the Dow down some 250 points right after the opening with the other 2 major indexes following suit. While an afternoon comeback cut losses, the Nasdaq still took the brunt of the beating by losing 2.2% on the day.

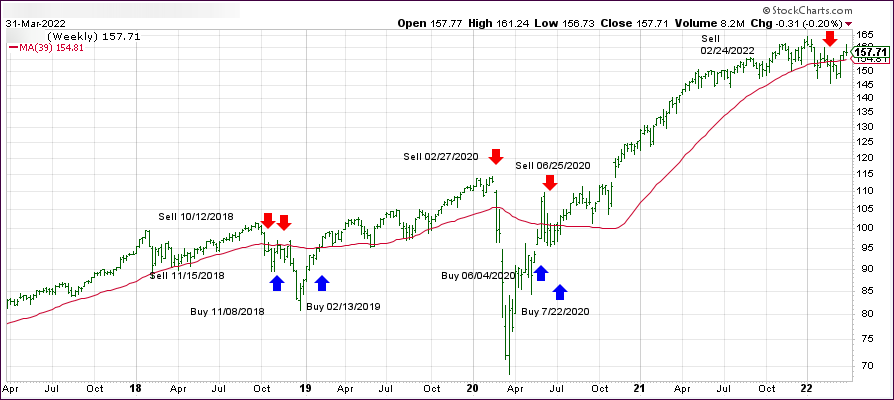
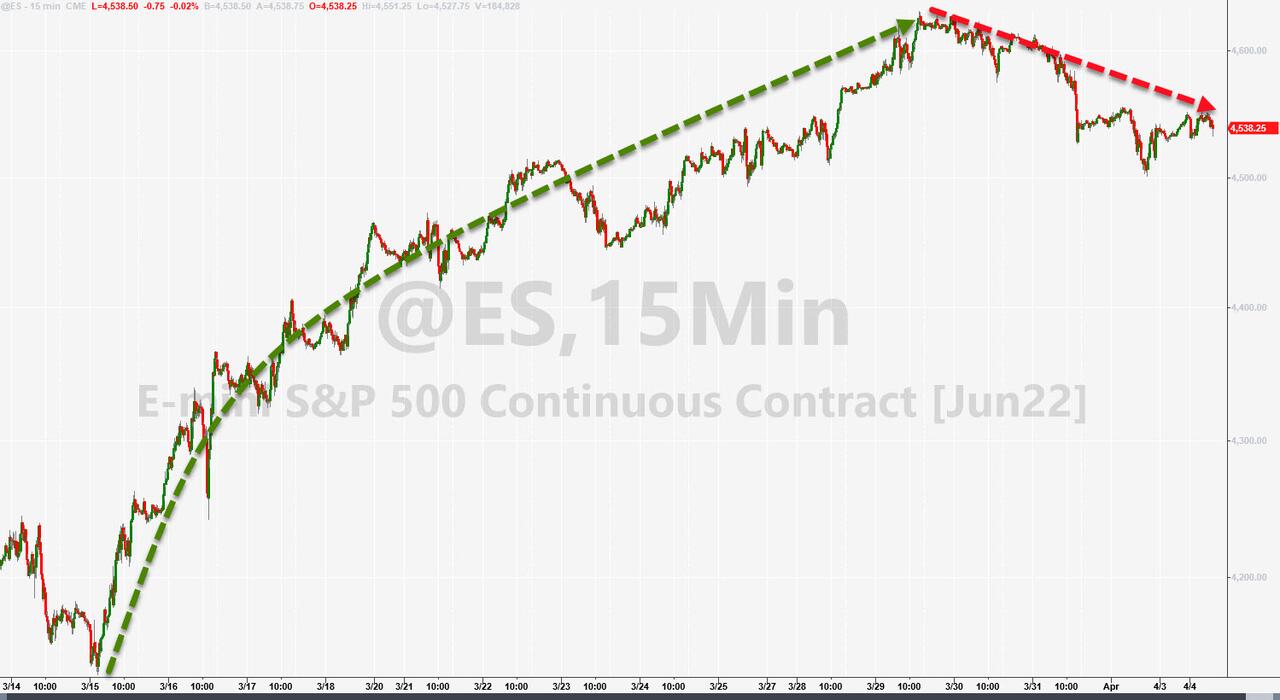
All majors plunged below critical support with the S&P 500 dipping below its 200-day M/A and the Nasdaq heading towards its 50-day M/A.

None of the Fed’s mouthpieces helped matters, especially with NY Fed President Dudley posting this warning:

It’s hard to know how much the U.S. Federal Reserve will need to do to get inflation under control. But one thing is certain: To be effective, it’ll have to inflict more losses on stock and bond investors than it has so far.

That goes along with what Fed head Powell has said (Hat tip ZH for this bon mot):

Financial conditions need to tighten. If this doesn’t happen on its own (which seems unlikely), the Fed will have to shock markets to achieve the desired response. This would mean hiking the federal funds rate considerably higher than currently anticipated. One way or another, to get inflation under control, the Fed will need to push bond yields higher and stock prices lower.

The Fed can’t get clearer on its intentions than the above. However, should markets dump, the question remains whether they will override their desire of seriously fighting inflation, or will they succumb to bailing out equities like they did the end of 2018?

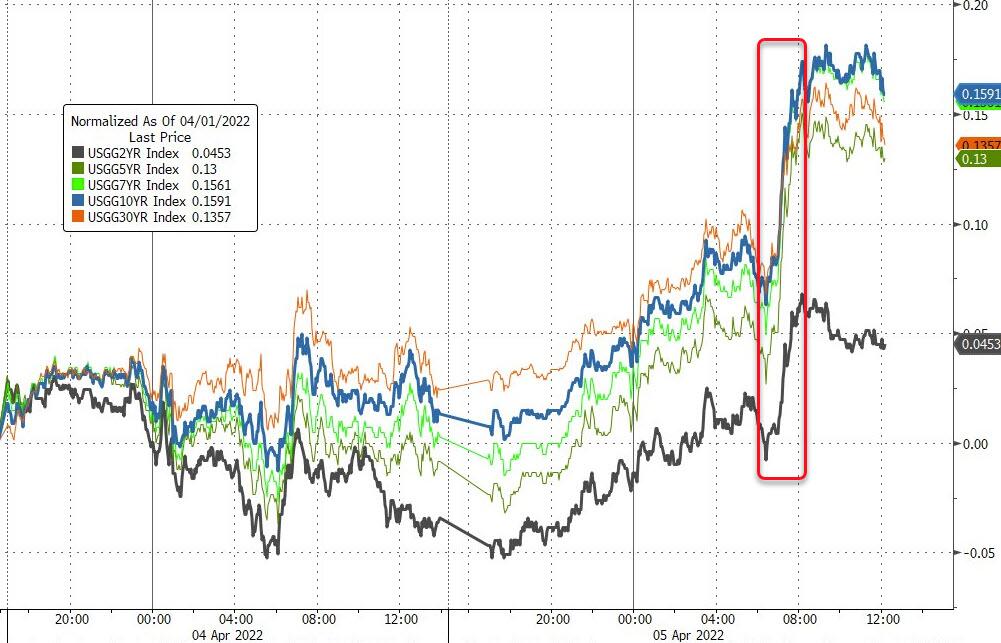
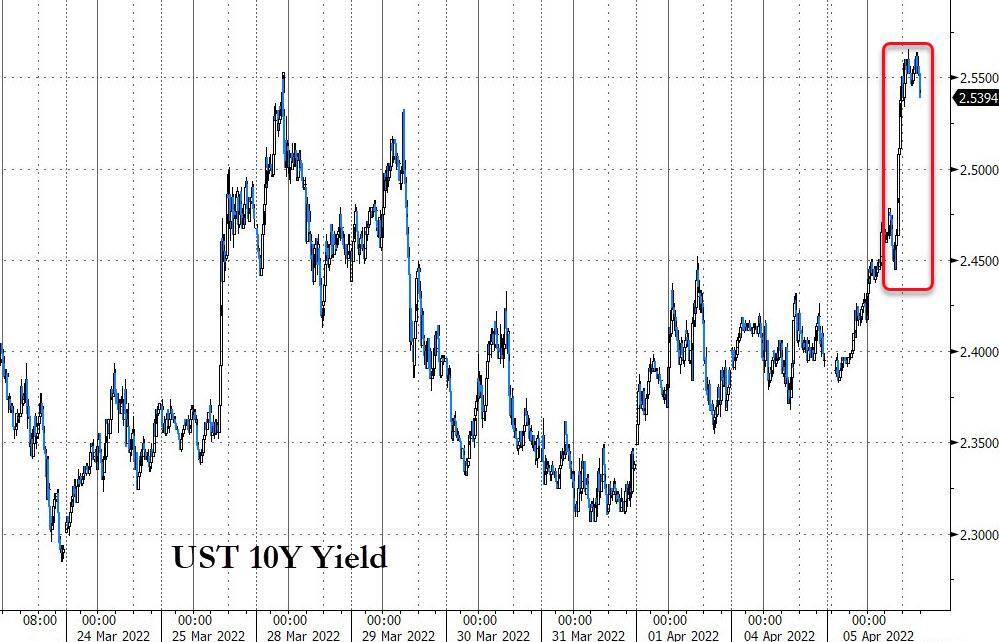
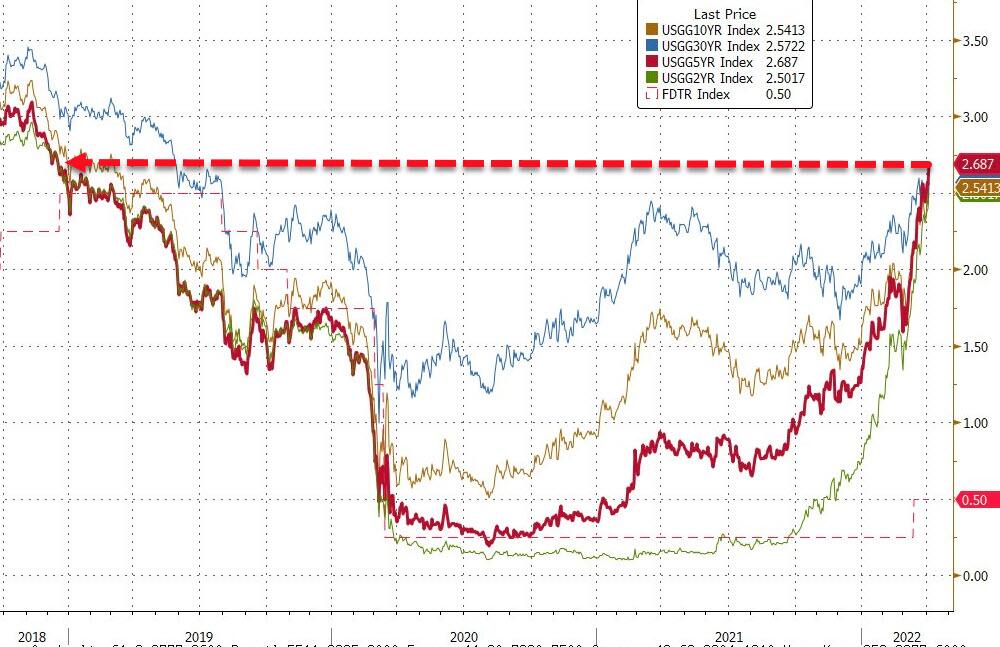
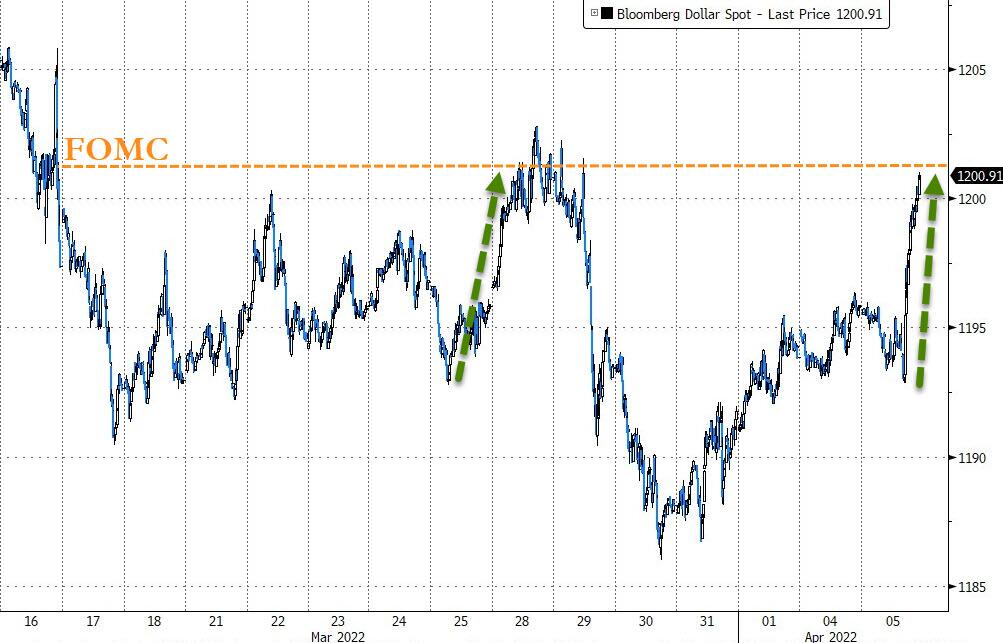
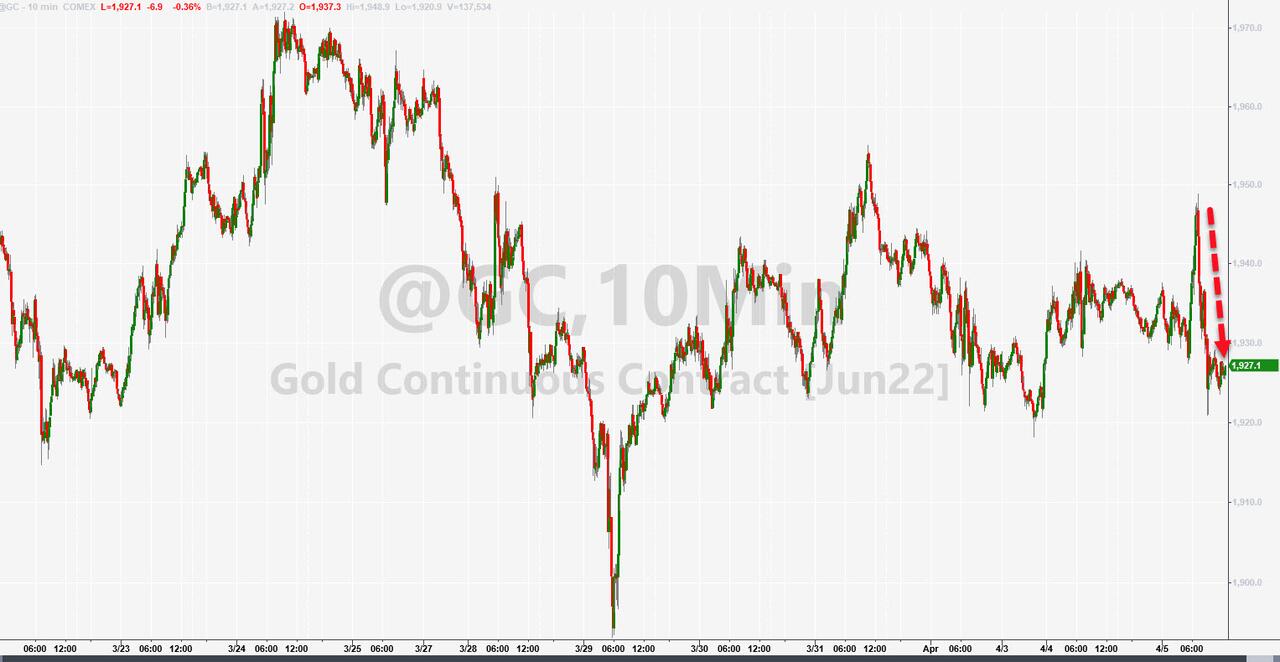
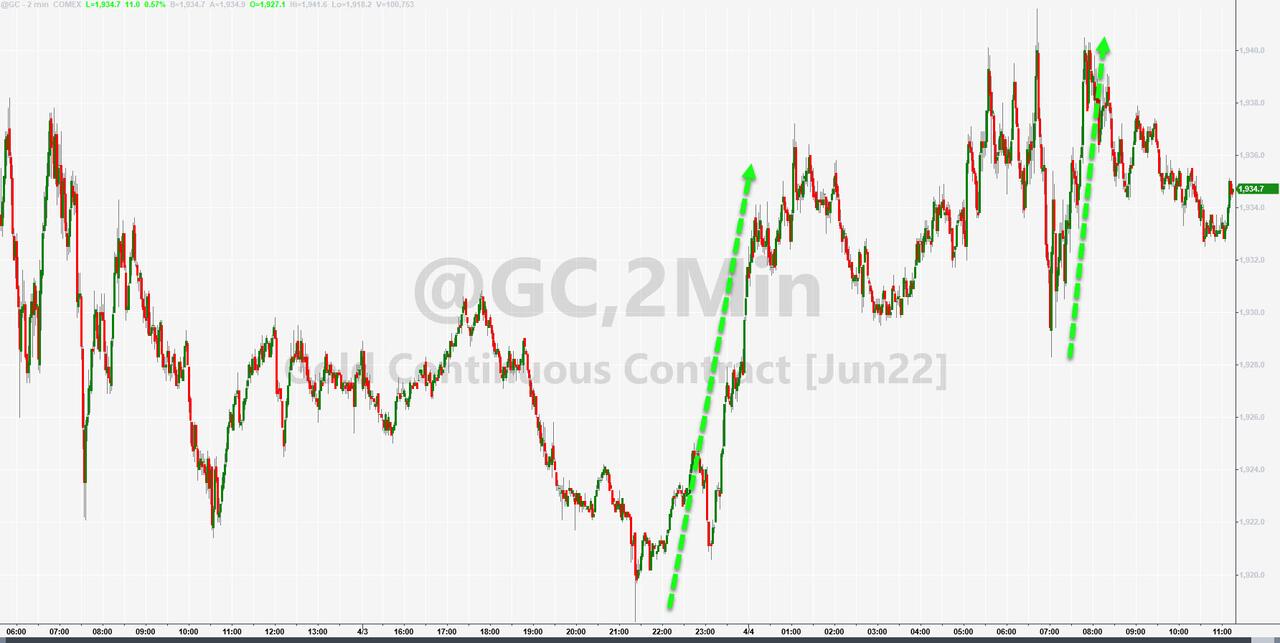
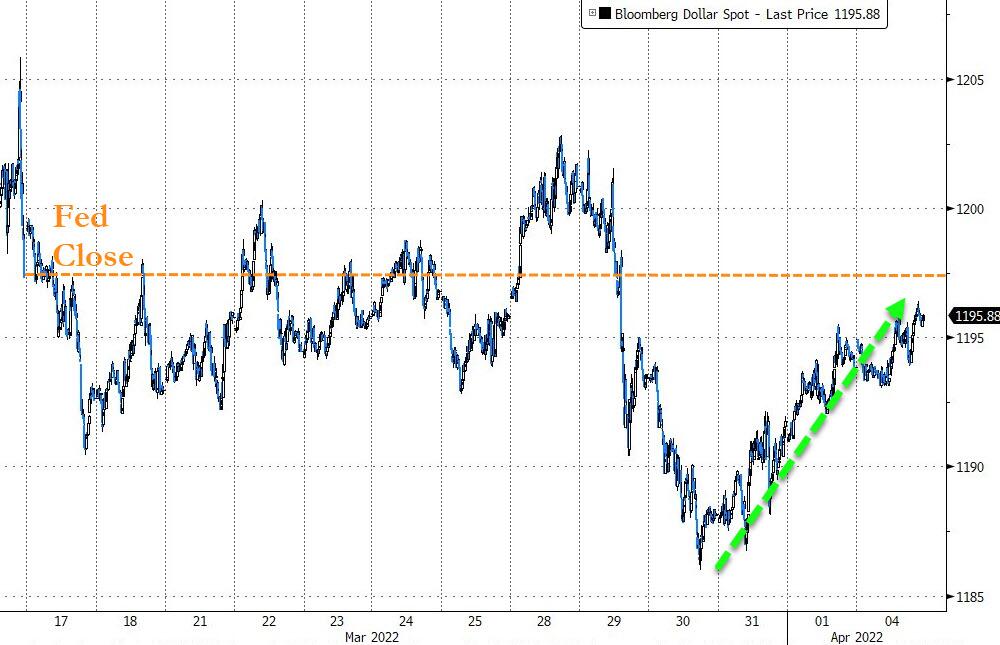
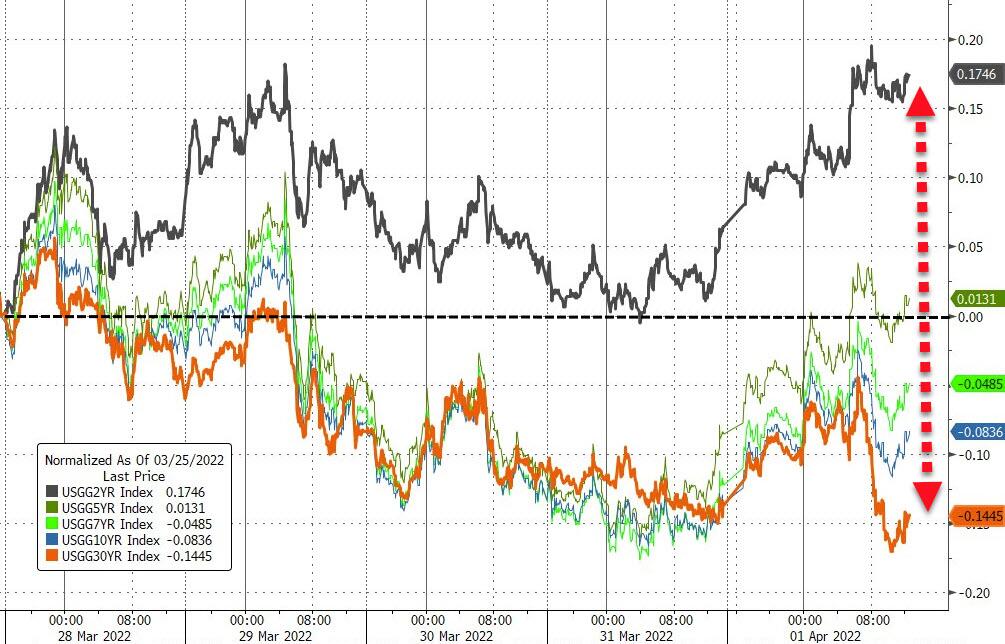
Bond yields jumped with the 10-year touching 2.65% intra-day, a high from which they backed off to close at 2.601%. The US Dollar gained a tad, and so did gold.

Once the actual rate hikes and QT implementations take place in May and June, it should become clear, even to those with blinders on, that these events will not be a positive for stocks.

Read More

Fears Of Econ Slowdown Trouble Markets

Ulli Market Commentary Contact

[Chart courtesy of MarketWatch.com]

  1. Moving the markets

While we saw a benign opening, things went south for the broad markets, as Monday’s theme of climbing a wall of worry was short lived with the major indexes giving back more than they gained yesterday. It brought back of thoughts as to whether this chart indeed is showing a topping formation.

Downward momentum accelerated in the last hour when Fed mouthpiece Brainard, a more dovish Fed member, opined that a more aggressive approach to the Central Bank’s policies might be in order.

Mark Zandi, chief economist at Moody’s Analytics, assessed the situation with much realism:

“Ultimately, the way this is going to work, the economy is going to slow, the stock market has to reflect that. So, I do expect the stock market to have a tough few months here as it ultimately adjusts to what the Fed is doing and will do going forward.”

That view went right along with Deutsche Bank’s statement forecasting a recession ahead, the first major Wall Street bank to do so.

Bond yields exploded to the upside with the 10-year adding 15 bps to end the session at 2.555%. Ouch! That crushed bond holders again with the widely held TLT getting clobbered at the tune of -2.26% bringing its YTD loss to -11.29%. We have now reached the highest yields since 2018.

Value” outperformed “growth” and yesterday’s market savior, namely the seemingly ever-present short squeeze, was absent today giving the “most shorted stocks” an opportunity to do what they do best: go lower.

The US Dollar headed higher, causing Gold to dip moderately.

In the end, ZH summed it up well by questioning the validity of this recent rally in the face of 9 more rate hikes this year. Graphically, it looks like this.

Hmm…

Read More

Scaling A Wall Of Worry

Ulli Market Commentary Contact

[Chart courtesy of MarketWatch.com]

  1. Moving the markets

Despite a negative news environment, traders ignored most of the headlines and the fact that US factory orders tumbled in February and scored their biggest drop since April 2020.

Also sounding a word of caution was this chart (hat tip to ZH) suggesting that the March melt up, AKA a short-cover rally, may be showing some momentum fatigue and nearing its end with most shorts now fully covered thereby eliminating them as a future driving force—except today, when they suddenly came to life again.

None of the above mattered, as the major indexes seemed to climb a wall of worry by ending the session with solid gains led by the much beaten-up tech sector, sort of a relief rally.

Equities and bonds are still sending diverging indications about the economy, which look to be depending on the headline news of the day, as yield curve inversions are pointing towards a recession, while cease-fire talks in Ukraine appear to change by the moment. Both are contributing to market- and economic uncertainties, but they should not be over-analyzed on a day-to-day basis.

With “value” having had the upper hand YTD over “growth”, today was opposite day, with the latter outperforming the former, which allowed the Nasdaq to be the top dog for this session. Even the “unprofitable tech stock basket” managed a long overdue rebound.     

Gold had a positive session, as did the US Dollar, which continued its upward swing for the 3rd day in a row.

In the end, it’s all about market expectations of rate hikes and future rate cuts, as this chart demonstrates.

Read More

ETFs On The Cutline – Updated Through 04/01/2022

Ulli ETFs on the Cutline Contact

Below, please find the latest High-Volume ETF Cutline report, which shows how far above or below their respective long-term trend lines (39-week SMA) my currently tracked ETFs are positioned.

This report covers the HV ETF Master List from Thursday’s StatSheet and includes 312 High Volume ETFs, defined as those with an average daily volume of more than $5 million, of which currently 117 (last week 117) are hovering in bullish territory. The yellow line separates those ETFs that are positioned above their trend line (%M/A) from those that have dropped below it.

Take a look:                                                                   

The HV ETF Master Cutline Report

In case you are not familiar with some of the terminology used in the reports, please read the Glossary of Terms. If you missed the original post about the Cutline approach, you can read it here.      

ETF Tracker Newsletter For April 1, 2022

Ulli ETF Tracker Contact

ETF Tracker StatSheet          

You can view the latest version here.

ATTEMPTING A COMEBACK

[Chart courtesy of MarketWatch.com]

  1. Moving the markets

A new quarter is upon us, and many investors prefer not being reminded of the first one, because it turned out to be the worst in 2 years,

Yesterday’s sudden drubbing, with the Dow dumping some 550 points, was almost a reflection of what we saw during the first three months of this year. While today’s comeback attempt succeeded in the end, it was nevertheless a roller coaster ride with the S&P 500 bouncing above and below its unchanged line.

The Transportation index got hammered and had its worst week since January 2021, as ZH pointed out. A similar smashing took place with Truck stocks, as job losses affected that arena as well. In the world of sectors, Financials fared the worst and Utilities the best.

Bonds had another wild outing, with the yield curve inversion getting worse and affecting just about all maturities. Again, an inversion occurs when near term bonds yield more than longer term ones, an oddity that has historically pointed to a recession.

As ZH explained with this chart, let’s hope that the yield curve’s premonition is not a reflection of where stocks should be, because that would wipe out the last 4 years of gains for those that are stuck in the buy-and-hold approach to investing.   

Read More

Weekly StatSheet For The ETF Tracker Newsletter – Updated Through 03/31/2022

Ulli ETF StatSheet Contact

ETF Data updated through Thursday, March 31, 2022

Methodology/Use of this StatSheet:

1. From the universe of over 1,800 ETFs, I have selected only those with a trading volume of over $5 million per day (HV ETFs), so that liquidity and a small bid/ask spread are assured.

2. Trend Tracking Indexes (TTIs)

Buy or Sell decisions for Domestic and International ETFs (section 1 and 2), are made based on the respective TTI and its position either above or below its long-term M/A (Moving Average). A crossing of the trend line from below accompanied by some staying power above constitutes a “Buy” signal. Conversely, a clear break below the line constitutes a “Sell” signal. Additionally, I use an 12% trailing stop loss on all positions in these categories to control downside risk.

3. All other investment arenas do not have a TTI and should be traded based on the position of the individual ETF relative to its own respective trend line (%M/A). That’s why those signals are referred to as a “Selective Buy.” In other words, if an ETF crosses its own trendline to the upside, a “Buy” signal is generated. Here too, I recommend trailing sell stop of 12%, or less, depending on your risk tolerance.

If you are unfamiliar with some of the terminology, please see Glossary of Terms and new subscriber information in section 9.     

1. DOMESTIC EQUITY ETFs: SELL — since 02/24/2022

Click on chart to enlarge

Our main directional indicator, the Domestic Trend Tracking Index (TTI-green line in the above chart) has just broken above its long-term trend line (red) by +1.99% and remains in “SELL” mode—although it is on the edge of moving back to the Buy side.

Read More