
ETF Tracker StatSheet
You can view the latest version here.
ATTEMPTING A COMEBACK
- Moving the markets
A new quarter is upon us, and many investors prefer not being reminded of the first one, because it turned out to be the worst in 2 years,
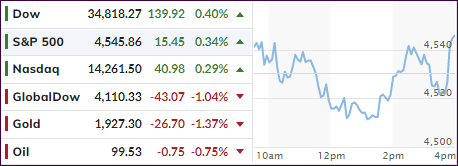
Yesterday’s sudden drubbing, with the Dow dumping some 550 points, was almost a reflection of what we saw during the first three months of this year. While today’s comeback attempt succeeded in the end, it was nevertheless a roller coaster ride with the S&P 500 bouncing above and below its unchanged line.
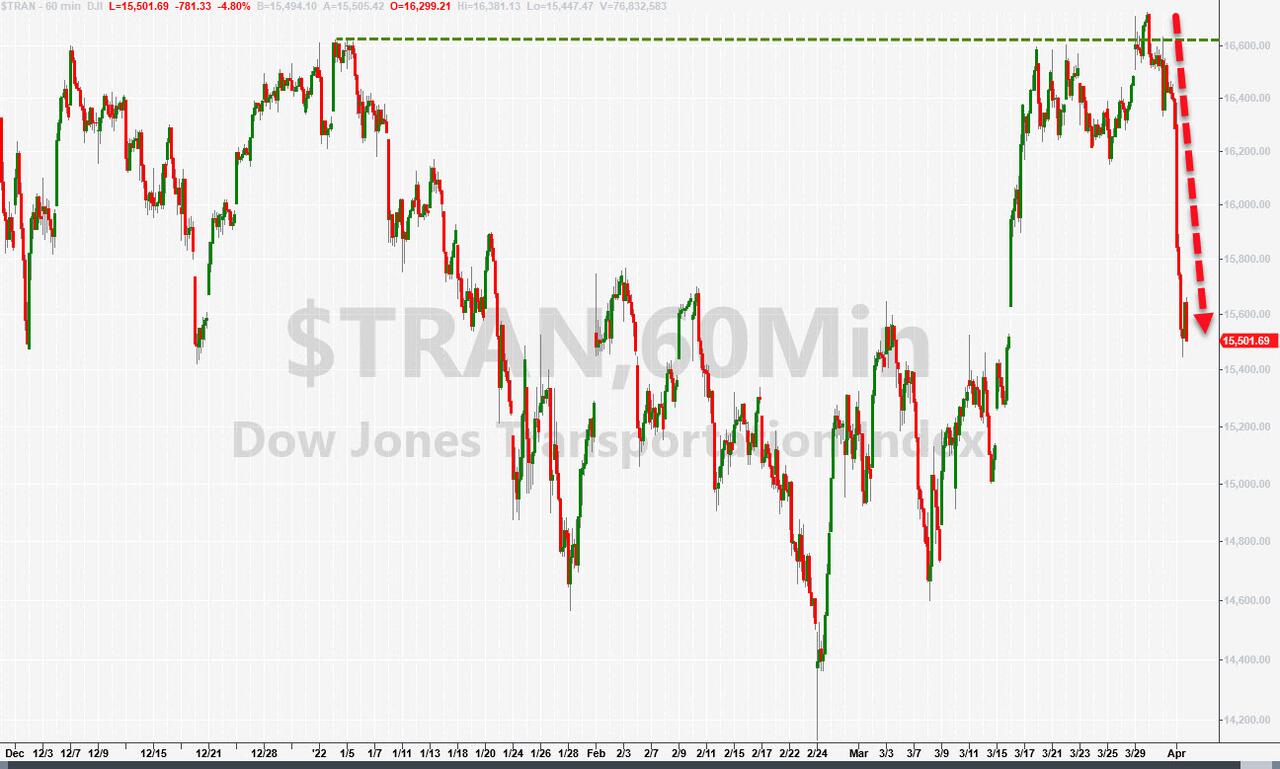
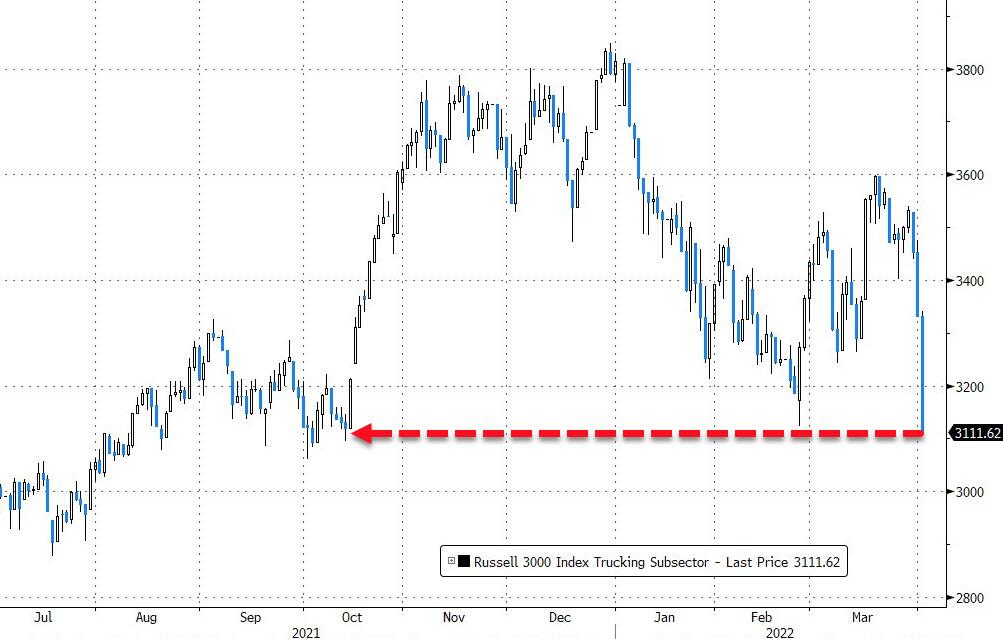
The Transportation index got hammered and had its worst week since January 2021, as ZH pointed out. A similar smashing took place with Truck stocks, as job losses affected that arena as well. In the world of sectors, Financials fared the worst and Utilities the best.
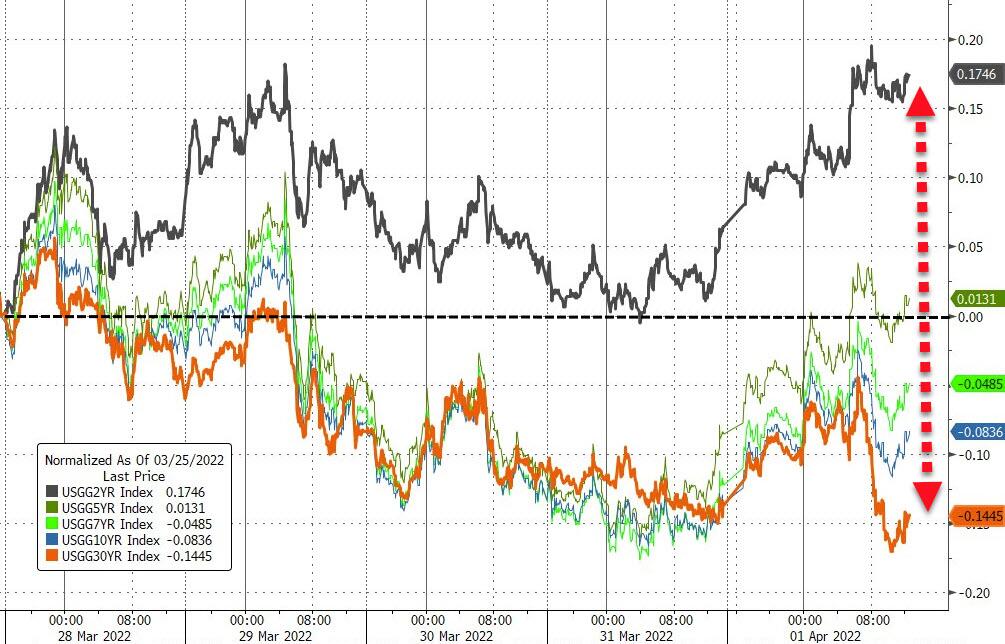
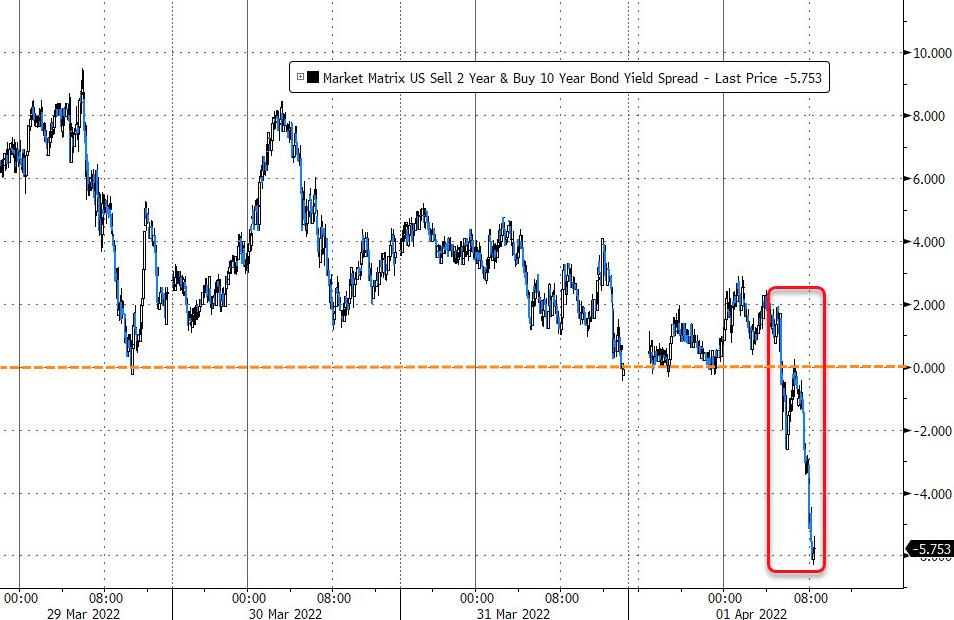
Bonds had another wild outing, with the yield curve inversion getting worse and affecting just about all maturities. Again, an inversion occurs when near term bonds yield more than longer term ones, an oddity that has historically pointed to a recession.
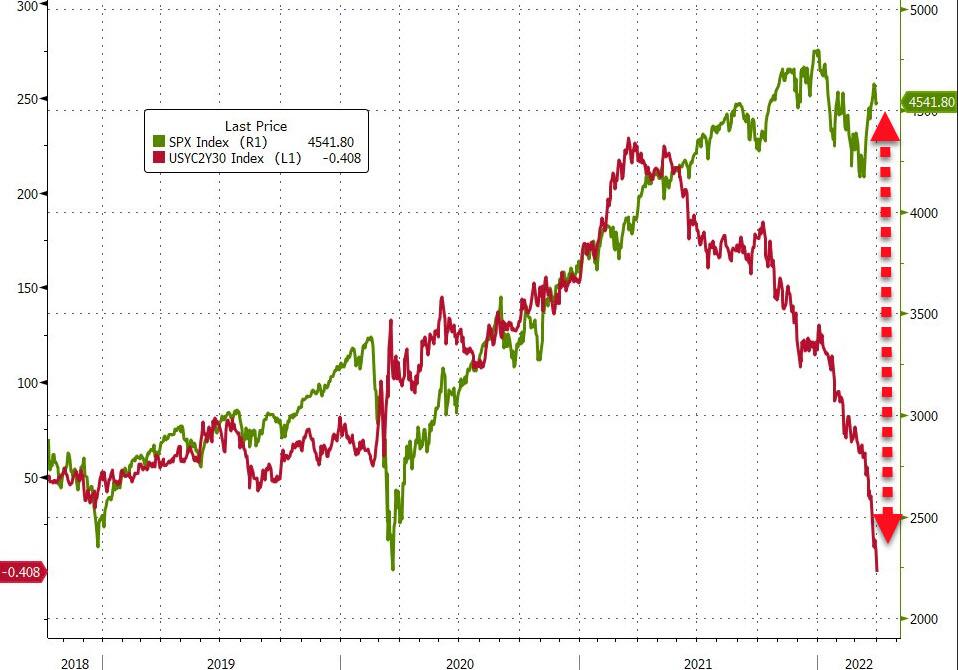
As ZH explained with this chart, let’s hope that the yield curve’s premonition is not a reflection of where stocks should be, because that would wipe out the last 4 years of gains for those that are stuck in the buy-and-hold approach to investing.
2. ETFs in the Spotlight
In case you missed the announcement and description of this section, you can read it here again.
It features some of the 10 broadly diversified domestic and sector ETFs from my HighVolume list as posted every Saturday. Furthermore, they are screened for the lowest MaxDD% number meaning they have been showing better resistance to temporary sell offs than all others over the past year.
The below table simply demonstrates the magnitude with which these ETFs are fluctuating above or below their respective individual trend lines (%+/-M/A). A break below, represented by a negative number, shows weakness, while a break above, represented by a positive percentage, shows strength.
For hundreds of ETF choices, be sure to reference Thursday’s StatSheet.
For this just closed-out domestic “Buy” cycle, here’s how some of our candidates have fared:

Click image to enlarge.
Again, the %+/-M/A column above shows the position of the various ETFs in relation to their respective long-term trend lines, while the trailing sell stops are being tracked in the “Off High” column. The “Action” column will signal a “Sell” once the -12% point has been taken out in the “Off High” column, which has replaced the prior -8% to -10% limits.
3. Trend Tracking Indexes (TTIs)
Our TTIs dropped sharply yesterday in sync with equities and rebounded today. We are now getting close to issuing a new “Buy” signal in the Domestic arena. Let’s see if the bulls have any ammo left, as we start next week.
This is how we closed 04/01/2022:
Domestic TTI: +2.73% above its M/A (prior close +1.99%)—Sell signal effective 02/24/2022.
International TTI: +1.13% above its M/A (prior close +0.88%)—Sell signal effective 03/08/2022.
Disclosure: I am obliged to inform you that I, as well as my advisory clients, own some of the ETFs listed in the above table. Furthermore, they do not represent a specific investment recommendation for you, they merely show which ETFs from the universe I track are falling within the specified guidelines.
All linked charts above are courtesy of Bloomberg via ZeroHedge.
———————————————————-
WOULD YOU LIKE TO HAVE YOUR INVESTMENTS PROFESSIONALLY MANAGED?
Do you have the time to follow our investment plans yourself? If you are a busy professional who would like to have his portfolio managed using our methodology, please contact me directly or get more details.
Contact Ulli