
- Moving the markets
Despite a negative news environment, traders ignored most of the headlines and the fact that US factory orders tumbled in February and scored their biggest drop since April 2020.
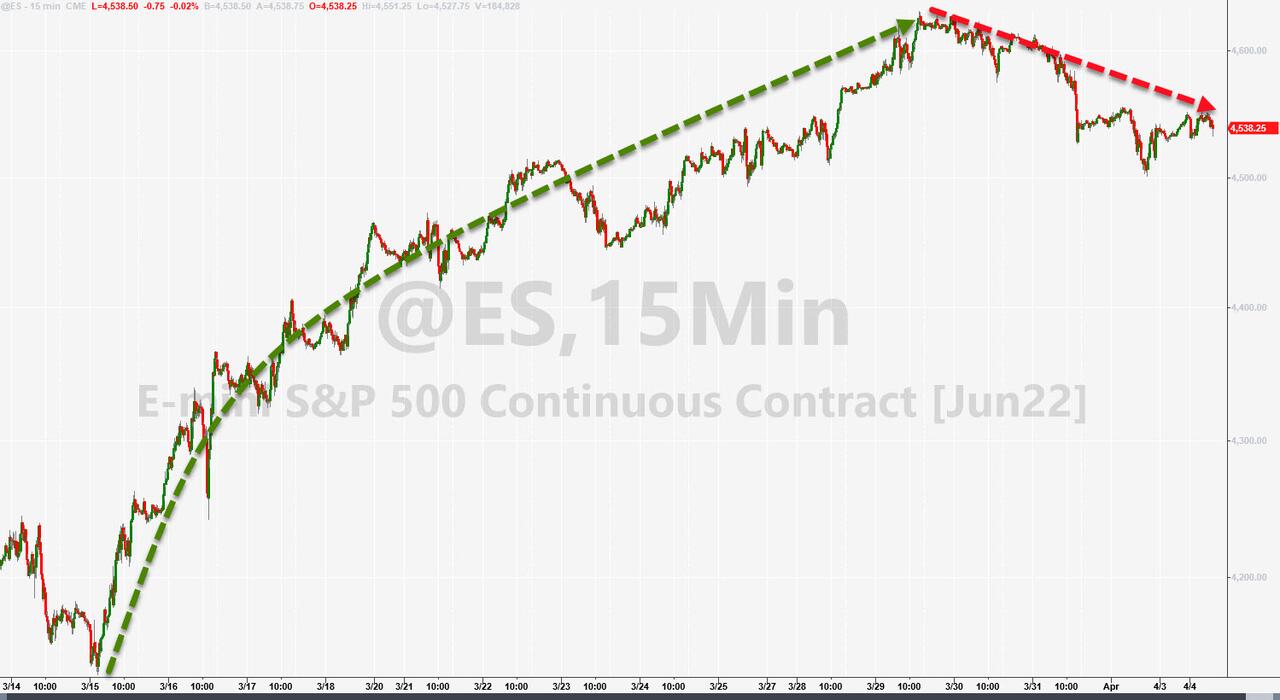
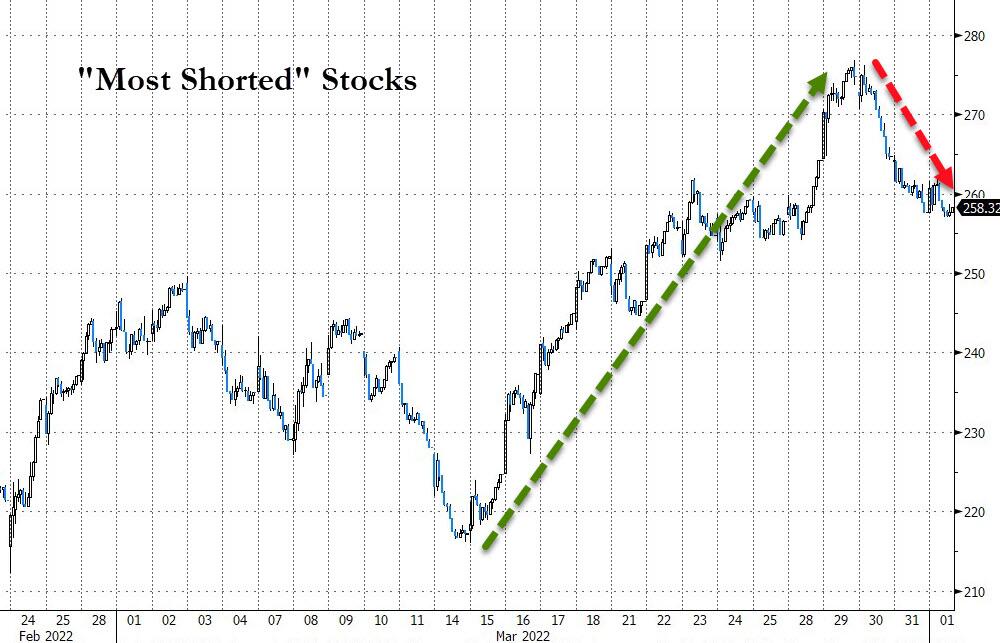
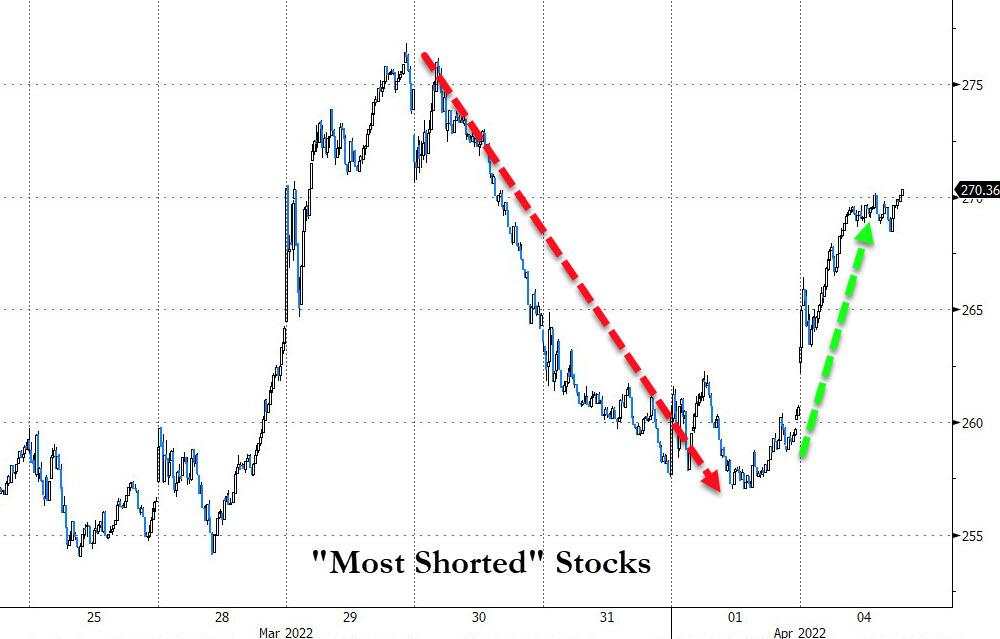
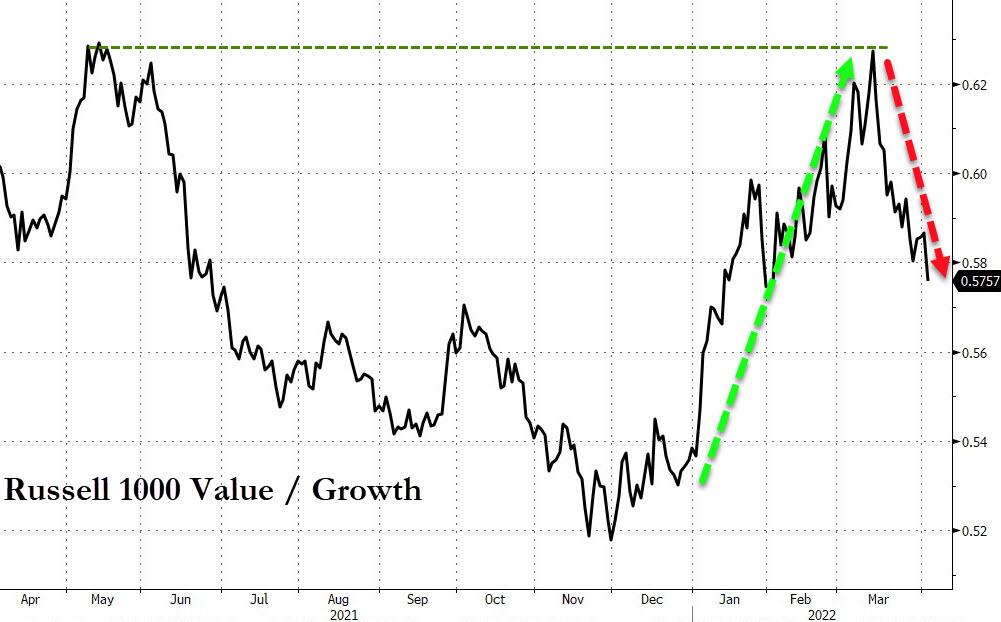
Also sounding a word of caution was this chart (hat tip to ZH) suggesting that the March melt up, AKA a short-cover rally, may be showing some momentum fatigue and nearing its end with most shorts now fully covered thereby eliminating them as a future driving force—except today, when they suddenly came to life again.
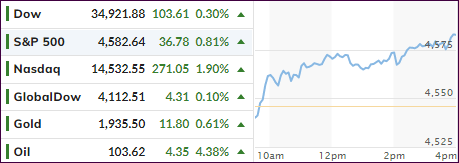
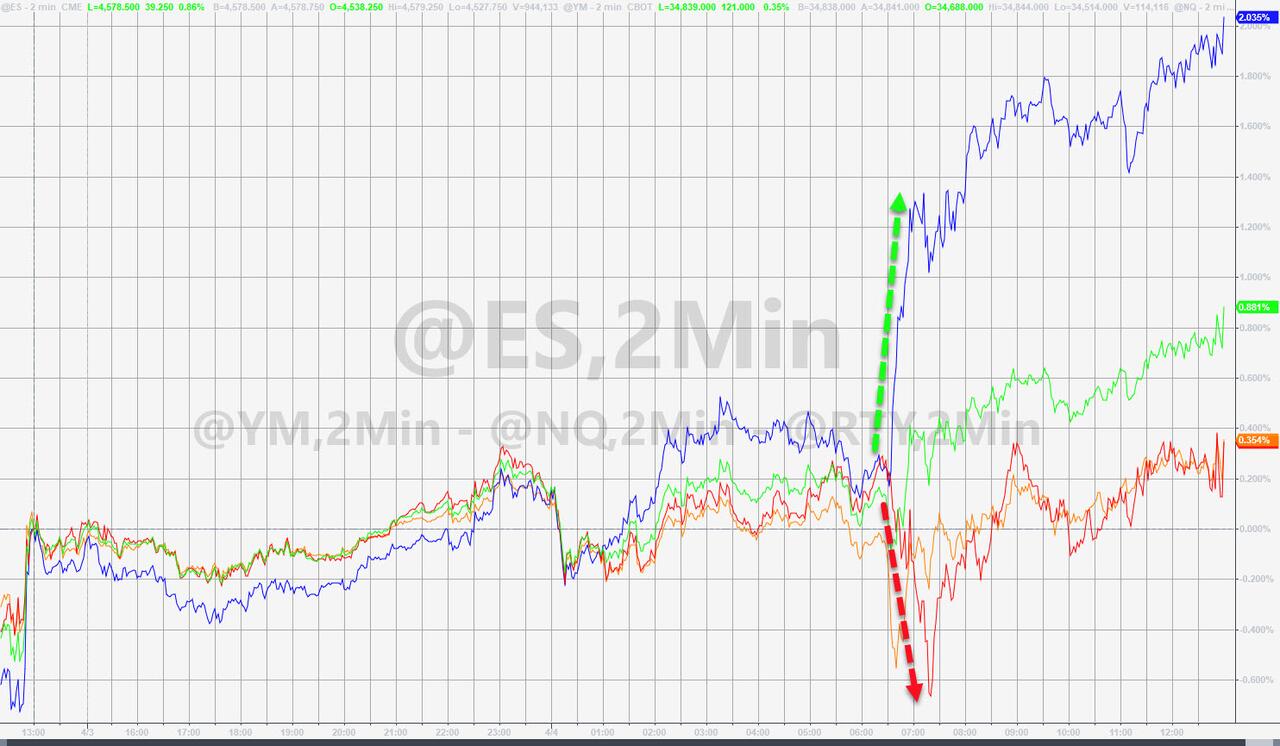
None of the above mattered, as the major indexes seemed to climb a wall of worry by ending the session with solid gains led by the much beaten-up tech sector, sort of a relief rally.
Equities and bonds are still sending diverging indications about the economy, which look to be depending on the headline news of the day, as yield curve inversions are pointing towards a recession, while cease-fire talks in Ukraine appear to change by the moment. Both are contributing to market- and economic uncertainties, but they should not be over-analyzed on a day-to-day basis.
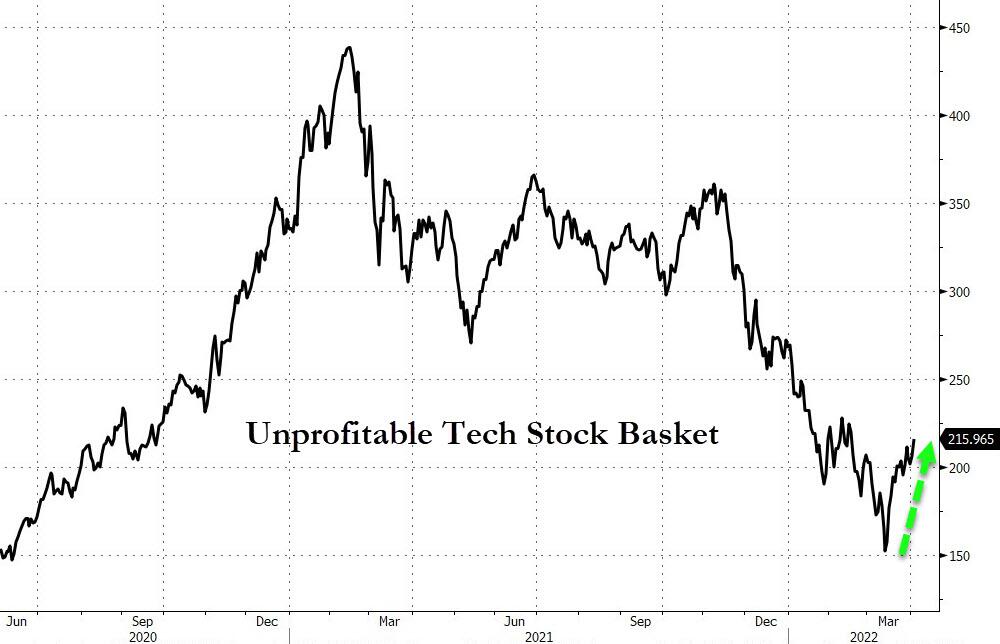
With “value” having had the upper hand YTD over “growth”, today was opposite day, with the latter outperforming the former, which allowed the Nasdaq to be the top dog for this session. Even the “unprofitable tech stock basket” managed a long overdue rebound.
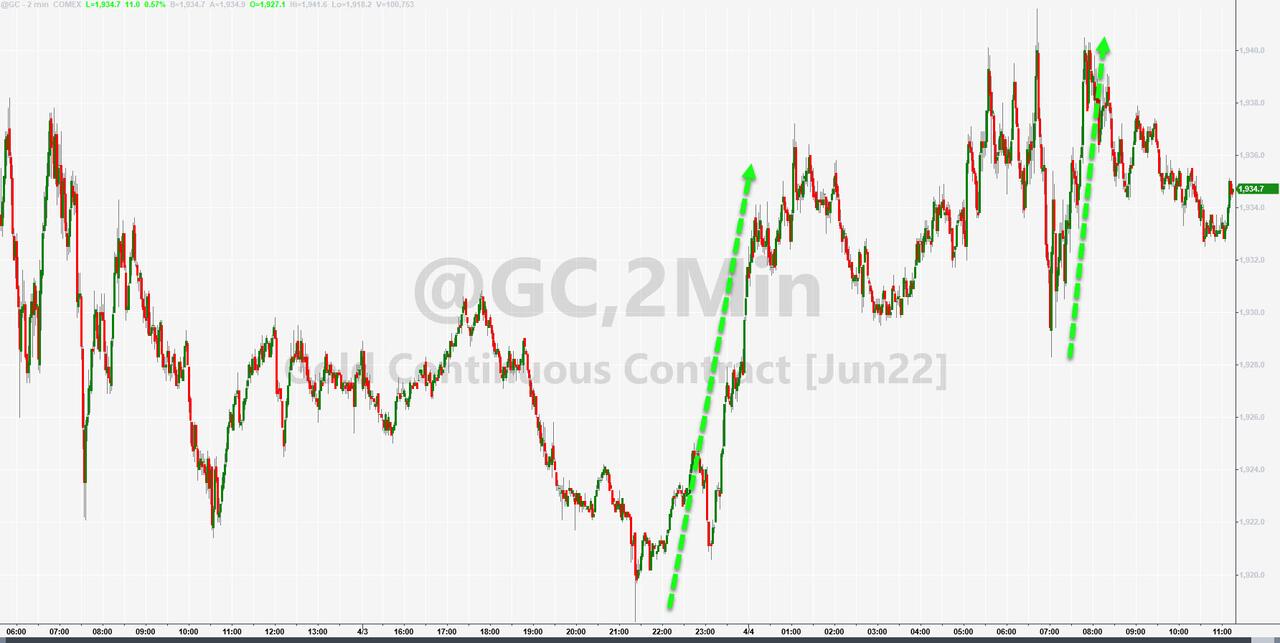
Gold had a positive session, as did the US Dollar, which continued its upward swing for the 3rd day in a row.
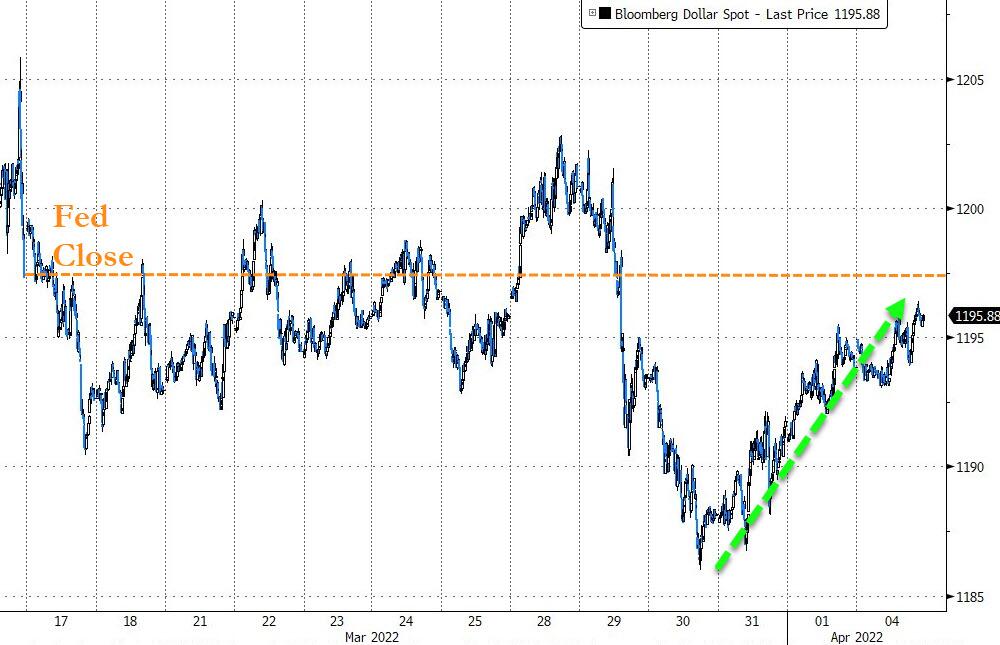
In the end, it’s all about market expectations of rate hikes and future rate cuts, as this chart demonstrates.
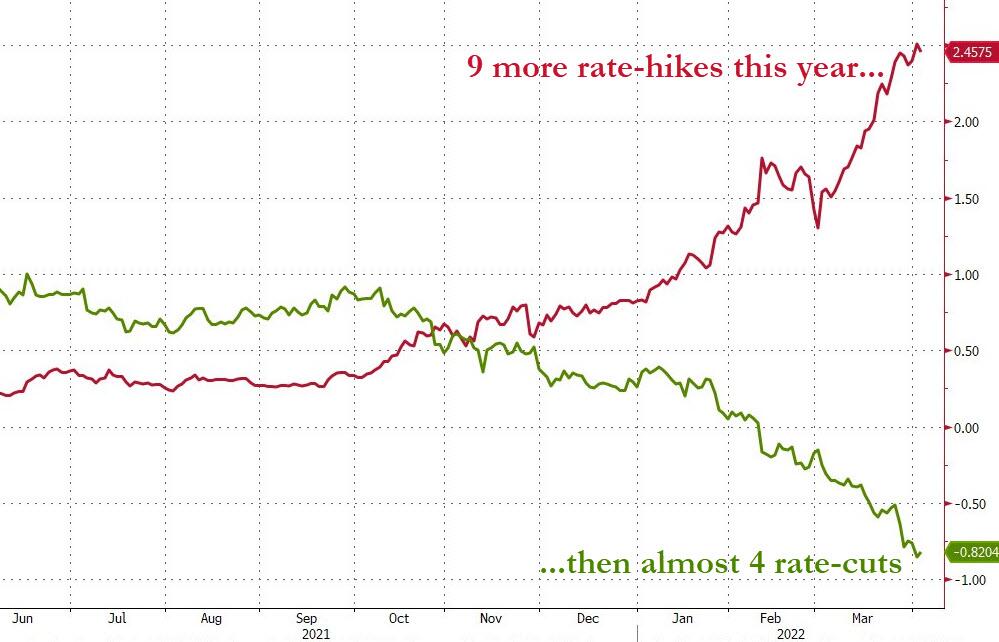
2. ETFs in the Spotlight
In case you missed the announcement and description of this section, you can read it here again.
It features some of the 10 broadly diversified domestic and sector ETFs from my HighVolume list as posted every Saturday. Furthermore, they are screened for the lowest MaxDD% number meaning they have been showing better resistance to temporary sell offs than all others over the past year.
The below table simply demonstrates the magnitude with which these ETFs are fluctuating above or below their respective individual trend lines (%+/-M/A). A break below, represented by a negative number, shows weakness, while a break above, represented by a positive percentage, shows strength.
For hundreds of ETF choices, be sure to reference Thursday’s StatSheet.
For this just closed-out domestic “Buy” cycle, here’s how some of our candidates have fared:
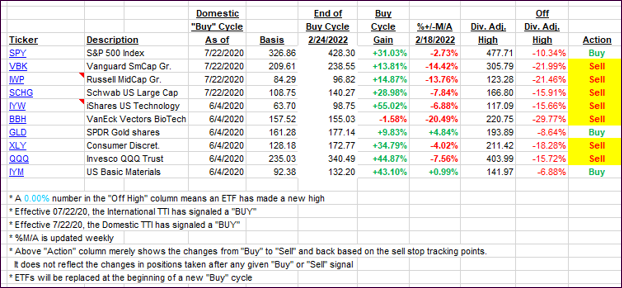
Click image to enlarge.
Again, the %+/-M/A column above shows the position of the various ETFs in relation to their respective long-term trend lines, while the trailing sell stops are being tracked in the “Off High” column. The “Action” column will signal a “Sell” once the -12% point has been taken out in the “Off High” column, which has replaced the prior -8% to -10% limits.
3. Trend Tracking Indexes (TTIs)
Our TTIs edged a little higher with the Domestic one now confirming a new “Buy” signal. If you follow along on your own, feel free to use my Thursday StatSheet for appropriate ETF selections. I suggest you not only ease your way into the market incrementally but also determine your exit strategy, should this signal prove to be a false one.
Again, if there is a considerable sell-off tomorrow, I will hold off from implementing this “Buy” for another day.
This is how we closed 04/04/2022:
Domestic TTI: +2.95% above its M/A (prior close +2.73%)—Sell signal effective 02/24/2022.
International TTI: +1.18% above its M/A (prior close +1.13%)—Sell signal effective 03/08/2022.
Disclosure: I am obliged to inform you that I, as well as my advisory clients, own some of the ETFs listed in the above table. Furthermore, they do not represent a specific investment recommendation for you, they merely show which ETFs from the universe I track are falling within the specified guidelines.
All linked charts above are courtesy of Bloomberg via ZeroHedge.
Contact Ulli