
- Moving the markets
The highly anticipated Fed minutes turned out to be more hawkish than expected in terms of QT (Quantitative Tightening) and future rate hikes, which ZH summed up like this:
- As much as $95 billion in asset runoff per month ($60-90 bn expected)
- Many Fed officials say half-point hikes may be warranted
- Fed sees need to get to neutral posture ‘expeditiously’
- Fed fears public loss of confidence in is resolve over inflation
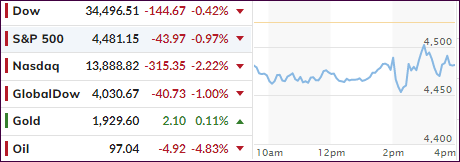
That pushed the Dow down some 250 points right after the opening with the other 2 major indexes following suit. While an afternoon comeback cut losses, the Nasdaq still took the brunt of the beating by losing 2.2% on the day.
All majors plunged below critical support with the S&P 500 dipping below its 200-day M/A and the Nasdaq heading towards its 50-day M/A.
None of the Fed’s mouthpieces helped matters, especially with NY Fed President Dudley posting this warning:
It’s hard to know how much the U.S. Federal Reserve will need to do to get inflation under control. But one thing is certain: To be effective, it’ll have to inflict more losses on stock and bond investors than it has so far.
That goes along with what Fed head Powell has said (Hat tip ZH for this bon mot):
Financial conditions need to tighten. If this doesn’t happen on its own (which seems unlikely), the Fed will have to shock markets to achieve the desired response. This would mean hiking the federal funds rate considerably higher than currently anticipated. One way or another, to get inflation under control, the Fed will need to push bond yields higher and stock prices lower.
The Fed can’t get clearer on its intentions than the above. However, should markets dump, the question remains whether they will override their desire of seriously fighting inflation, or will they succumb to bailing out equities like they did the end of 2018?
Bond yields jumped with the 10-year touching 2.65% intra-day, a high from which they backed off to close at 2.601%. The US Dollar gained a tad, and so did gold.
Once the actual rate hikes and QT implementations take place in May and June, it should become clear, even to those with blinders on, that these events will not be a positive for stocks.
2. ETFs in the Spotlight
In case you missed the announcement and description of this section, you can read it here again.
It features some of the 10 broadly diversified domestic and sector ETFs from my HighVolume list as posted every Saturday. Furthermore, they are screened for the lowest MaxDD% number meaning they have been showing better resistance to temporary sell offs than all others over the past year.
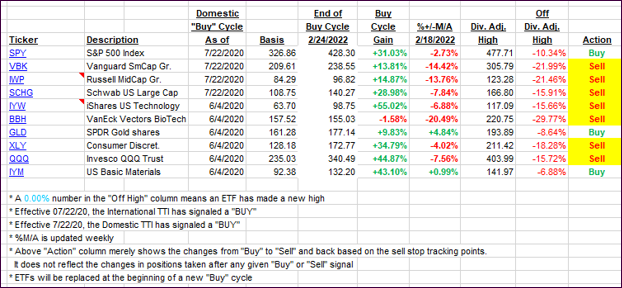
The below table simply demonstrates the magnitude with which these ETFs are fluctuating above or below their respective individual trend lines (%+/-M/A). A break below, represented by a negative number, shows weakness, while a break above, represented by a positive percentage, shows strength.
For hundreds of ETF choices, be sure to reference Thursday’s StatSheet.
For this just closed-out domestic “Buy” cycle, here’s how some of our candidates have fared:
Click image to enlarge.
Again, the %+/-M/A column above shows the position of the various ETFs in relation to their respective long-term trend lines, while the trailing sell stops are being tracked in the “Off High” column. The “Action” column will signal a “Sell” once the -12% point has been taken out in the “Off High” column, which has replaced the prior -8% to -10% limits.
3. Trend Tracking Indexes (TTIs)
Just what I emphasized yesterday came true today as, just like that the International TTI dropped back into bear market territory, thereby validating our current position of being out of that market.
The Domestic one headed south as well but was saved thanks to an afternoon rebound, but who knows what’s next in this topsy turvy world.
This is how we closed 04/06/2022:
Domestic TTI: +1.34% above its M/A (prior close +1.85%)—Sell signal effective 02/24/2022.
International TTI: -0.84% below its M/A (prior close +0.02%)—Sell signal effective 03/08/2022.
Disclosure: I am obliged to inform you that I, as well as my advisory clients, own some of the ETFs listed in the above table. Furthermore, they do not represent a specific investment recommendation for you, they merely show which ETFs from the universe I track are falling within the specified guidelines.
All linked charts above are courtesy of Bloomberg via ZeroHedge.
Contact Ulli