Another Swan Dive

Ulli Market Commentary Contact

[Chart courtesy of MarketWatch.com]

  1. Moving the markets

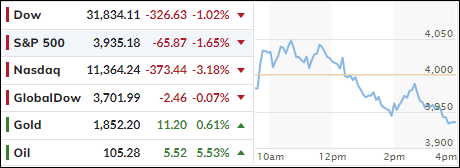
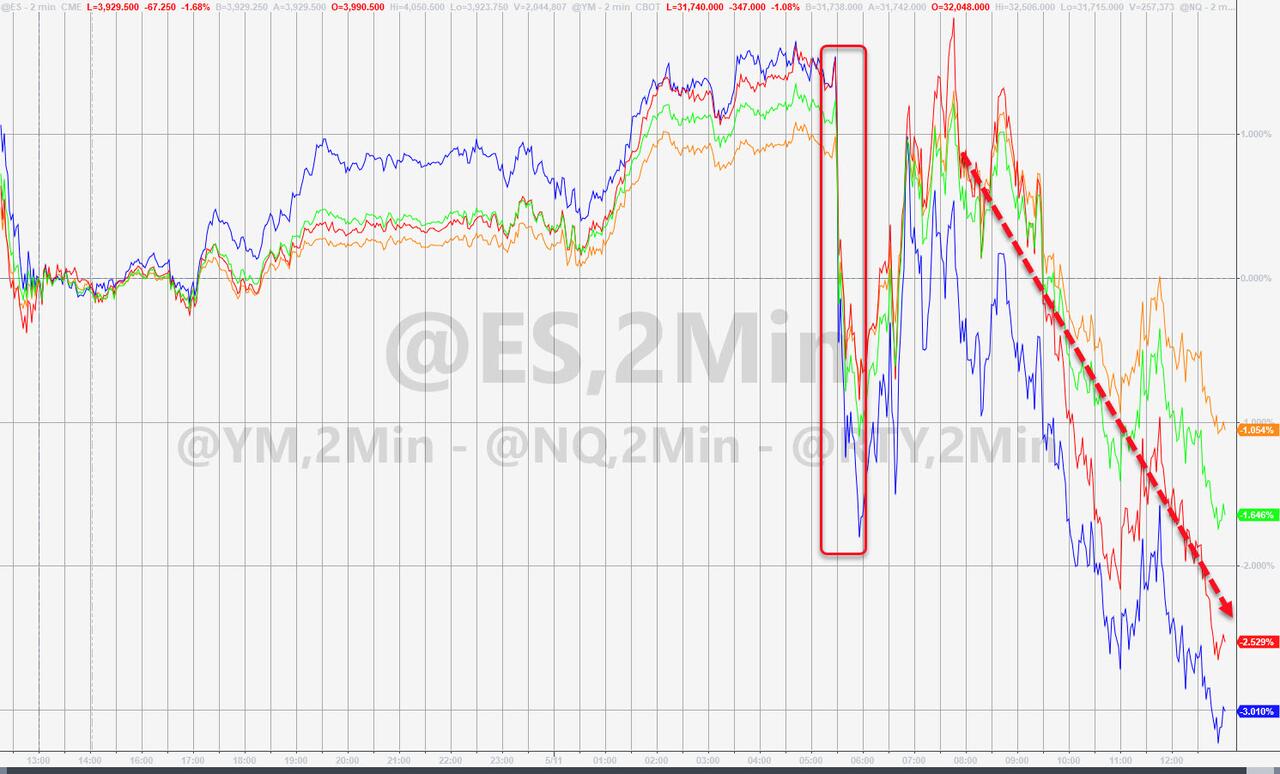
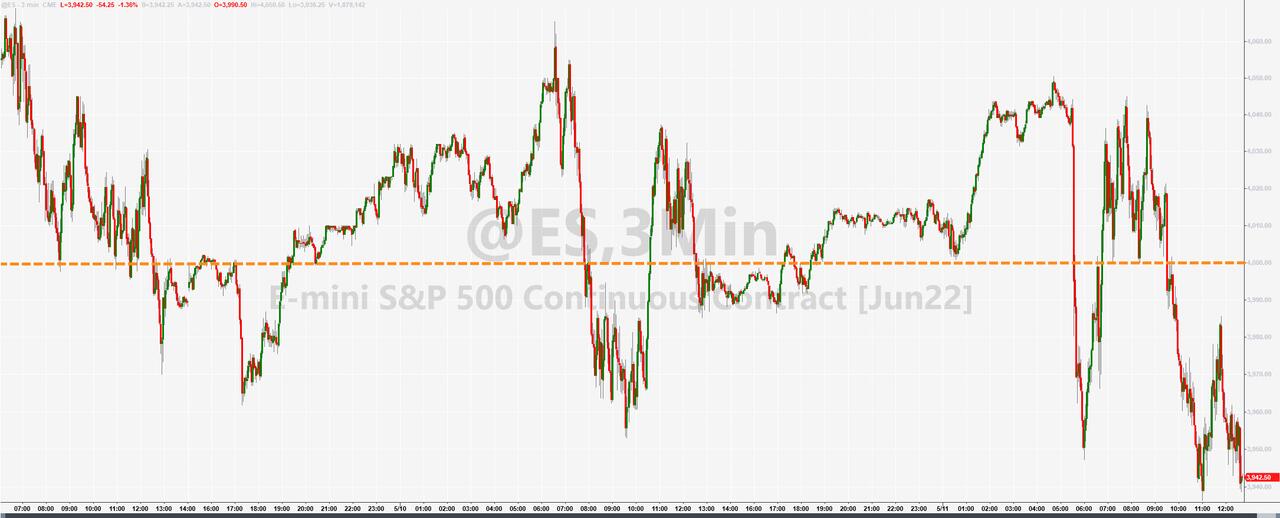
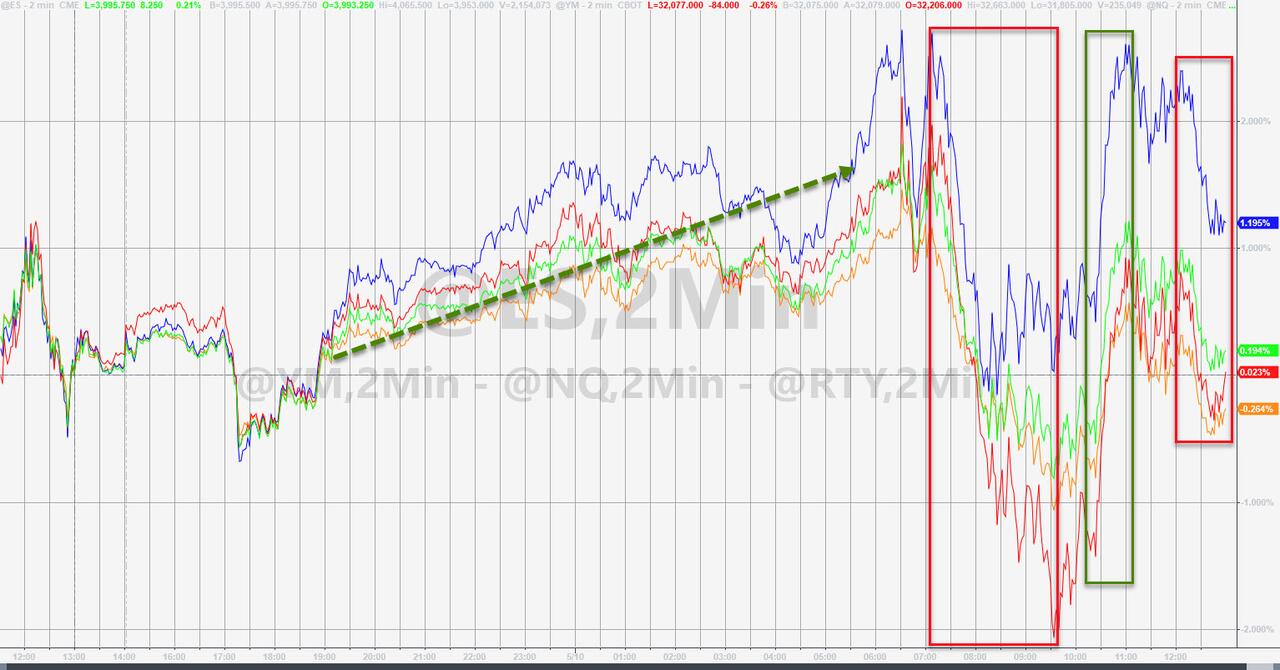
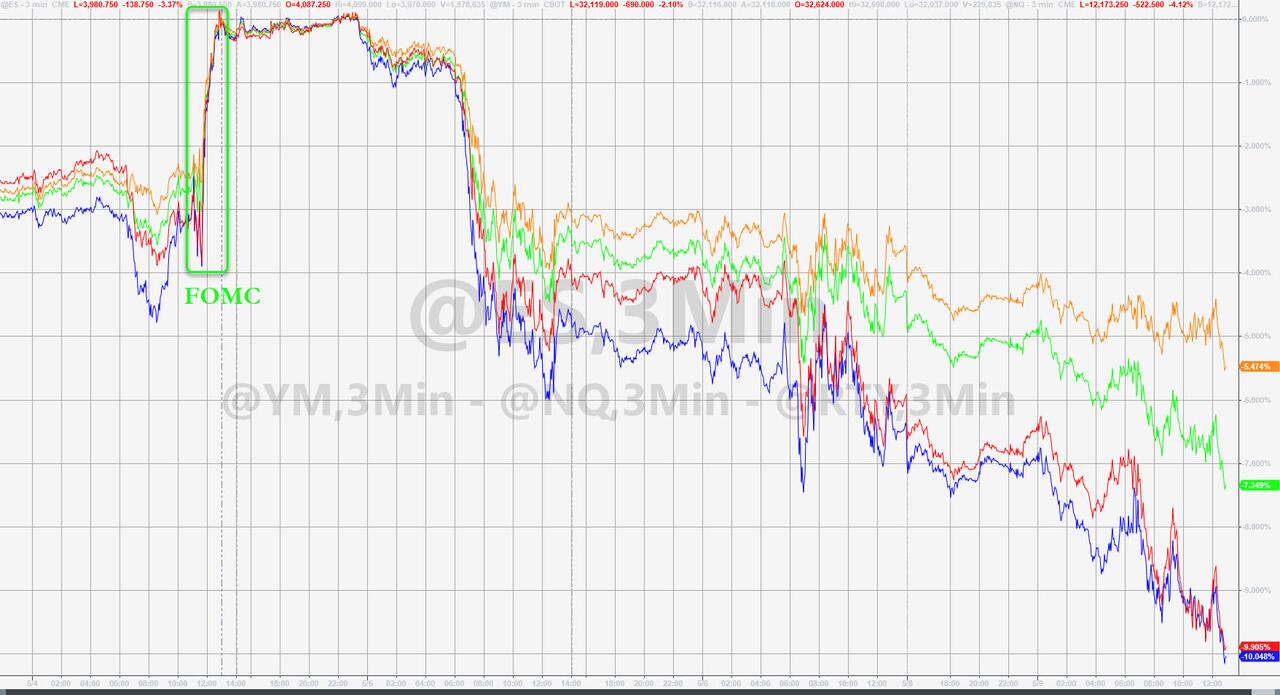
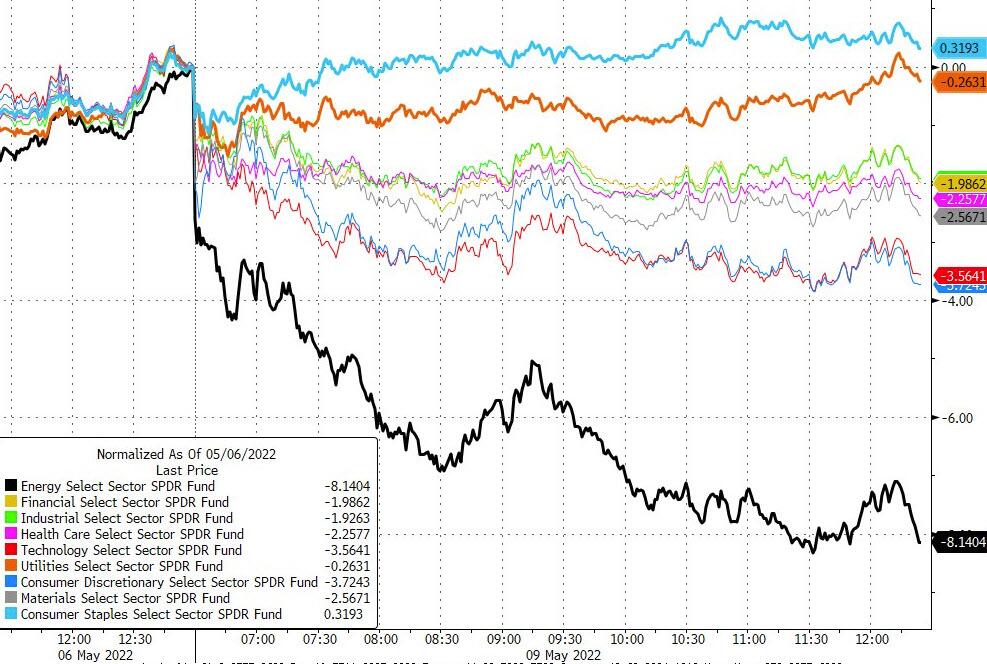
The pattern, that early ramps get wiped out during the session, has been occurring with such regularity, that we could conclude that they are merely dead-cat-bounces, i.e., hopeful leaps with no connection to reality.

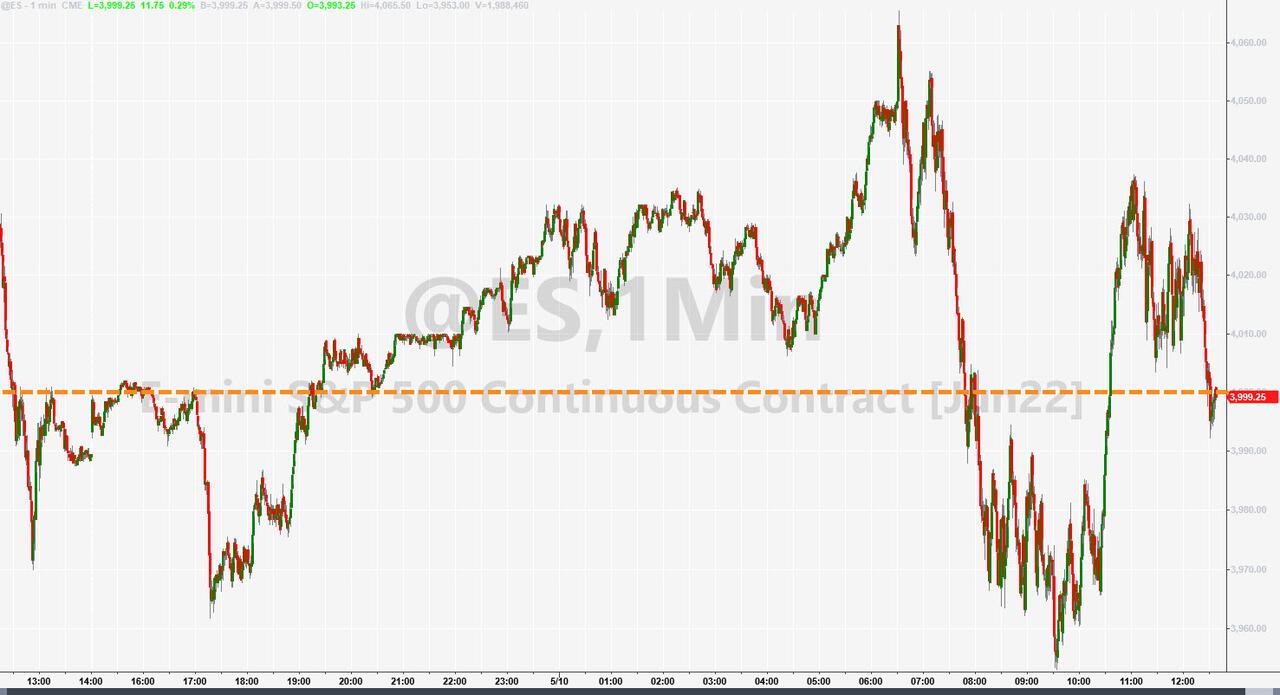
Today was no exception. The chart above clearly demonstrates that occurrence and here again, the major indexes got spanked, despite a late day rebound above the unchanged line.

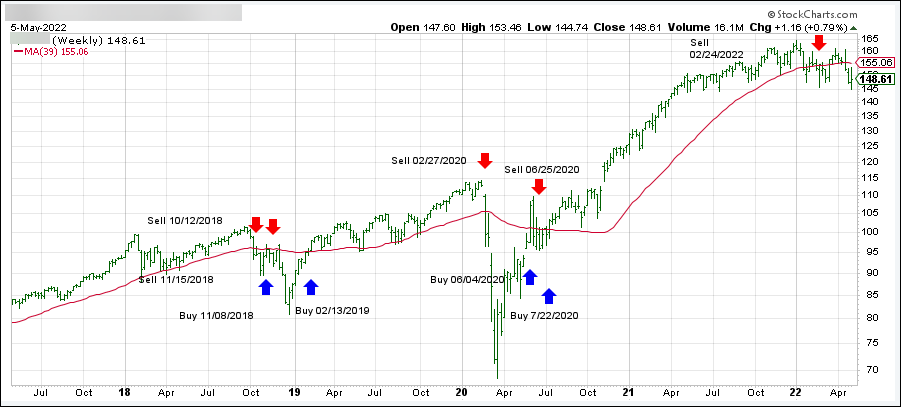
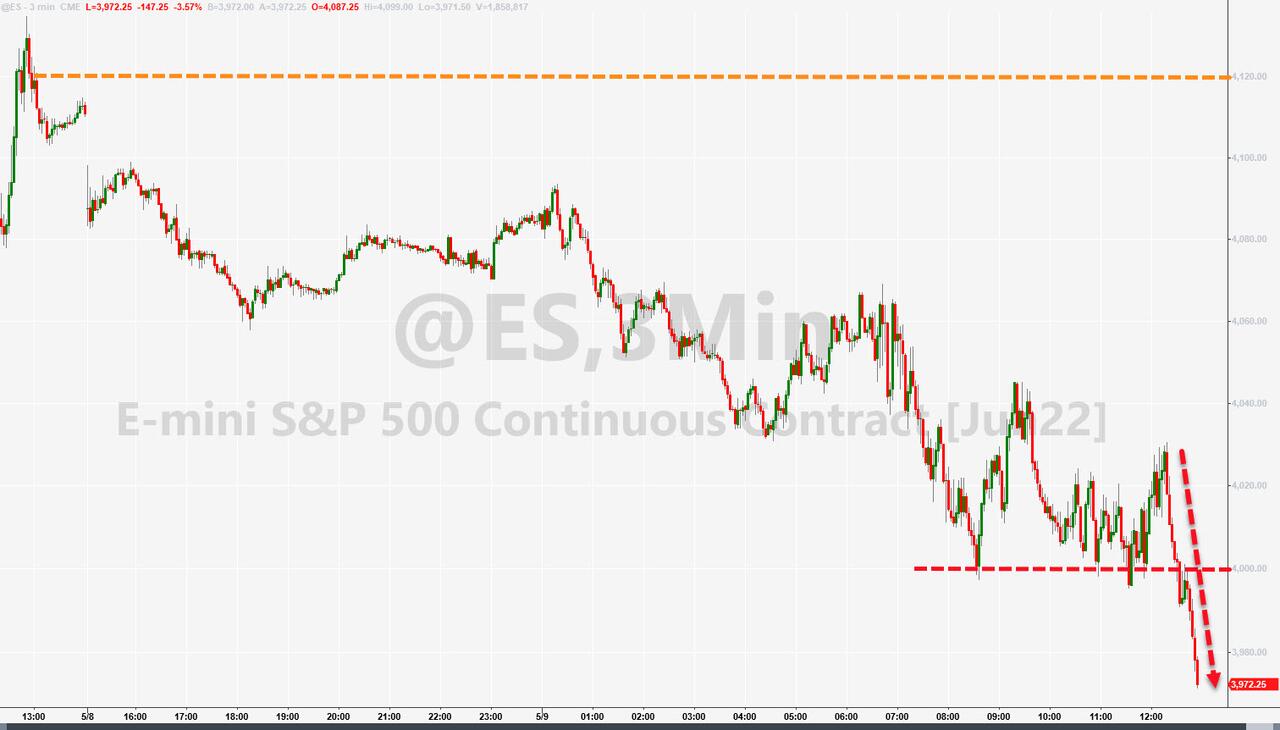
As ZeroHedge pointed out, today is the biggest 5-day drop for stocks since 3/20/20, with the S&P 500 now clearly having lost its 4k level:

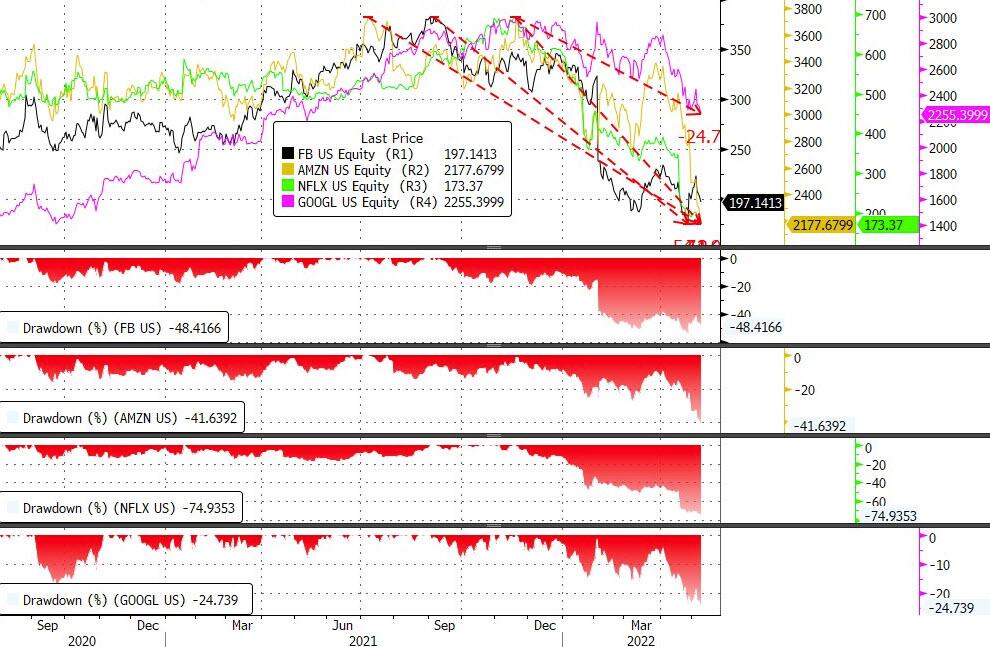
  • Nasdaq is now down over 29% from its highs, Dow down over 17%, and the S&P almost 14%.

Today’s April CPI report of 8.3% YoY, while an improvement from March’s 8.5%, was higher than the expected 8.1%. Hope that inflation may have peaked, was nothing but wishful thinking, and that reality set in later and pulled the major indexes into the red.

As I have repeatedly said, the Fed is way behind in its attempts to curb inflation, and a far more aggressive approach is needed to not only conquer the price increases we are experiencing now—but also to get a handle on potential hyperinflation and a cost-of-living crisis. A puny 0.5% hike in the Federal Funds rate will not do it.

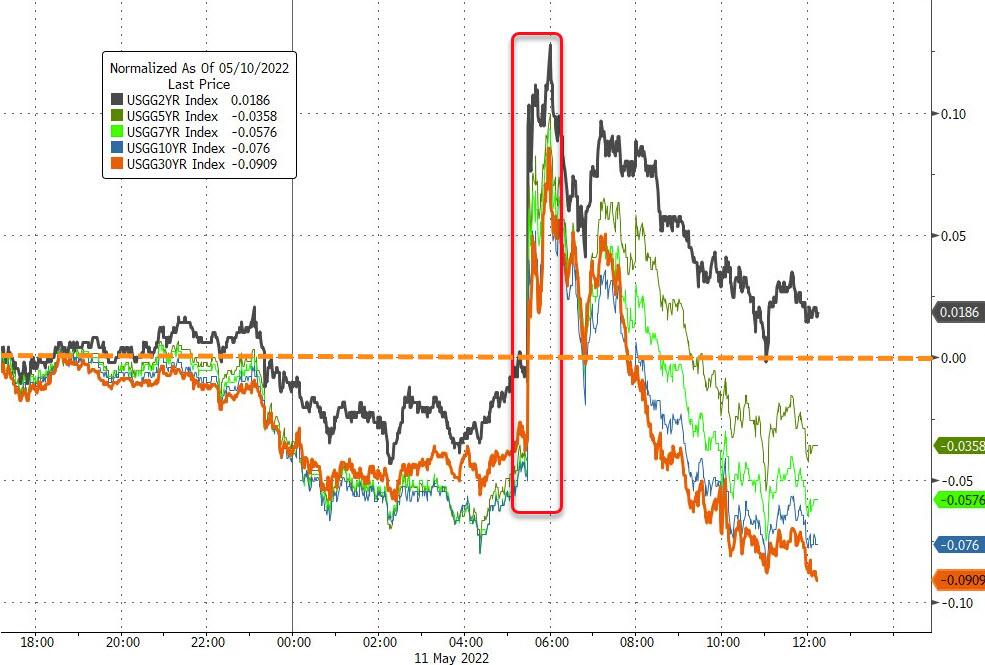
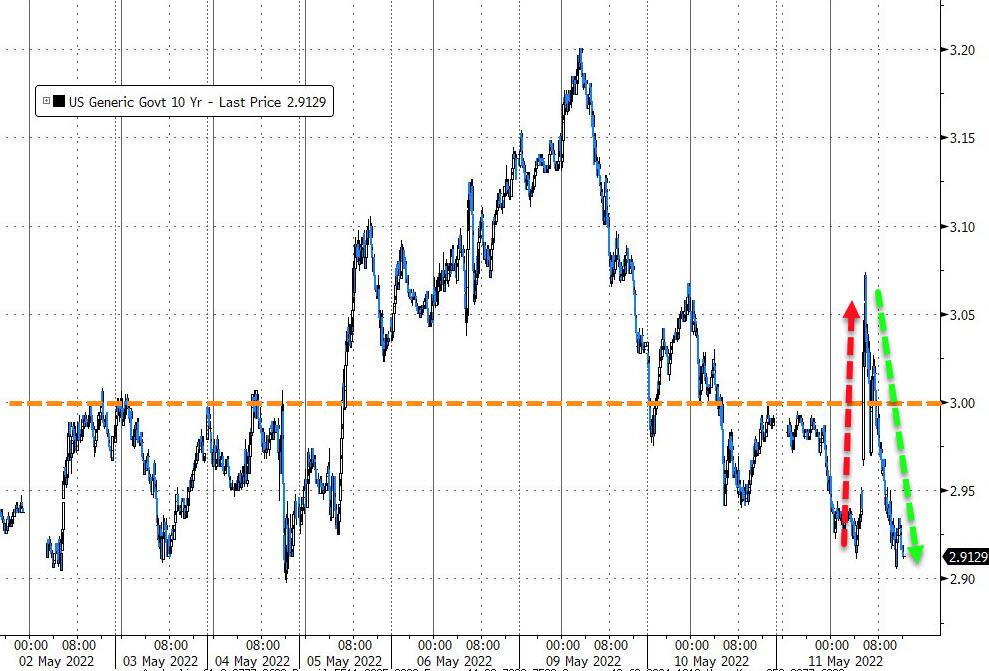
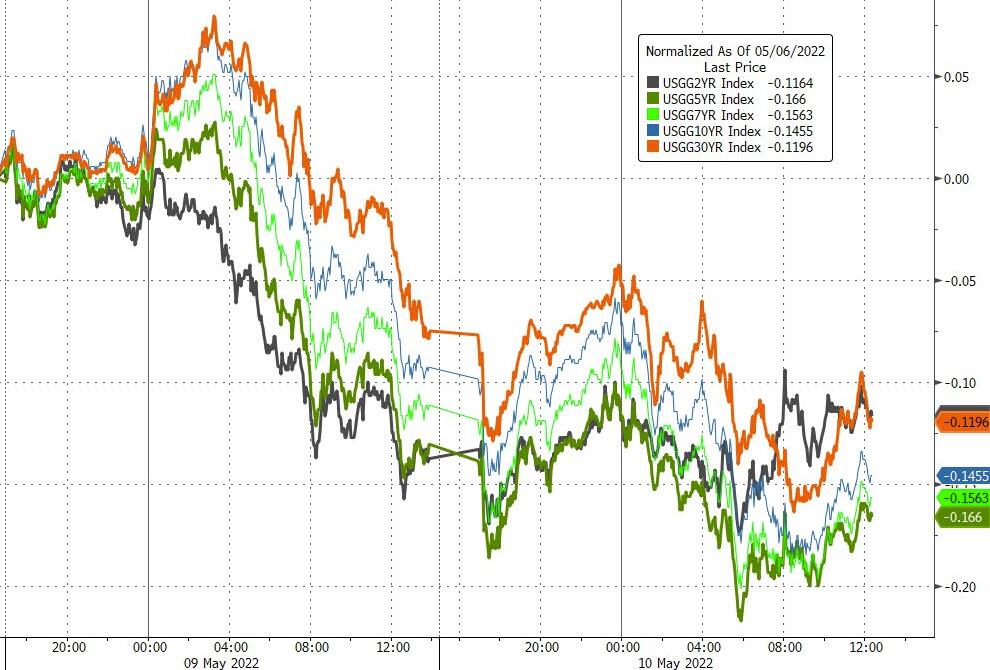
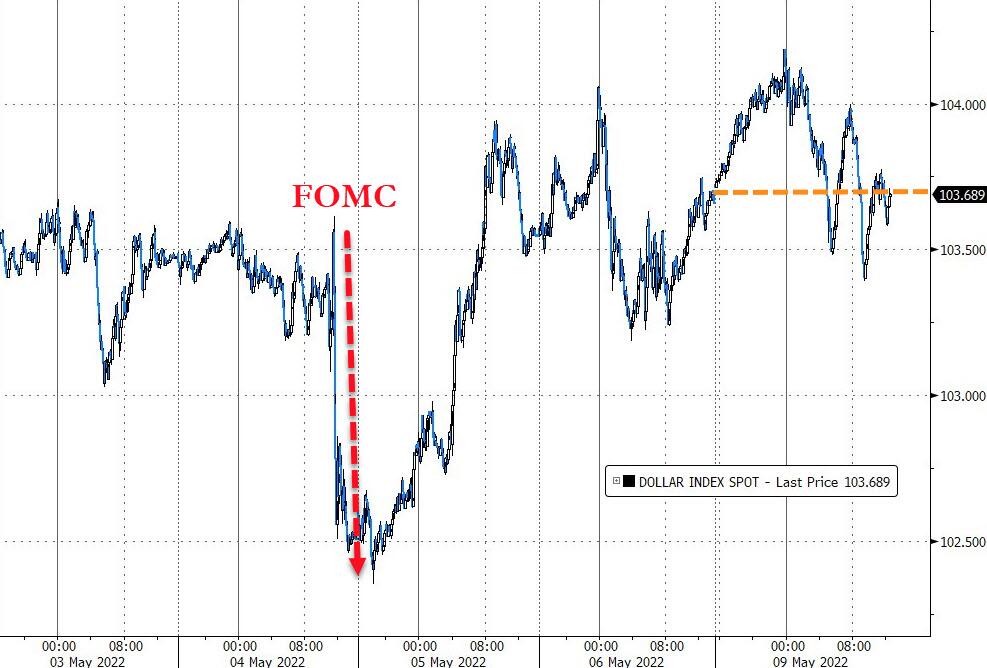
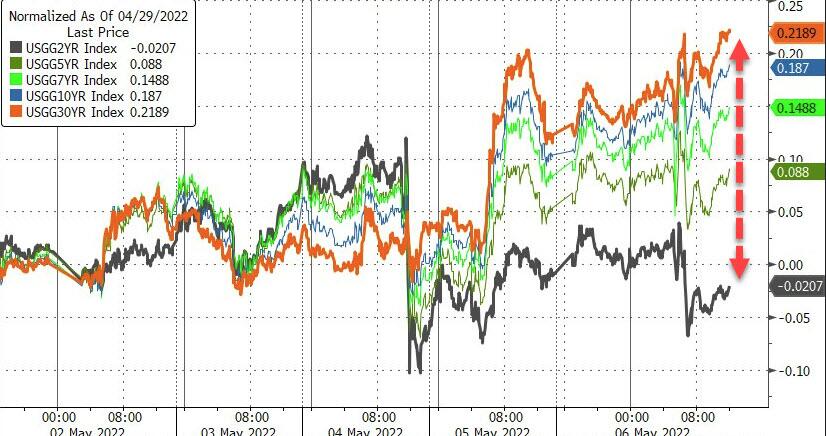
Bond yields spiked but pulled back late in the session, with the 10-year retreating from its 3.06% intra-day high to close down 7 bps at 2.93%.

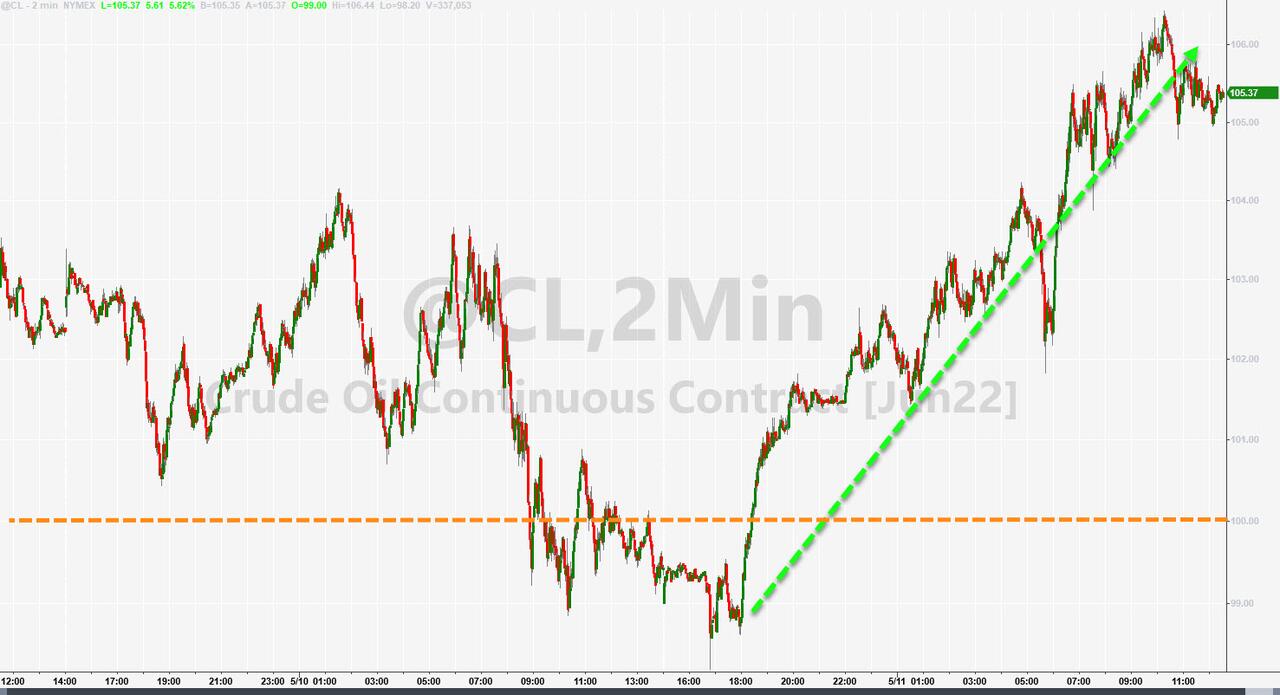
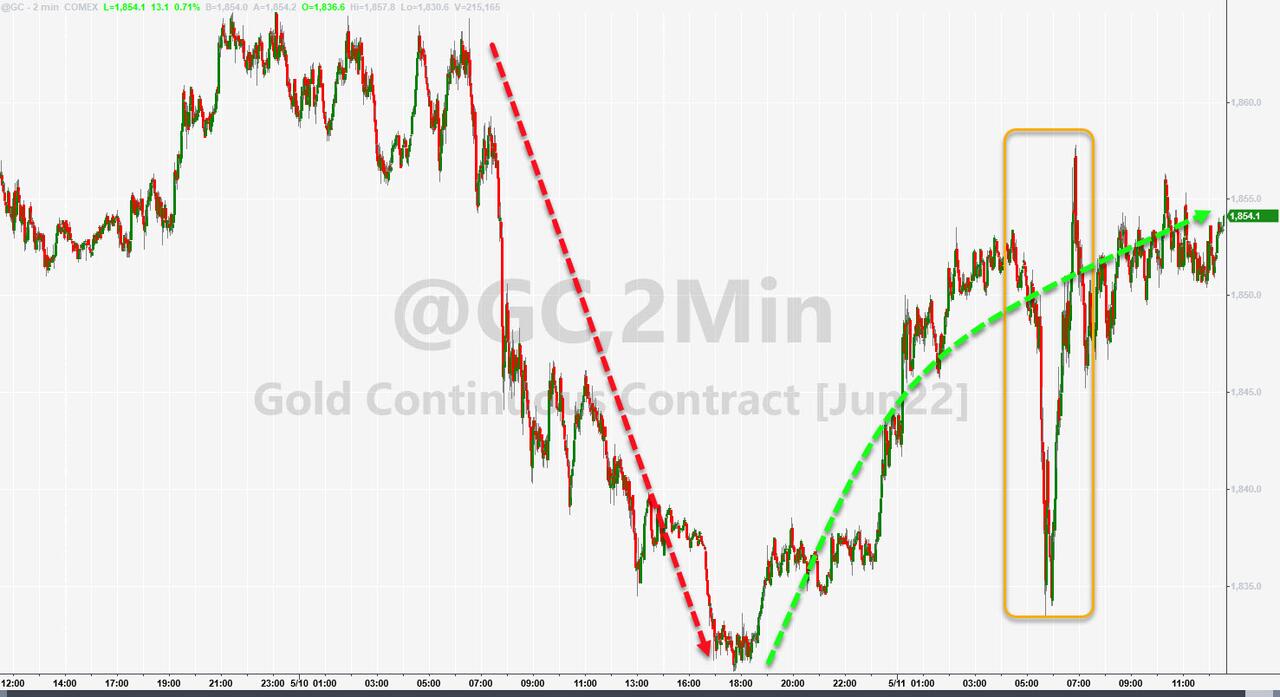
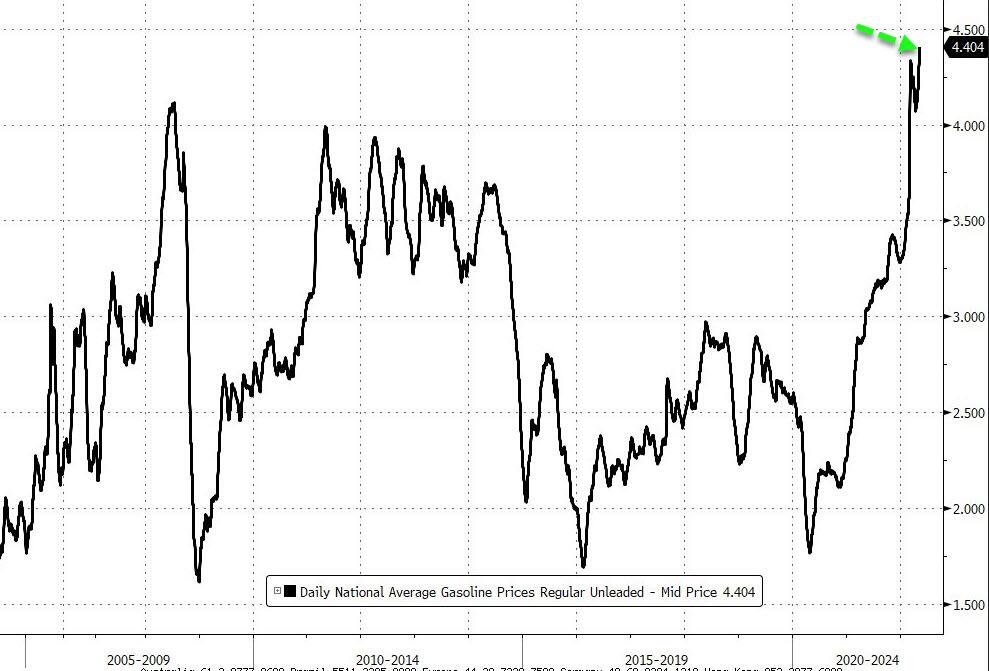
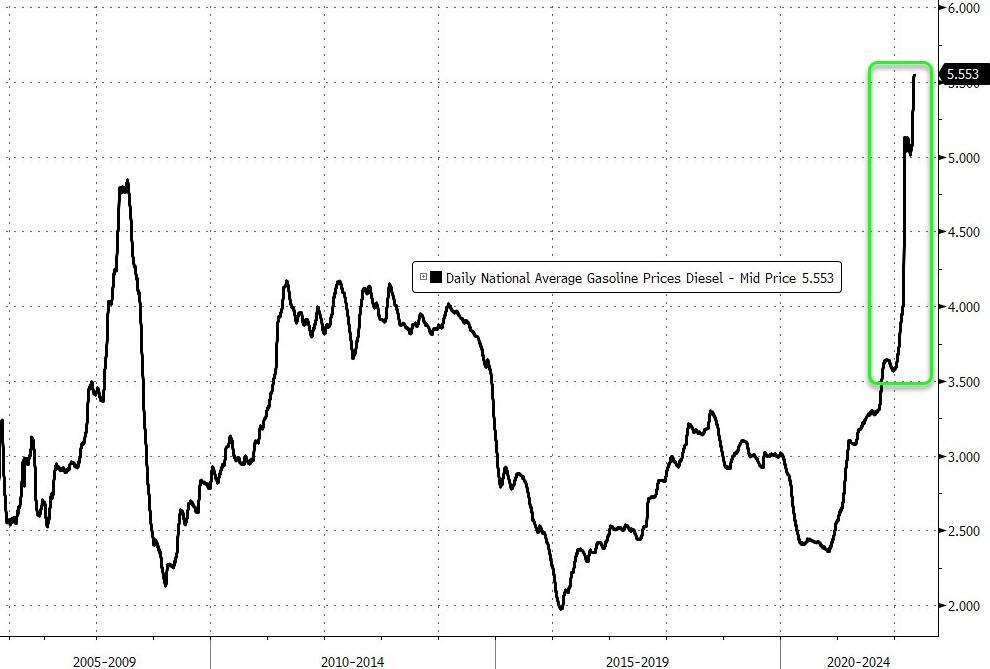
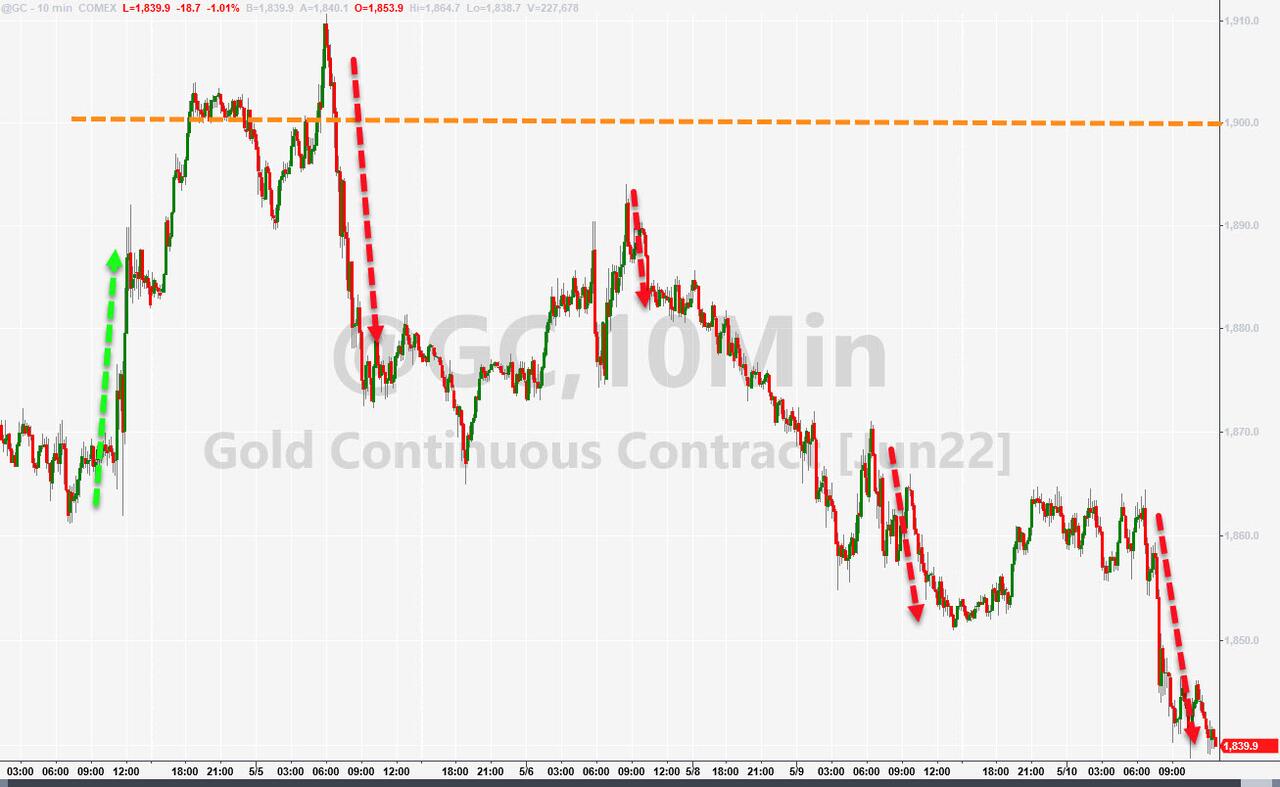
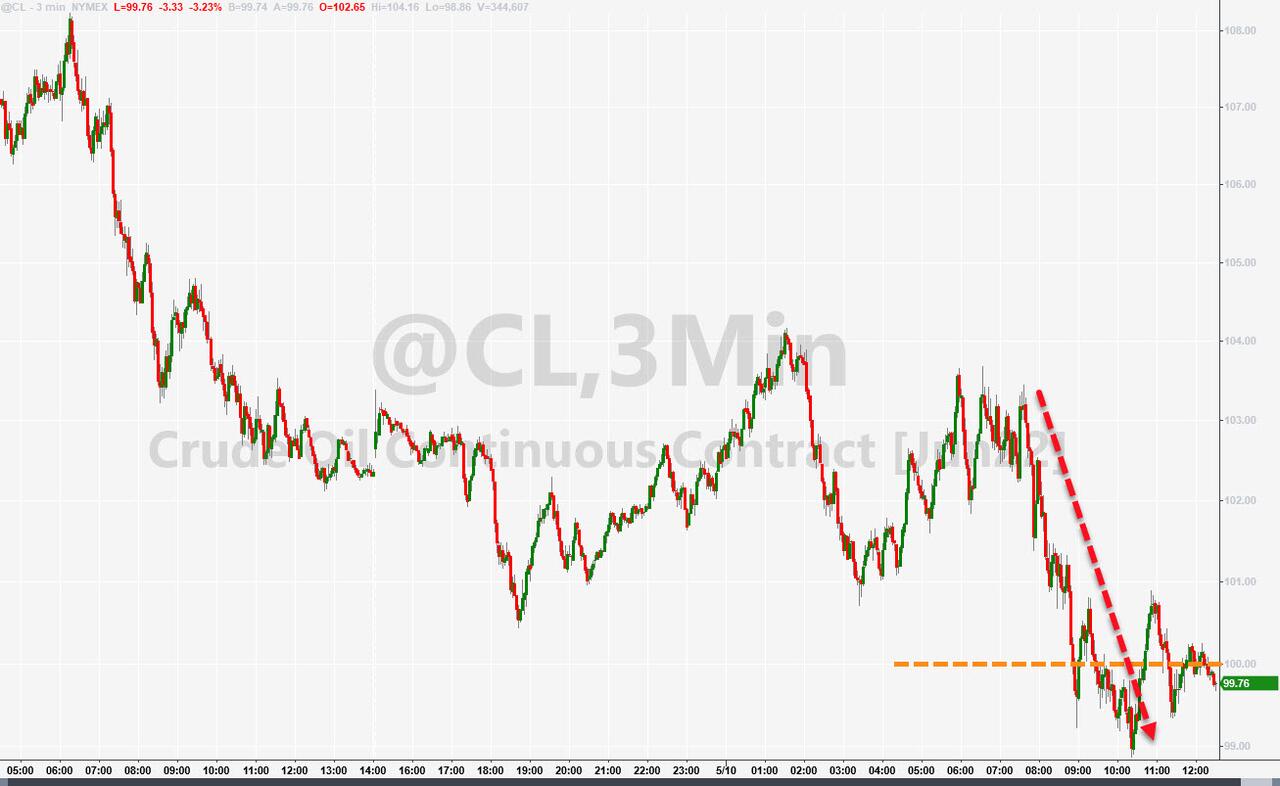
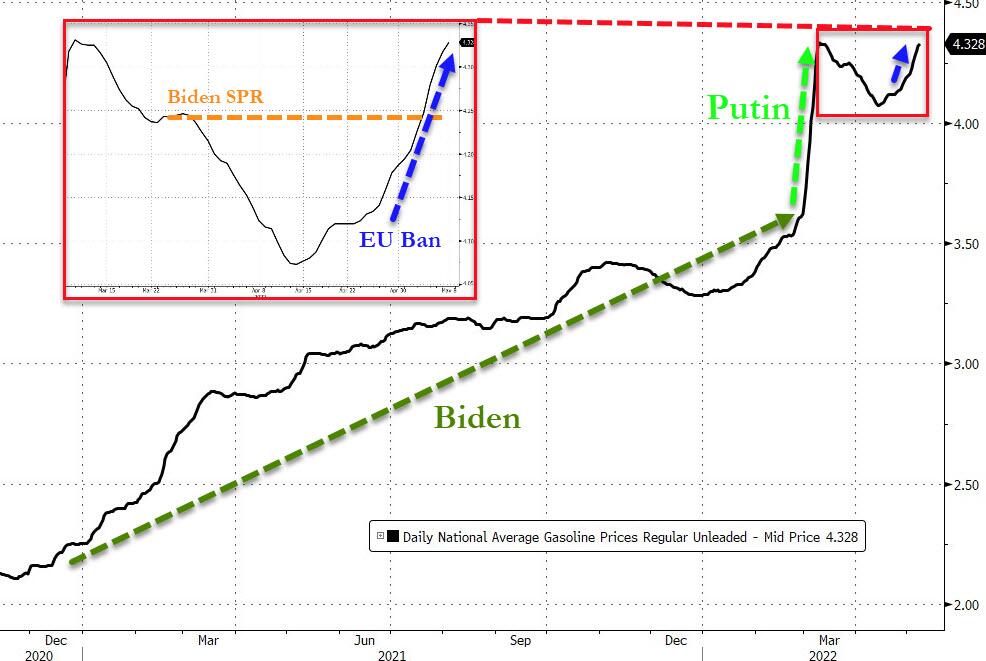
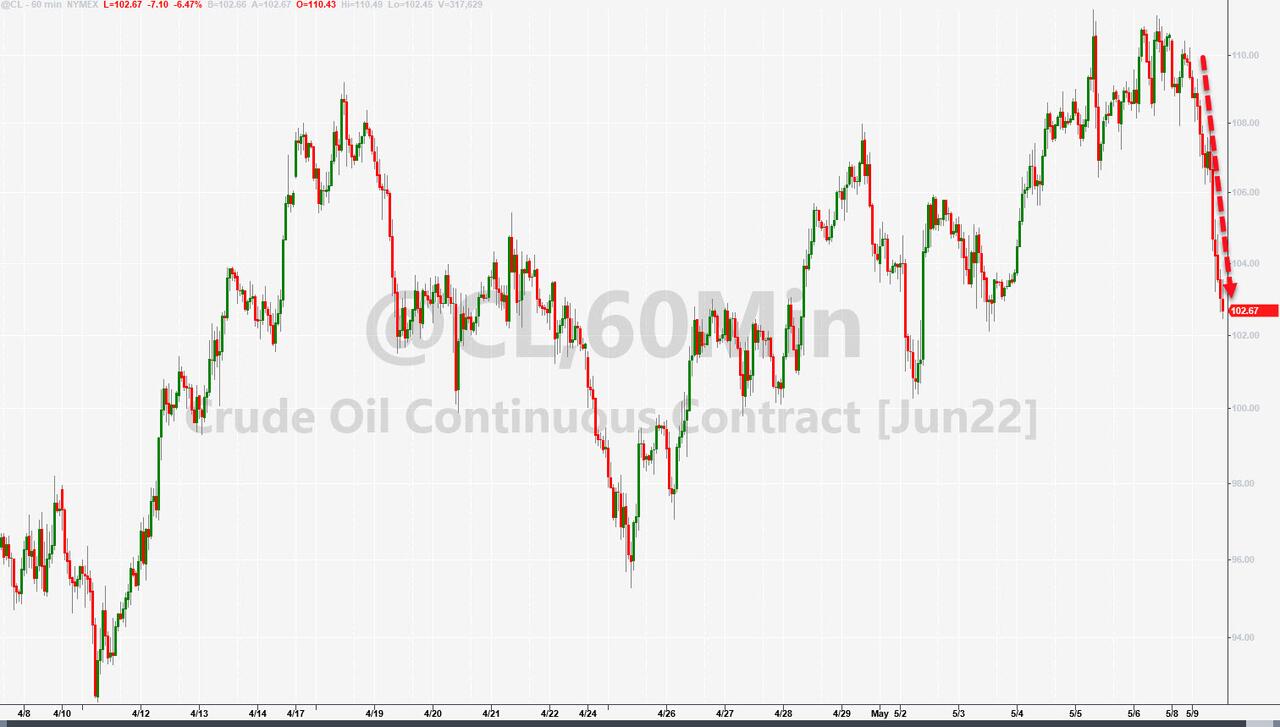
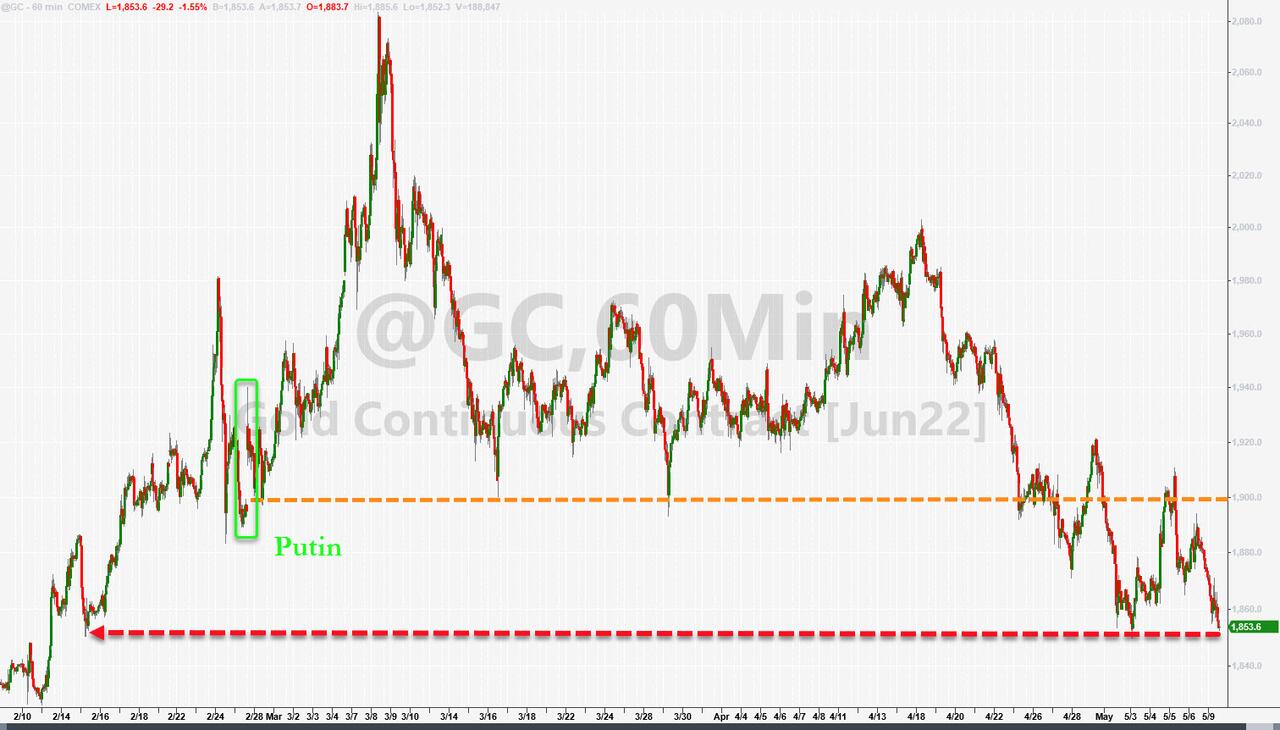
Crude Oil bounced back above $100, gold had a decent showing, but is still trying to climb back above its $1,900 level, and retail gasoline prices set a new record. More astounding was the price of Diesel fuel, which absolutely exploded.  

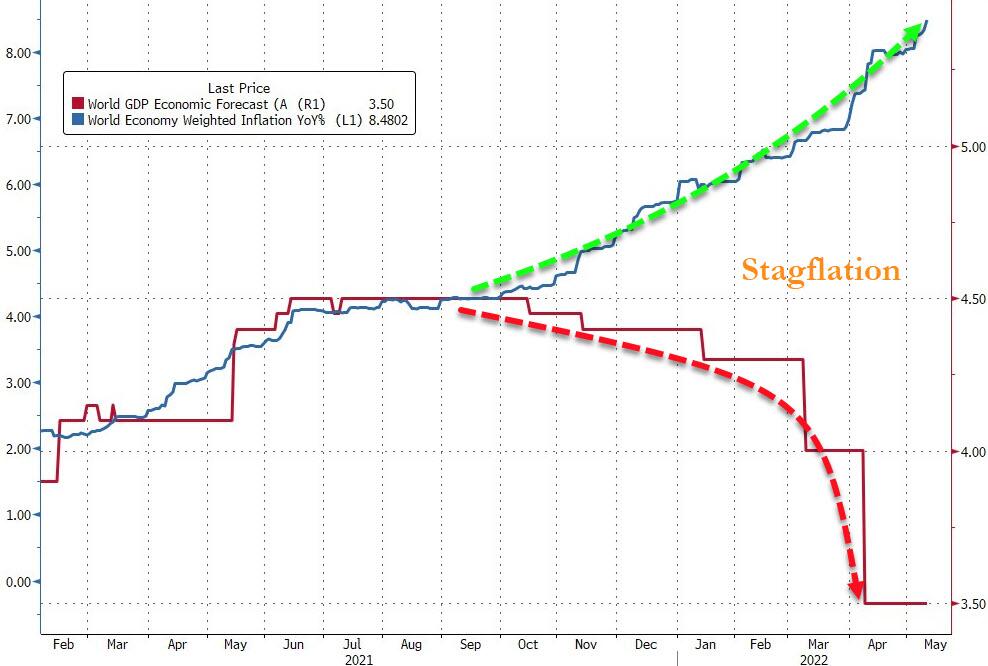
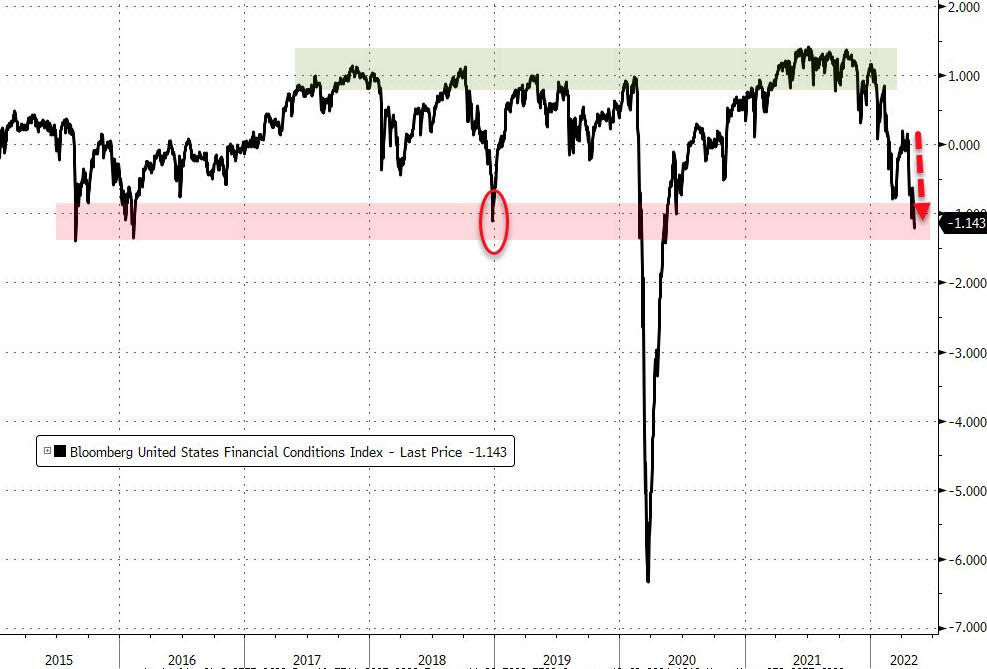
Having said all that, the dreaded “S” word, as in Stagflation (inflation + no growth), is making the rounds again, with Bloomberg producing this chart as evidence.

Read More

Aimless Chopping And Flopping

Ulli Market Commentary Contact

[Chart courtesy of MarketWatch.com]

  1. Moving the markets

An early +500-point Dow relief rally died on the vine, as the index suddenly reversed course and dove into the red by -150 points before chopping and flopping around the unchanged line into the close. This marked the Dow’s 4th consecutive decline.

The S&P 500 and Nasdaq followed a similar pattern but managed to eke out a green close with the former reclaiming its psychologically important 4k level. Overall, it appeared that the bearish mood has not subsided, it has merely taken a pause ahead of tomorrow’s all-important CPI number.

A variety of Fed speakers offered some much-needed hope to the beaten down bond- and stock investors with bon mots like “50bps-hikes are base-case, not sure if need to raise rates above neutral,” and “this was not a shock-and-awe Volcker moment.” This had the desired effect to prop up stocks, if only temporarily, and pulled bond yields off their lofty levels with the 10-year dropping back a tad below its 3% level to close at 2.994%.

ZeroHedge pointed out that financial conditions have tightened significantly and are now at the same level where Powell flip-flopped back to dovish in 2018. Will history repeat itself? Tomorrow’s CPI may give us a hint.

The US Dollar went sideways, Gold was held below its $1,900 level, while Crude Oil slipped below the $100 marker. US Retail Gasoline prices surged to a record new high but, as ZeroHedge explained with this chartit’s still Putin’s fault, right?

Read More

Barfing Into The Close

Ulli Market Commentary Contact

[Chart courtesy of MarketWatch.com]

  1. Moving the markets

Not only did last week’s debacle continue this morning, but markets also took a sudden dive during the last hour of trading, with the S&P 500 breaching its psychologically important 4k marker to the downside to close slightly below it and at its lowest in 13 months.

Again, this was a day with no place to hide, as even well-performing sector funds, like energy and commodities, were not immune from the onslaught of selling. Our energy sector position touched its trailing sell stop, which I took as an opportunity to get out of it and lock in some unrealized gains.

Interest rate fears had bonds swinging wildly with the 10-year slipping 9 basis points but maintaining its position above the 3% level. Rising interest rates have crushed the Nasdaq with the index caving another 4.3% today, and now down 27% from its record highs.

While bear market rallies can always develop suddenly, the major trend is to the downside, which had been confirmed by our Domestic TTI on 2/24/22.

As I pointed out, this is not the time to be in equities but to be in cash on the sidelines or in selected sector funds that are undergoing their own bullish trends. The Stagflation risk will be with us, which means that weakness in equities is bound to continue.

If this is not clear, ZH pointed to what happened to the Fang stocks so far:

FB -48%, AMZN -42%, NFLX -75%, GOOGL -25%

Crude oil plunged and gold tumbled, while the US Dollar went sideways and still hovers near its 20-year highs.

All this begs the question as to whether the Fed will fold to save the markets or be serious in its intentions to battle inflation.

Read More

ETFs On The Cutline – Updated Through 05/06/2022

Ulli ETFs on the Cutline Contact

Below, please find the latest High-Volume ETF Cutline report, which shows how far above or below their respective long-term trend lines (39-week SMA) my currently tracked ETFs are positioned.

This report covers the HV ETF Master List from Thursday’s StatSheet and includes 312 High Volume ETFs, defined as those with an average daily volume of more than $5 million, of which currently 54 (last week 54) are hovering in bullish territory. The yellow line separates those ETFs that are positioned above their trend line (%M/A) from those that have dropped below it.

Take a look:                                                                   

The HV ETF Master Cutline Report

In case you are not familiar with some of the terminology used in the reports, please read the Glossary of Terms. If you missed the original post about the Cutline approach, you can read it here.      

ETF Tracker Newsletter For May 6, 2022

Ulli ETF Tracker Contact

ETF Tracker StatSheet          

You can view the latest version here.

TROUNCING AND BOUNCING

[Chart courtesy of MarketWatch.com]

  1. Moving the markets

After the Dow dropped another 400 points to start the session, dip buyers stepped in and pushed the major indexes just above their unchanged lines. Giving an assist in this sudden turnaround, was Fed mouthpiece Kashkari by hinting that the Neutral rate is 2%, which means the Fed has at most a little over 1% in hikes left, before it may have to shift in reverse.

While that was just his opinion, it had the desired dovish effect in that it instantly reversed the bearish course of the day. That statement differed substantially from traders’ expectations of another 12 rate hikes or so and caused the bulls to come out of hiding.

However, it was not enough for a complete turnaround, but it continued the market’s bobbing and weaving thereby avoiding another carnage. In the end, the major indexes scored another loss, with the Dow now having dropped for six straight weeks.

Thanks to Wednesday’s powerful dead-cat bounce, AKA Fed relief rally, the S&P 500 closed the week just about unchanged but registered its longest weekly losing streak since June 2011, according to ZeroHedge.

Bond yields claimed most of the attention, as the 10-year touched 3.13% for the first time since 2018, after which the Fed folded and reversed its policies thereby reviving the dying bull market. With inflation continuing to be on the rise, it’s unknown whether the Fed will stick to its plan or will favor bailing out the stock and bond markets again.

The winners of the day were energy, commodities, gold and the short 20-year Treasury ETFs, the exposure to which has, despite their volatility, created a bullish oasis, as most other sectors were mired in red numbers.

Read More

Weekly StatSheet For The ETF Tracker Newsletter – Updated Through 05/05/2022

Ulli ETF StatSheet Contact

ETF Data updated through Thursday, May 5, 2022

Methodology/Use of this StatSheet:

1. From the universe of over 1,800 ETFs, I have selected only those with a trading volume of over $5 million per day (HV ETFs), so that liquidity and a small bid/ask spread are assured.

2. Trend Tracking Indexes (TTIs)

Buy or Sell decisions for Domestic and International ETFs (section 1 and 2), are made based on the respective TTI and its position either above or below its long-term M/A (Moving Average). A crossing of the trend line from below accompanied by some staying power above constitutes a “Buy” signal. Conversely, a clear break below the line constitutes a “Sell” signal. Additionally, I use an 12% trailing stop loss on all positions in these categories to control downside risk.

3. All other investment arenas do not have a TTI and should be traded based on the position of the individual ETF relative to its own respective trend line (%M/A). That’s why those signals are referred to as a “Selective Buy.” In other words, if an ETF crosses its own trendline to the upside, a “Buy” signal is generated. Here too, I recommend trailing sell stop of 12%, or less, depending on your risk tolerance.

If you are unfamiliar with some of the terminology, please see Glossary of Terms and new subscriber information in section 9.     

1. DOMESTIC EQUITY ETFs: SELL — since 02/24/2022

Click on chart to enlarge

Our main directional indicator, the Domestic Trend Tracking Index (TTI-green line in the above chart) has broken below its long-term trend line (red) by -4.22% and remains in “SELL” mode.

Read More