A Dead-Cat Bounce Dies With A Vengeance

Ulli Market Commentary Contact

[Chart courtesy of MarketWatch.com]

  1. Moving the markets

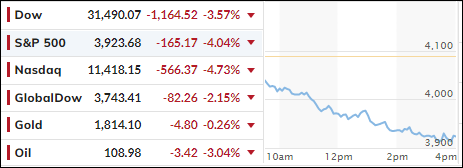
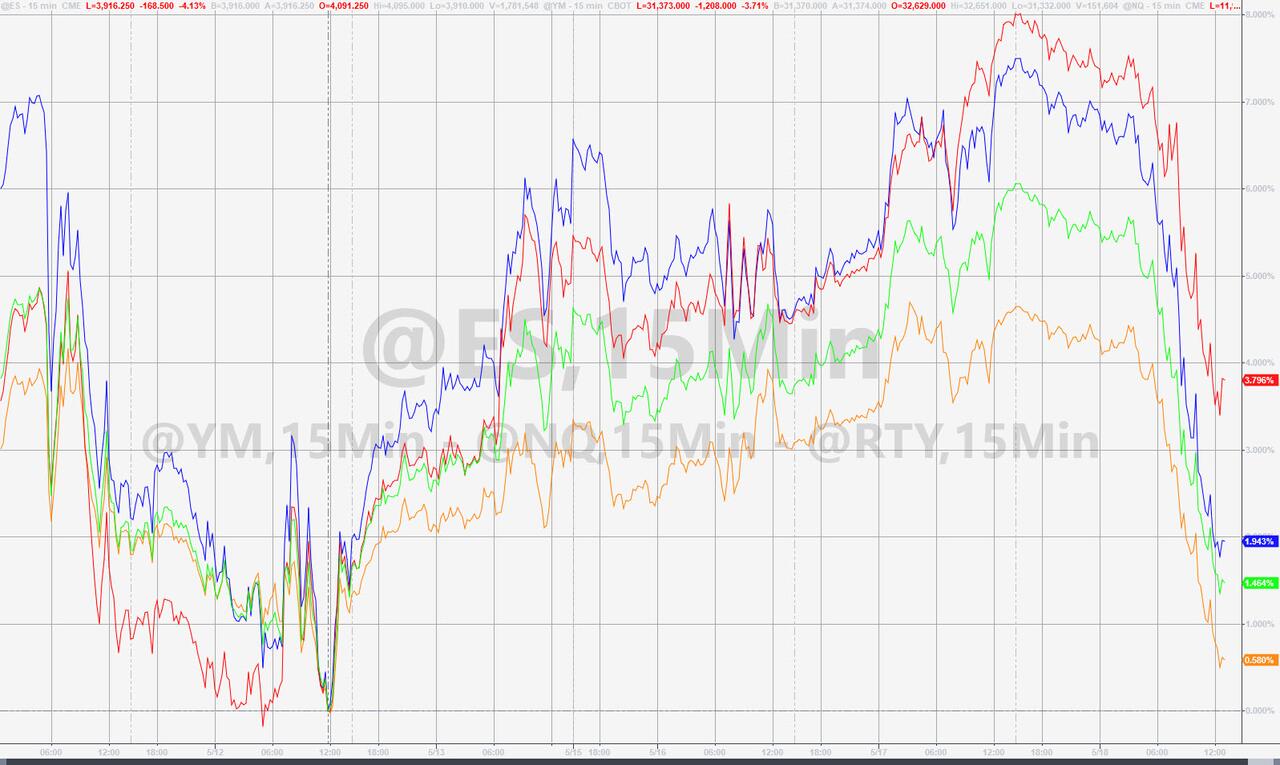
Despite yesterday’s bullish euphoria, reality set in today and informed those, who had not gotten the message yet, that we are indeed in bear market territory, in which hopeful bounces tend to die quickly.

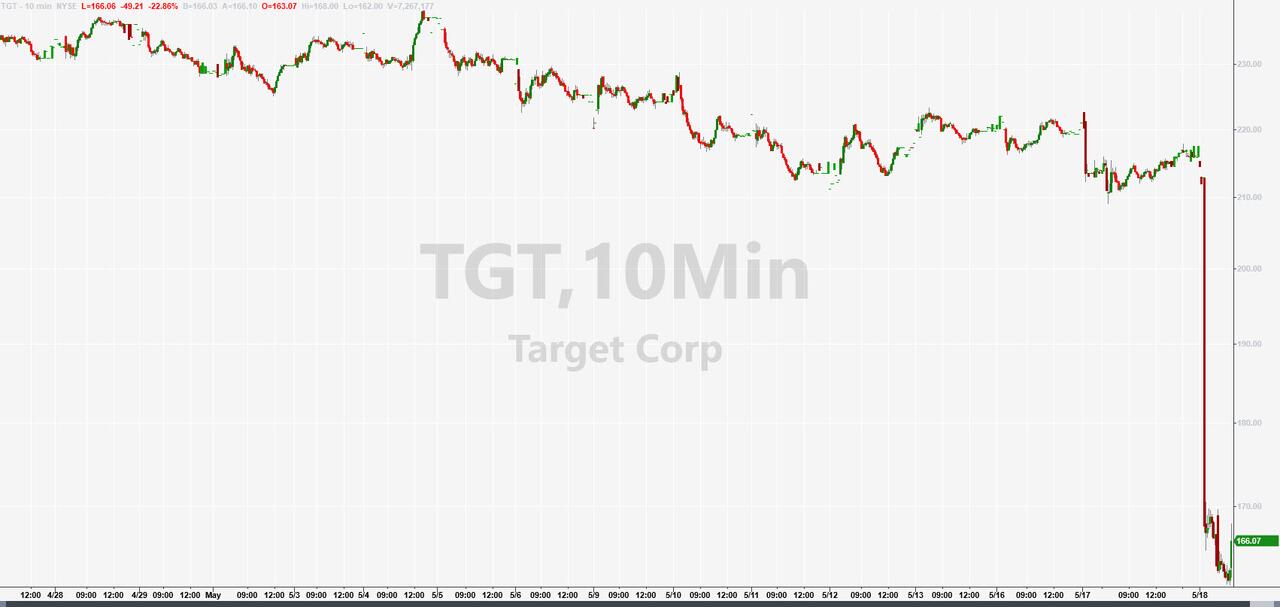
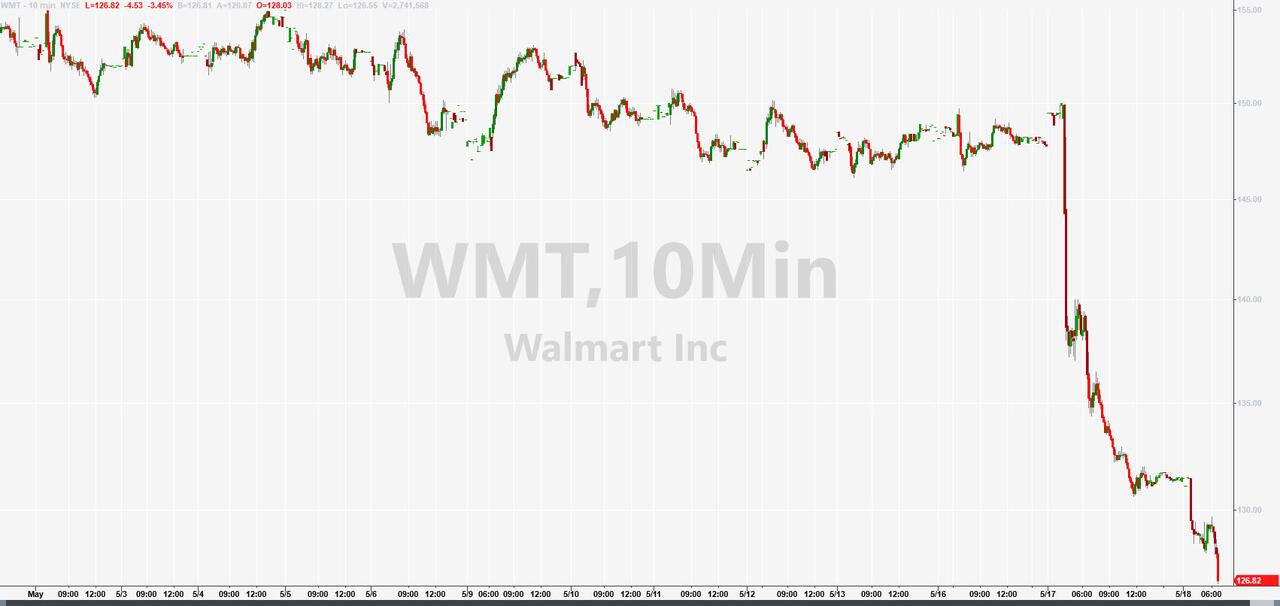
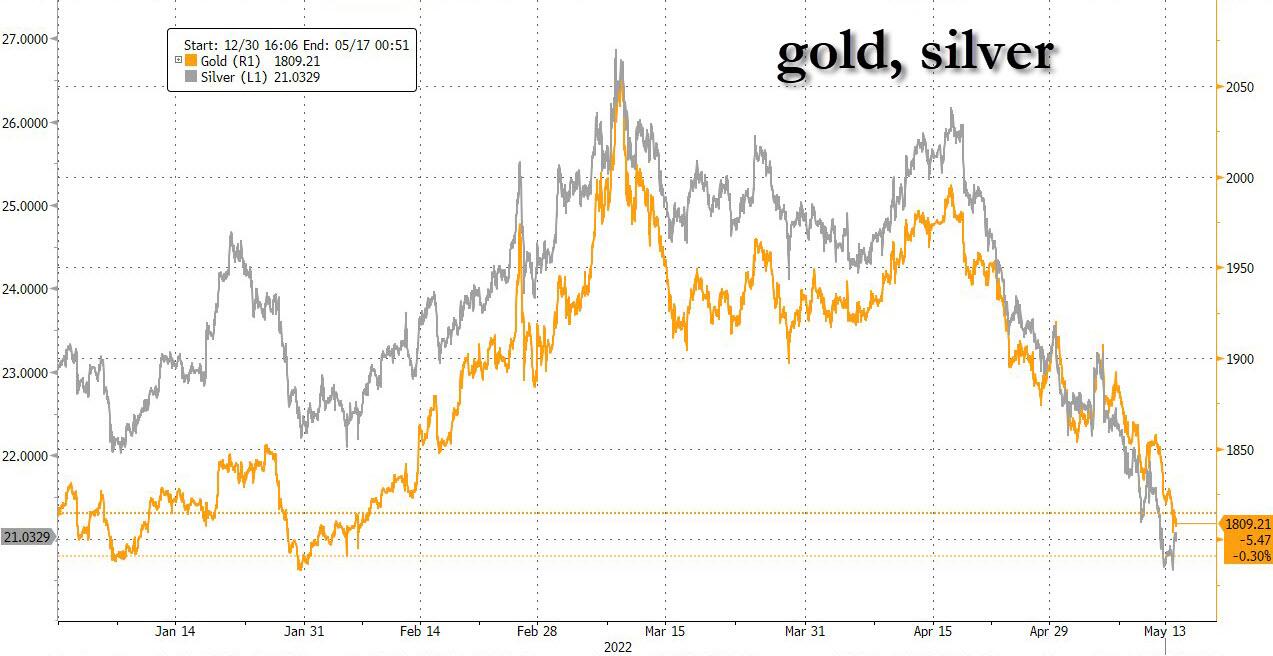
Today’s action would be better described as a “puke fest,” with every asset class, except gold, being spanked with utter abandon. Pushing things in the wrong direction at the opening was retailer Target’s earnings and announcement about the damage inflation can do to profit margins due to higher fuel and compensation costs. The stock plunged some 25% with the fallout effect spreading to Walmart as well, which dropped 7%.

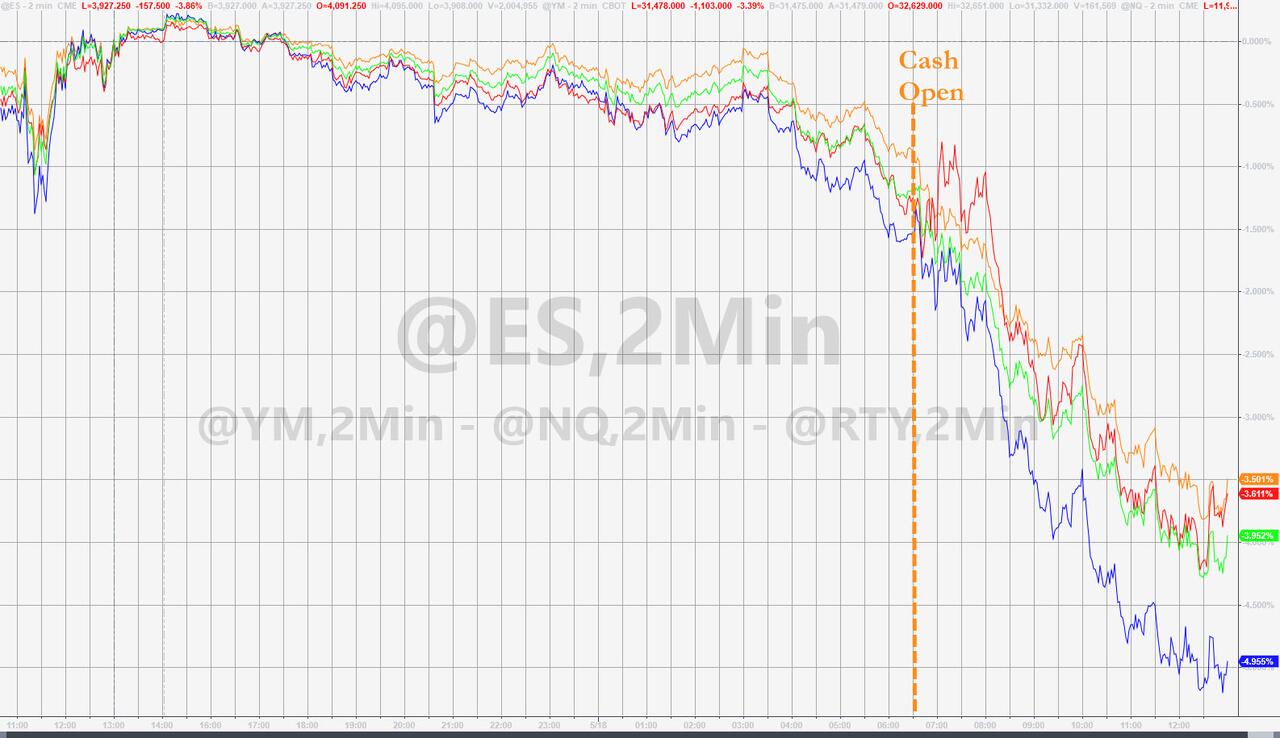
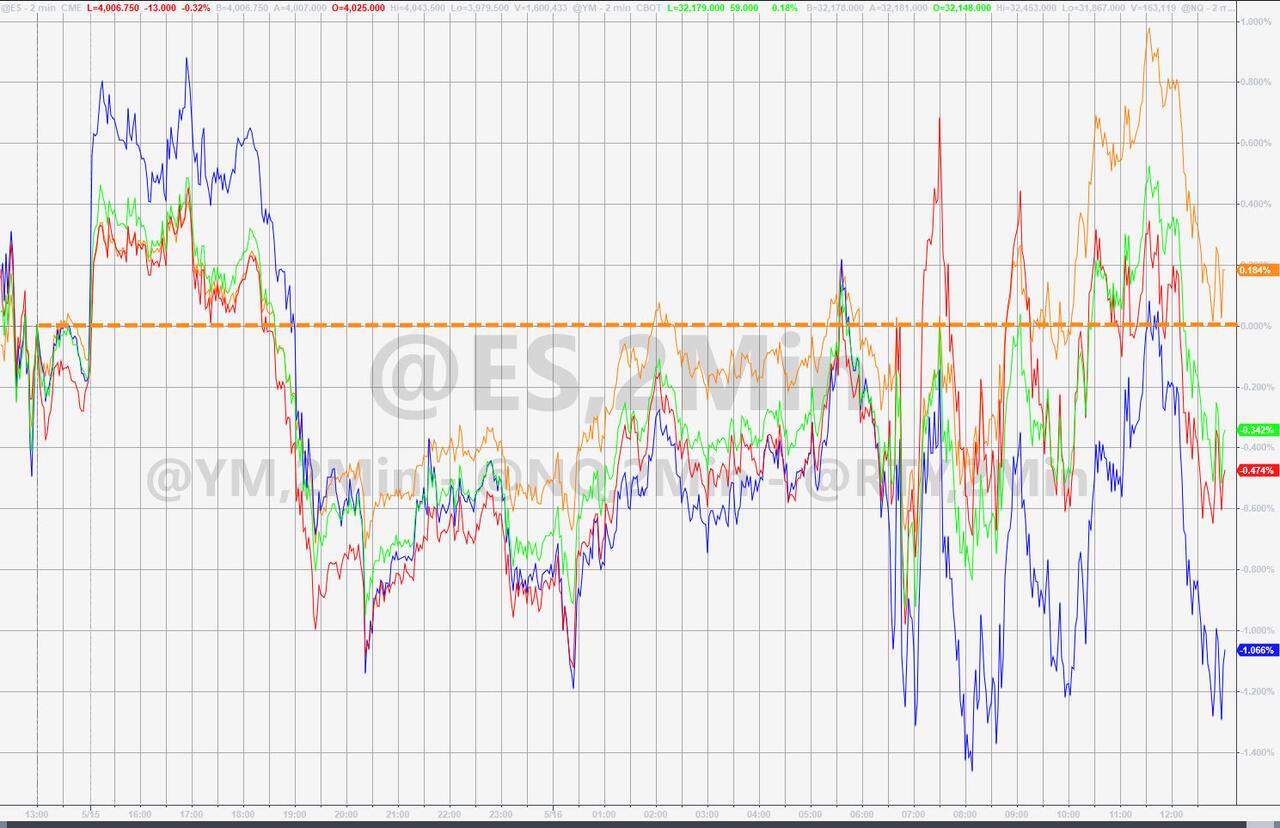
Trader’s pondering the theme “who’s next?” decided that dumping everything in sight was the best cause of action, as relentless selling picked up speed handing equities their worst day of the year.   

Not helping markets at all was big-time investor and bubble market identifier extraordinaire, Jeremey Grantham, with this comment:

“The other day, we were down about 19.9% on the S&P 500 and about 27% on the Nasdaq. I would say at a minimum, we are likely to do twice that, if we are unlucky, which is quite possible, we would do three legs like that, and it might take a couple of years as it did in the 2000s.”

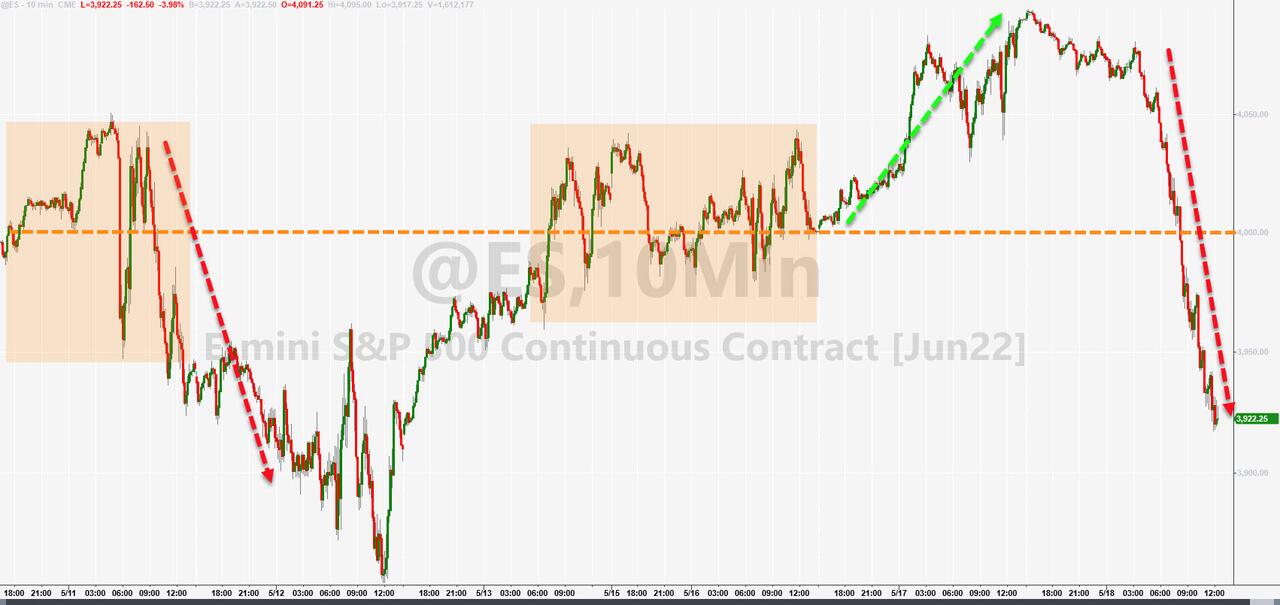
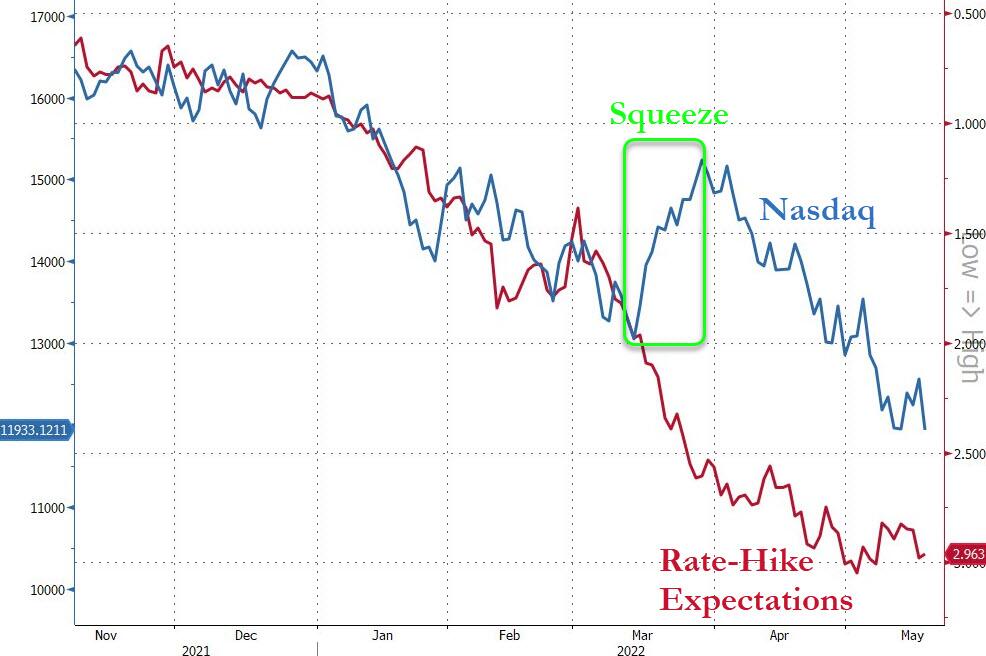
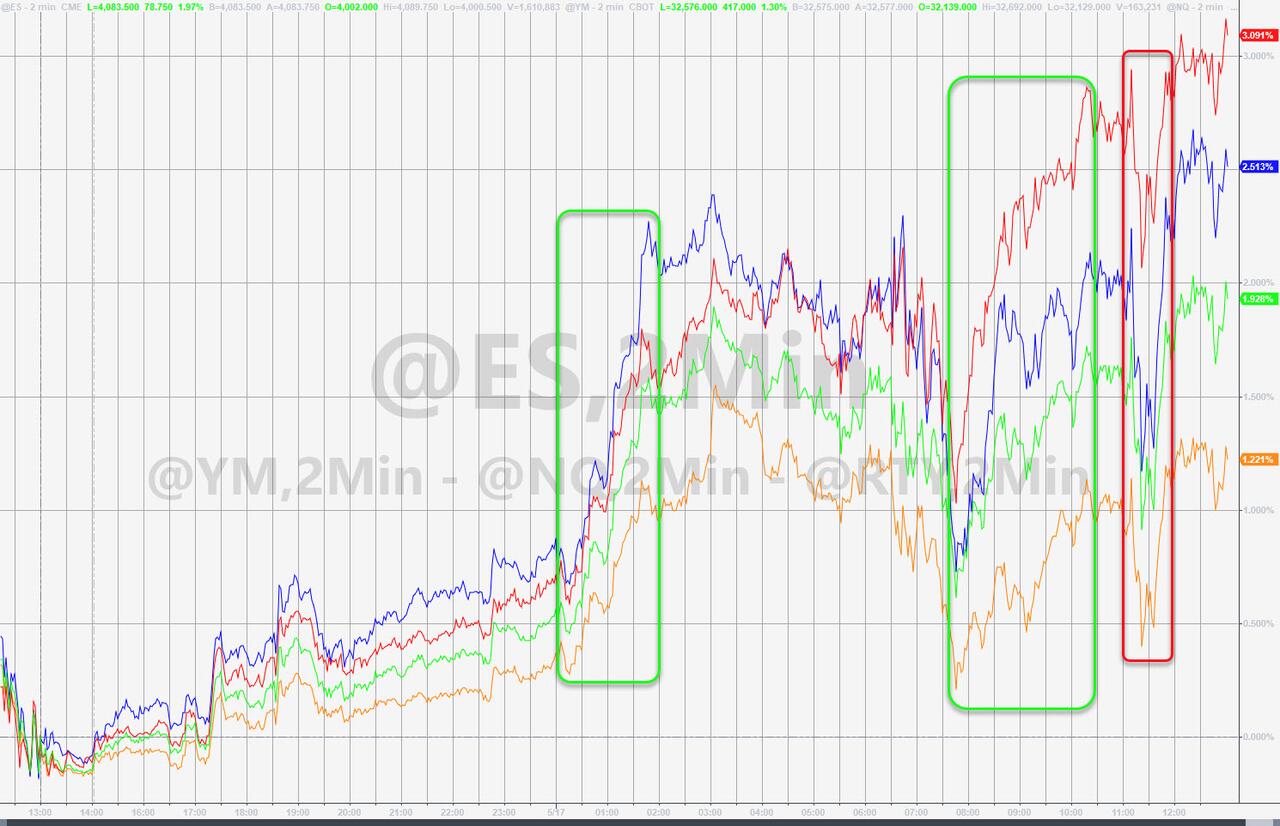
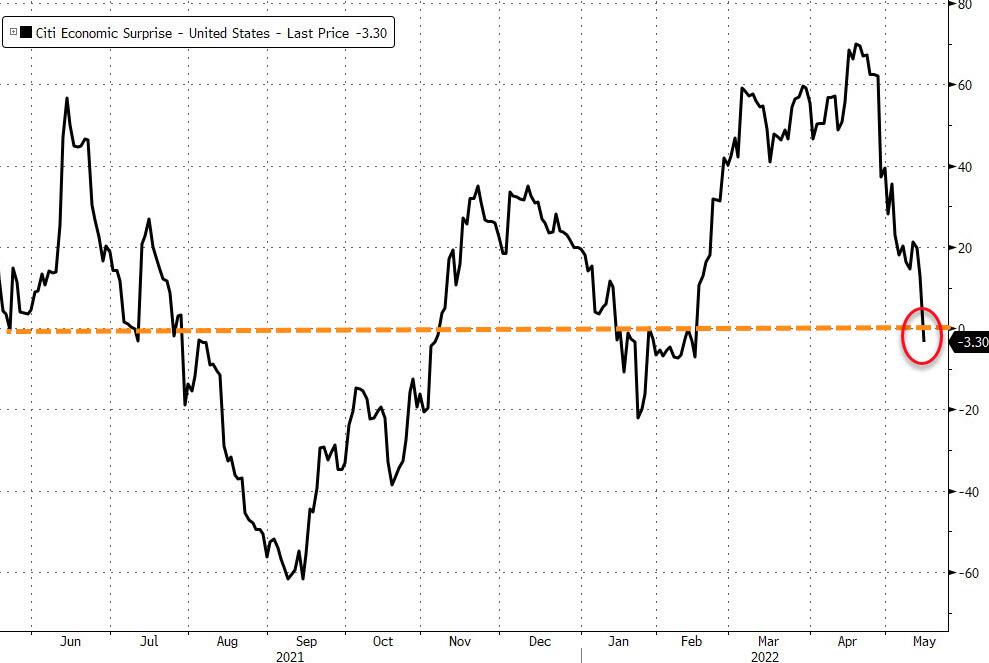
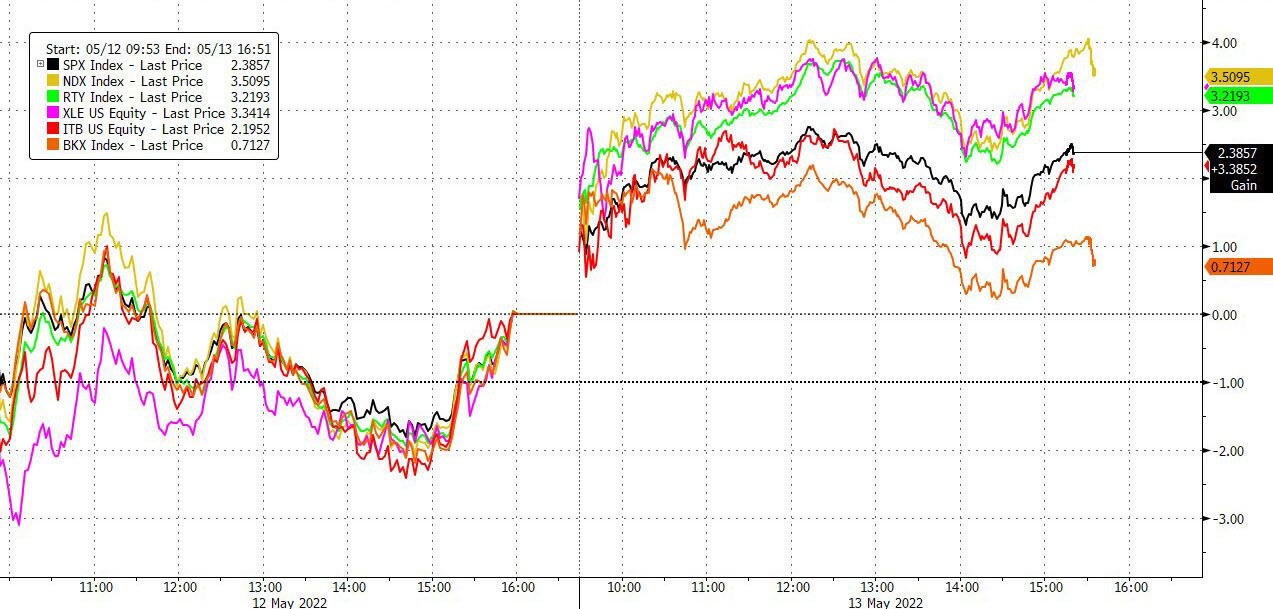
As Zero Hedge pointed out, stocks have now almost unwound all of the dead-cat bounce from last week, while the S&P 500 lost its 4k level once again. It’s also questionable whether the remaining rate hikes have been priced in, with Bloomberg referencing them in this chart. In other words, there may be more downside to come.

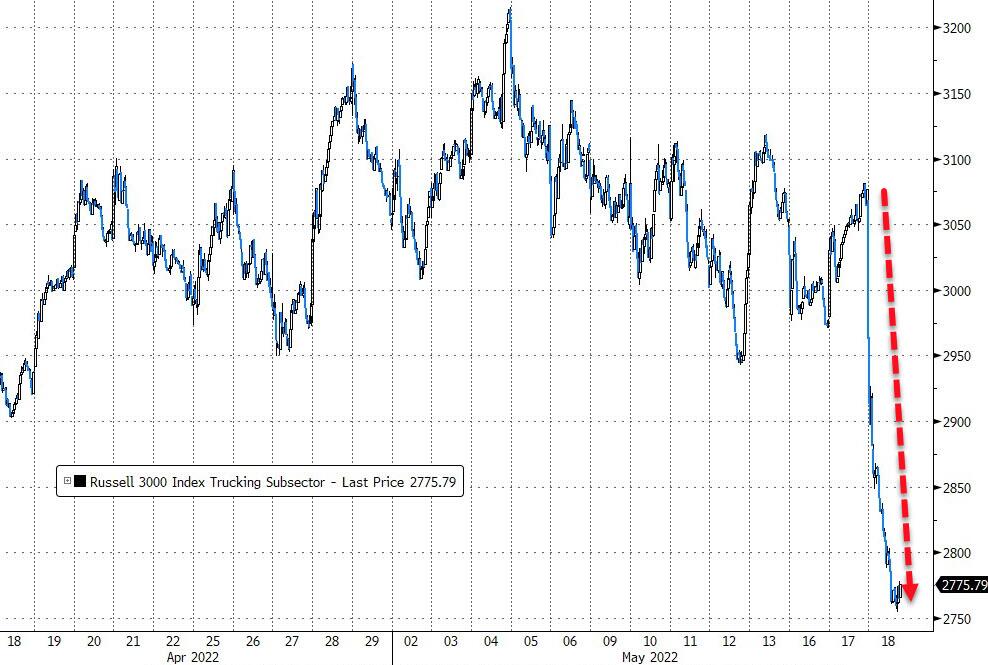
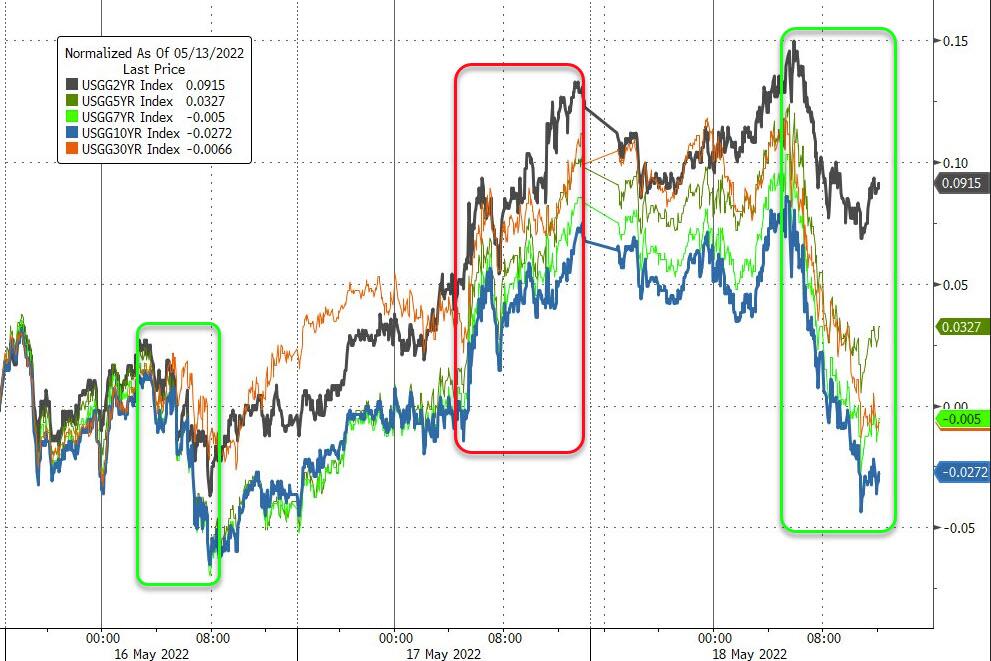
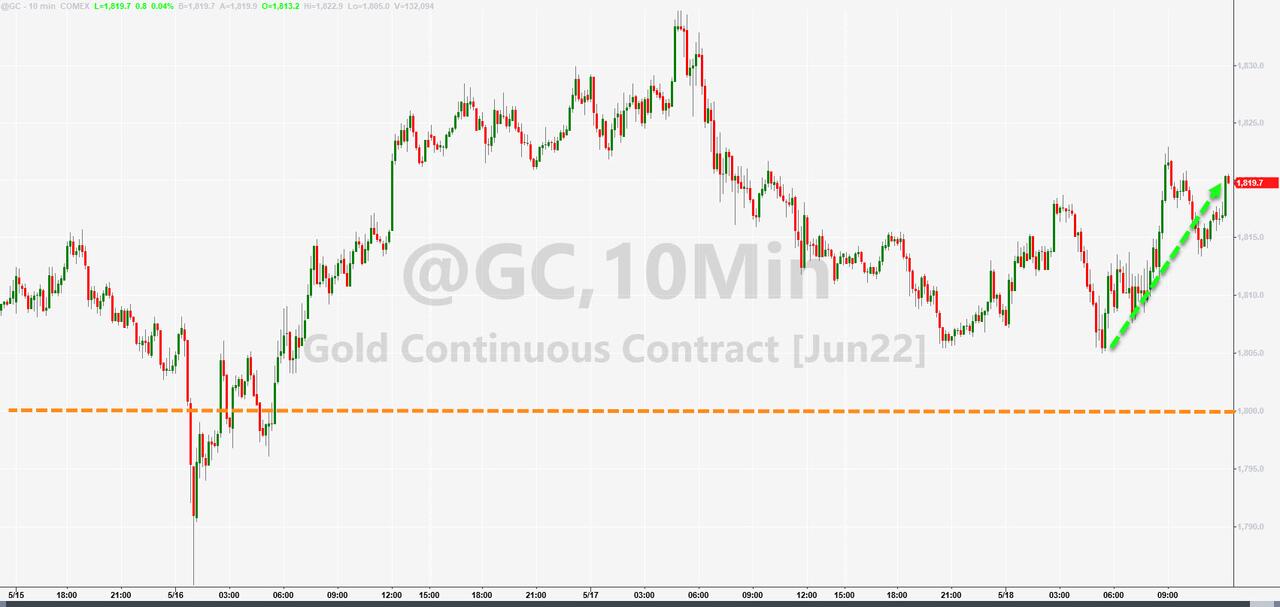
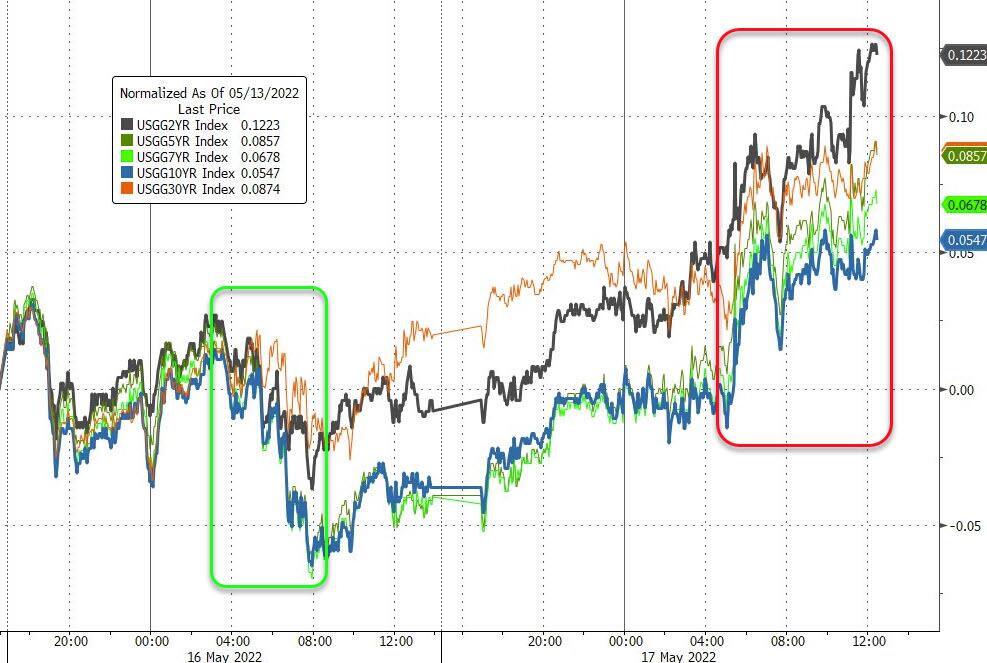
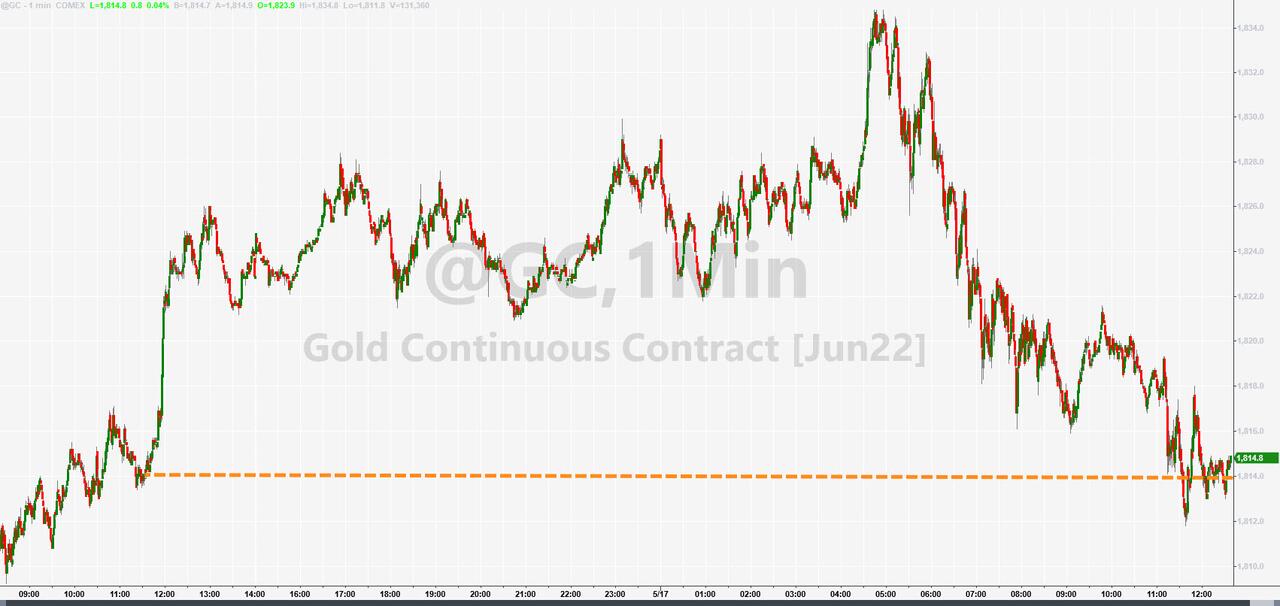
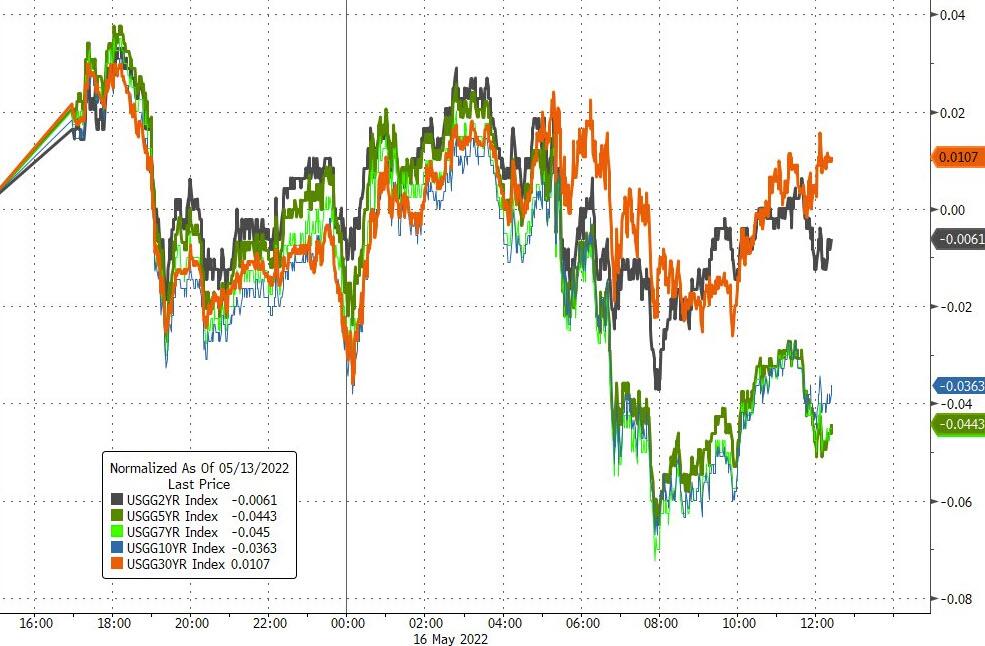
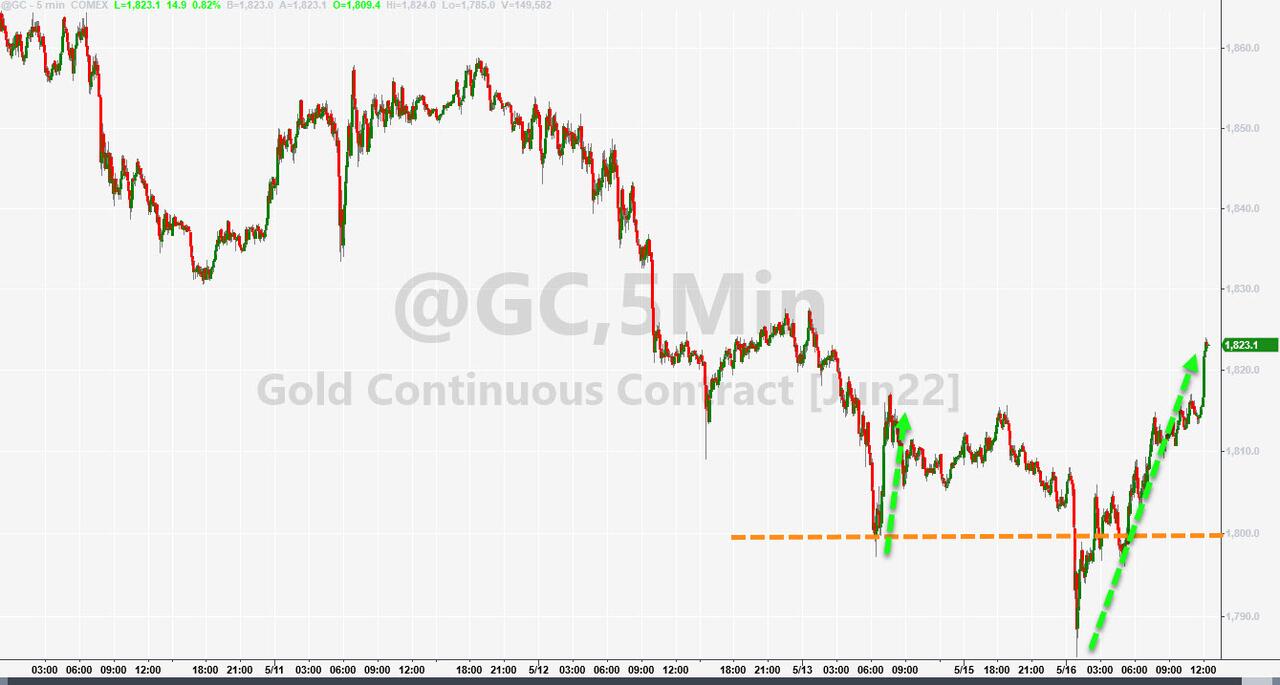
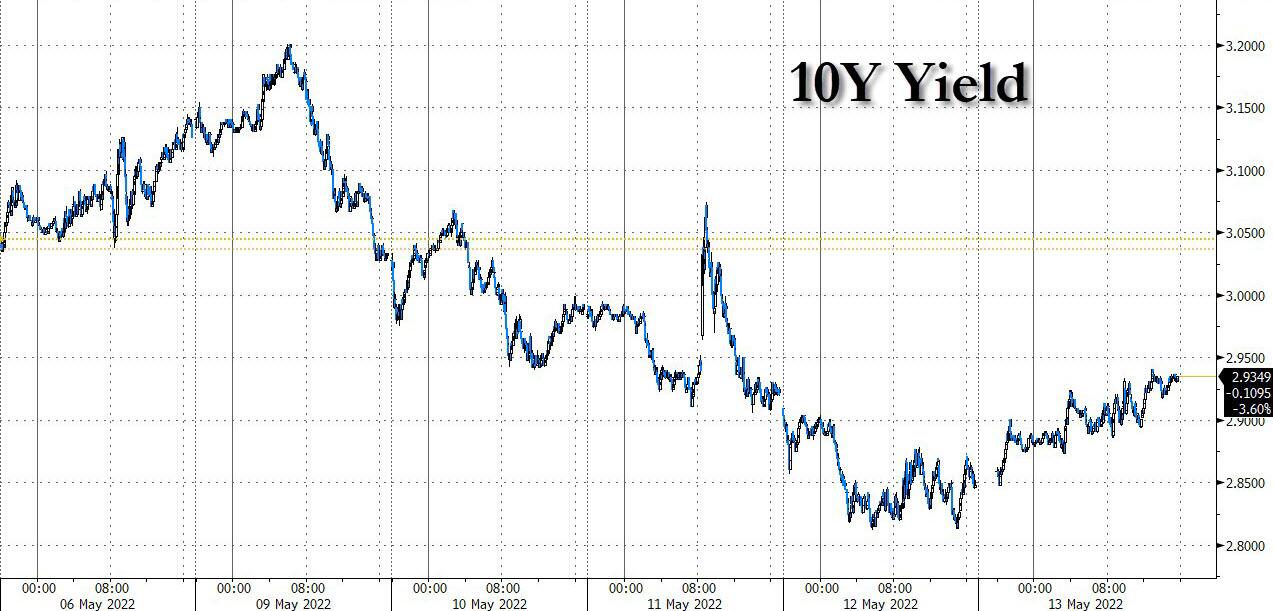
As was no surprise, Trucking stocks were hammered, bond yields retreated with the 10-year touching its 3% level but closing below 2.9%. Gold held up well during the debacle and scored some modest gains.  

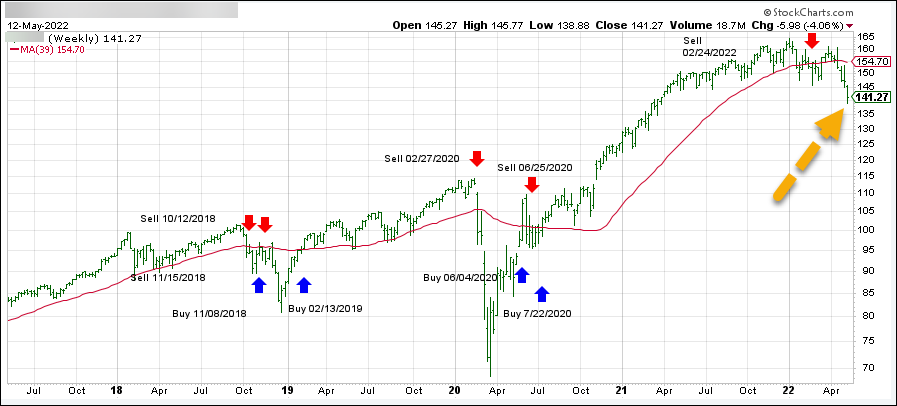
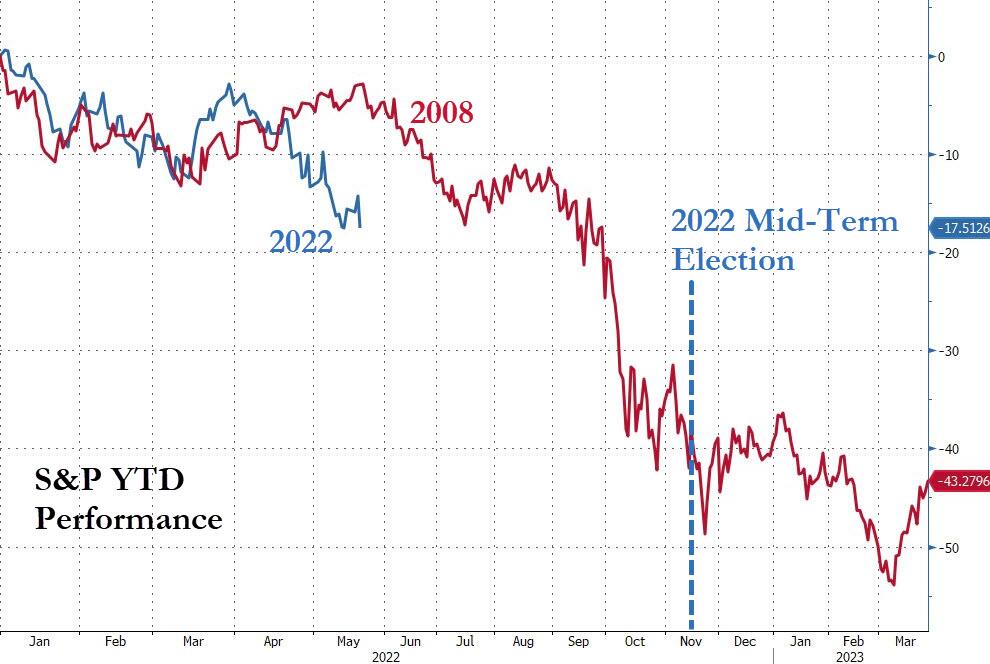
Looking at the big picture, could we see history repeating itself?

Read More

Bargain Hunters On The Loose

Ulli Market Commentary Contact

[Chart courtesy of MarketWatch.com]

  1. Moving the markets

Finally, an early advance, despite some mid-day pullbacks, continued its bullish trend, and the major indexes closed solidly in the green. Of course, the question remains whether upward momentum can be sustained in view of mounting concerns that the economy will tip into a recession later this year.

Contributing to this rebound may have been Fed chair Powell’s remarks, which offered nothing new, as Bloomberg reported:

  • POWELL: WON’T HESITATE TO RAISE RATES ABOVE NEUTRAL IF NEEDED
  • POWELL: WAR IN UKRAINE LOOKS LONGER-LASTING THAN FIRST EXPECTED
  • POWELL: IT’S GOING TO BE CHALLENGING TASK TO TAME INFLATION
  • POWELL: THERE COULD BE SOME PAIN INVOLVED

And that is what could have dip buyers encouraged to step back in, as “nothing new” was interpreted as “he could have said something worse.” While the markets pulled back initially, the hopeful meme that Powell will fold sooner rather than later, and thereby salvage equities again, like in 2018, kept the bounce alive.

If that hope is smashed, and he turns out to be serious about getting inflation back under control, all bets are off. Powell left himself wide open to interpretation with these comments:

“If things come in better than we expect, then we’re prepared to do less, if they come in worse than when we expect, then we’re prepared to do more.”

“So, the question whether we can execute a soft landing or not, it may actually depend on factors that we don’t control.”

Bond yields surged with the 10-year adding 11 basis points but stopped short of the 3% level to close at 2.992%. The US Dollar continued its 3-day slide, wholesale gasoline was heading towards the $5 level, Gold round tripped and ended unchanged.

Uncertainty reigns, and this bounce could continue into Friday’s options expirations or die on the vine tomorrow. Right now, we remain entrenched on the bearish side of the trend line.

Read More

Another Bounce-Back Bites The Dust

Ulli Market Commentary Contact

[Chart courtesy of MarketWatch.com]

  1. Moving the markets

Friday’s rebound of hope found some support mid-session today, but suddenly lost steam and the major indexes headed back into the red except for the Dow, which eked out a small gain. It was another frustrating day for the bulls, with especially the Nasdaq getting hit hard again.

Trading was choppy as concerns of a slowing economy, along with higher interest rates and soaring inflation, have negatively influenced sentiment and appear to be permanent companions—at least for the foreseeable future. To no surprise, this has been a downer for all equity markets as MarketWatch pointed out:

The major averages have fallen well off their record highs. The Dow and S&P 500 are 12.3% and 16.3%, respectively, below all-time highs reached in January. The Nasdaq is squarely in bear market territory, down more than 27% from its November record.  

According to ZH, the Empire Fed Manufacturing index bit the dust big time and dragged down the US Macro Surprise Index into the red for the first time since February.

Bonds rallied a bit, as yields retreated, but the moves were tiny and still aided TBF, which rallies with rising yields, to a positive close. The US Dollar tumbled, as gold advanced to recapture its $1,800 level, followed by Crude Oil, which almost touched $115 intraday.

The best performer of the day, as you might have expected in this inflationary environment, were commodities with the DBC ETF scoring a solid +1.64% gain.    

Read More

ETFs On The Cutline – Updated Through 05/13/2022

Ulli ETFs on the Cutline Contact

Below, please find the latest High-Volume ETF Cutline report, which shows how far above or below their respective long-term trend lines (39-week SMA) my currently tracked ETFs are positioned.

This report covers the HV ETF Master List from Thursday’s StatSheet and includes 312 High Volume ETFs, defined as those with an average daily volume of more than $5 million, of which currently 47 (last week 54) are hovering in bullish territory. The yellow line separates those ETFs that are positioned above their trend line (%M/A) from those that have dropped below it.

Take a look:                                                                   

The HV ETF Master Cutline Report

In case you are not familiar with some of the terminology used in the reports, please read the Glossary of Terms. If you missed the original post about the Cutline approach, you can read it here.      

ETF Tracker Newsletter For May 13, 2022

Ulli ETF Tracker Contact

ETF Tracker StatSheet          

You can view the latest version here.

A LOSING WEEK ENDS ON A POSITIVE NOTE

[Chart courtesy of MarketWatch.com]

  1. Moving the markets

After many head fakes over the past few weeks, an early bounce found some staying power which, despite a mid-day pullback, had enough bullish support to propel the major indexes to a green close.

Nevertheless, this feel-good session was not enough to wipe out the past 4 days of losses, so the indexes ended the week in the red, with the S&P 500 surrendering some 2.4%. However, today’s comeback was broad based, because 93% of all S&P 500 members closed on a positive note.

The Nasdaq led the charge with an almost 4% gain supported by some of the beaten down heavyweights like Apple, Nvidia, Tesla and Meta Platforms, which finally staged a comeback.

Still, YTD, the Nasdaq is down some 26%, while the S&P 500 has suffered a drop of over 17%, a slide that covers now the sixth week in a row. If there is no upside follow through next week, today’s session may turn out to be nothing more than another dead-cat-bounce in an ongoing bear market.

For sure, tumbling bond yields helped today’s bullish theme, even though the 10-year closed at 2.92%, up from yesterday’s 2.82% but way below the 3.2% level it touched earlier in the week.

One arena that can’t seem to find some solid footing has been precious metals. Gold slipped again and reached its lowest level since February, according to ZeroHedge, and dipped a tad into the red YTD (-0.46%).

There are several scenarios on deck all depending on the actions of the Fed. This chart by Bloomberg demonstrated the various outcomes and their effects on the S&P 500 price levels. Should Stagflation be the potential result, the S&P 500 would have shed some 40% from current levels.

Ouch!

Read More

Weekly StatSheet For The ETF Tracker Newsletter – Updated Through 05/12/2022

Ulli ETF StatSheet Contact

ETF Data updated through Thursday, May 12, 2022

Methodology/Use of this StatSheet:

1. From the universe of over 1,800 ETFs, I have selected only those with a trading volume of over $5 million per day (HV ETFs), so that liquidity and a small bid/ask spread are assured.

2. Trend Tracking Indexes (TTIs)

Buy or Sell decisions for Domestic and International ETFs (section 1 and 2), are made based on the respective TTI and its position either above or below its long-term M/A (Moving Average). A crossing of the trend line from below accompanied by some staying power above constitutes a “Buy” signal. Conversely, a clear break below the line constitutes a “Sell” signal. Additionally, I use an 12% trailing stop loss on all positions in these categories to control downside risk.

3. All other investment arenas do not have a TTI and should be traded based on the position of the individual ETF relative to its own respective trend line (%M/A). That’s why those signals are referred to as a “Selective Buy.” In other words, if an ETF crosses its own trendline to the upside, a “Buy” signal is generated. Here too, I recommend trailing sell stop of 12%, or less, depending on your risk tolerance.

If you are unfamiliar with some of the terminology, please see Glossary of Terms and new subscriber information in section 9.     

1. DOMESTIC EQUITY ETFs: SELL — since 02/24/2022

Click on chart to enlarge

Our main directional indicator, the Domestic Trend Tracking Index (TTI-green line in the above chart) has broken below its long-term trend line (red) by -8.87% and remains in “SELL” mode.  

Read More