
- Moving the markets
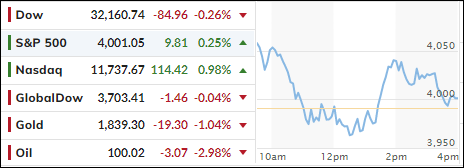
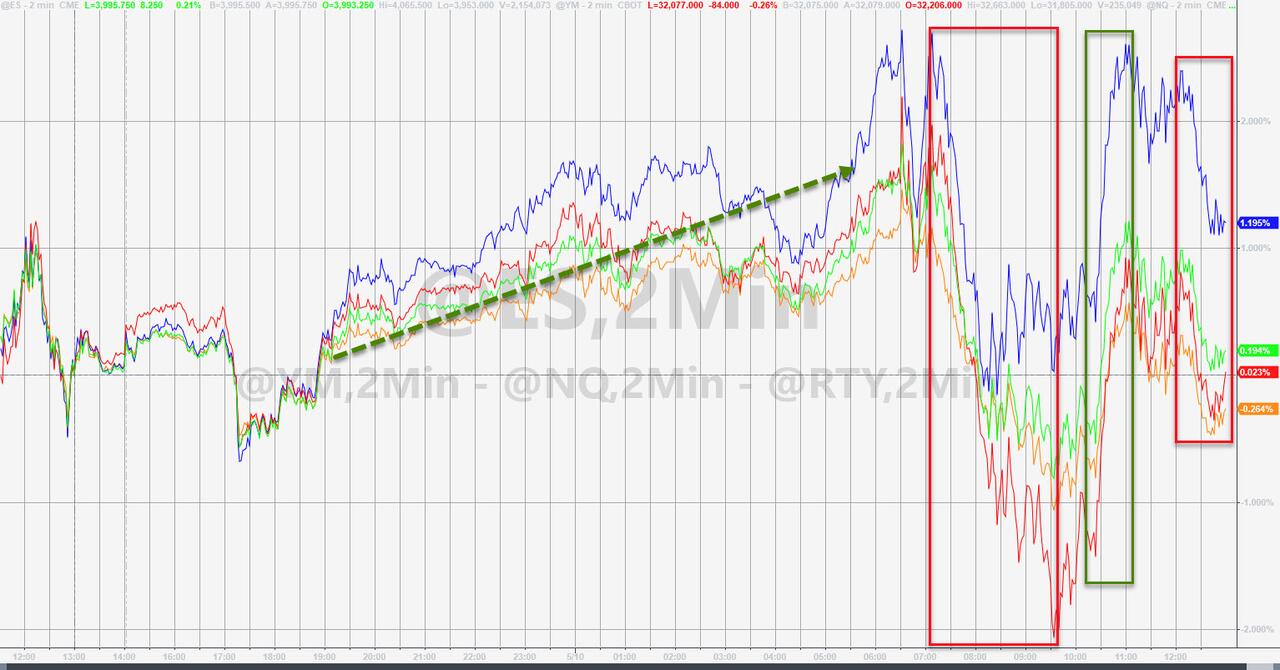
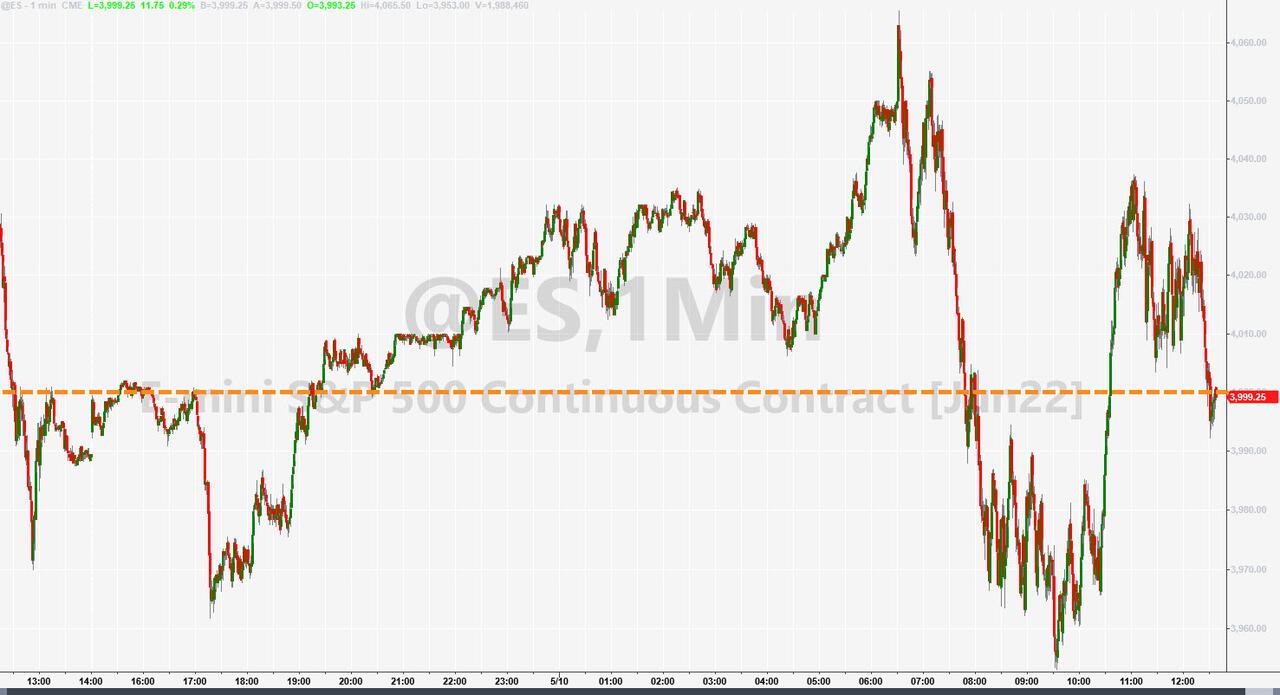
An early +500-point Dow relief rally died on the vine, as the index suddenly reversed course and dove into the red by -150 points before chopping and flopping around the unchanged line into the close. This marked the Dow’s 4th consecutive decline.
The S&P 500 and Nasdaq followed a similar pattern but managed to eke out a green close with the former reclaiming its psychologically important 4k level. Overall, it appeared that the bearish mood has not subsided, it has merely taken a pause ahead of tomorrow’s all-important CPI number.
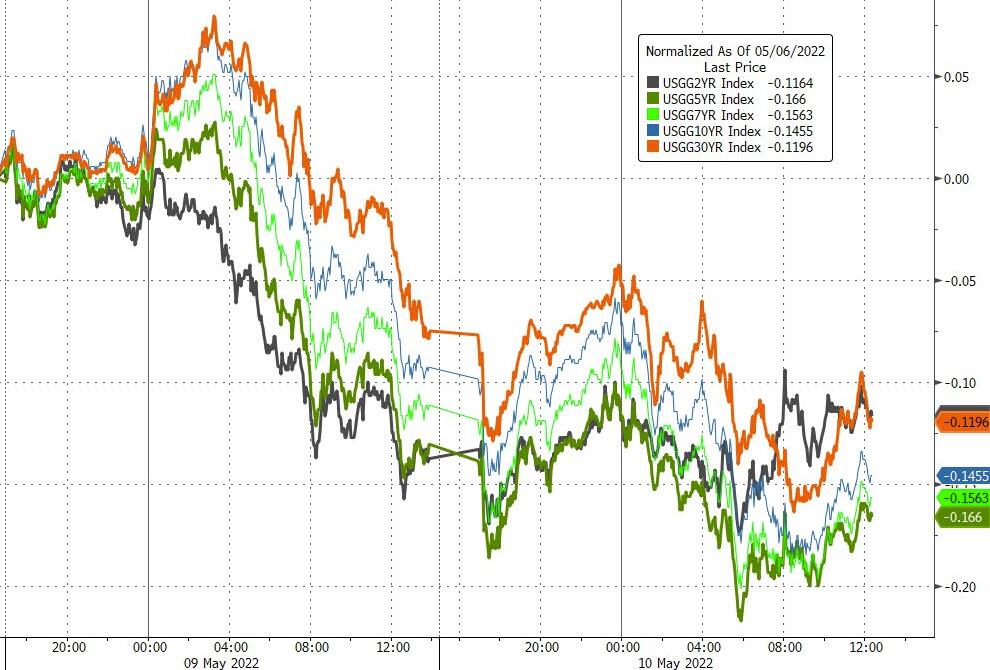
A variety of Fed speakers offered some much-needed hope to the beaten down bond- and stock investors with bon mots like “50bps-hikes are base-case, not sure if need to raise rates above neutral,” and “this was not a shock-and-awe Volcker moment.” This had the desired effect to prop up stocks, if only temporarily, and pulled bond yields off their lofty levels with the 10-year dropping back a tad below its 3% level to close at 2.994%.
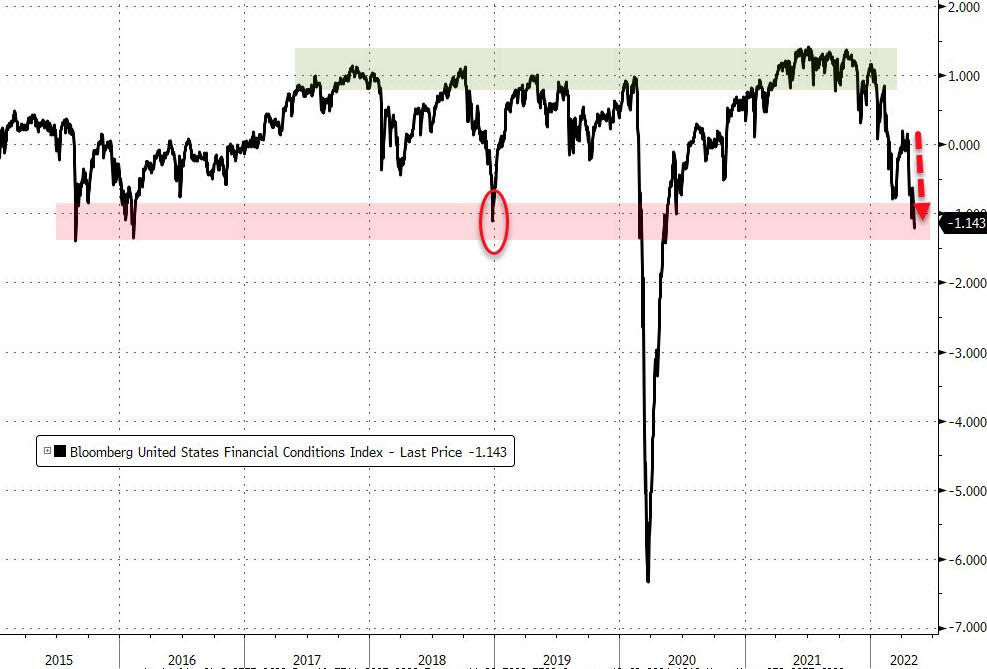
ZeroHedge pointed out that financial conditions have tightened significantly and are now at the same level where Powell flip-flopped back to dovish in 2018. Will history repeat itself? Tomorrow’s CPI may give us a hint.
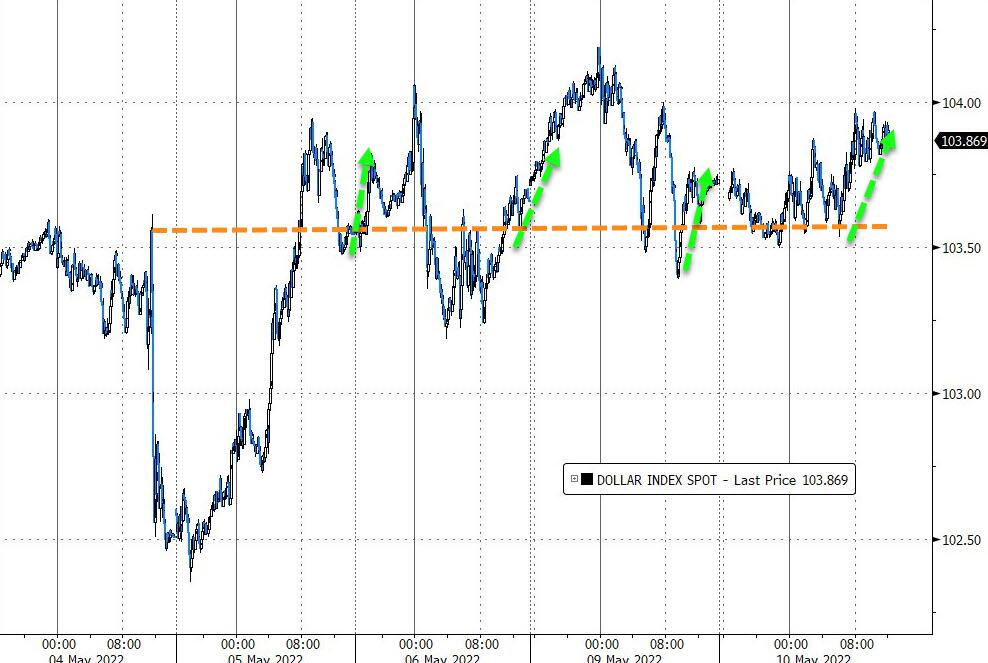
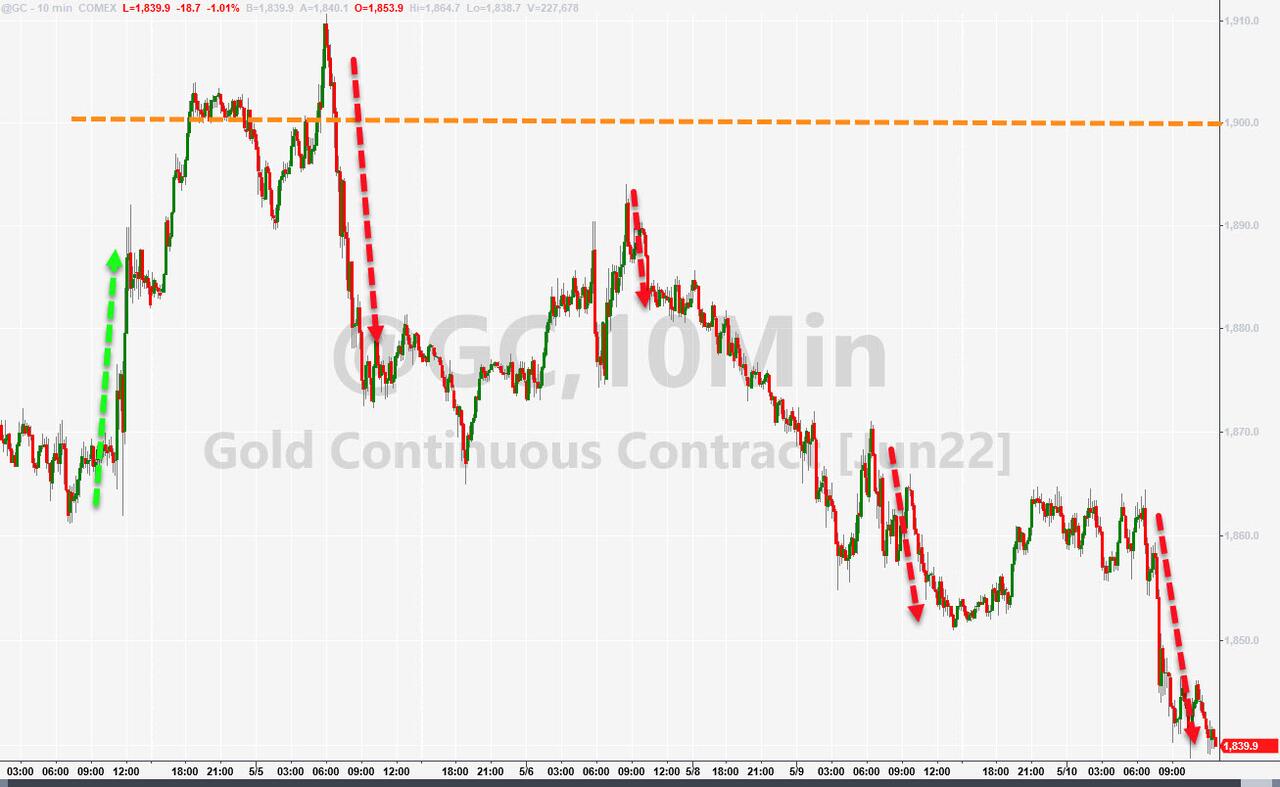
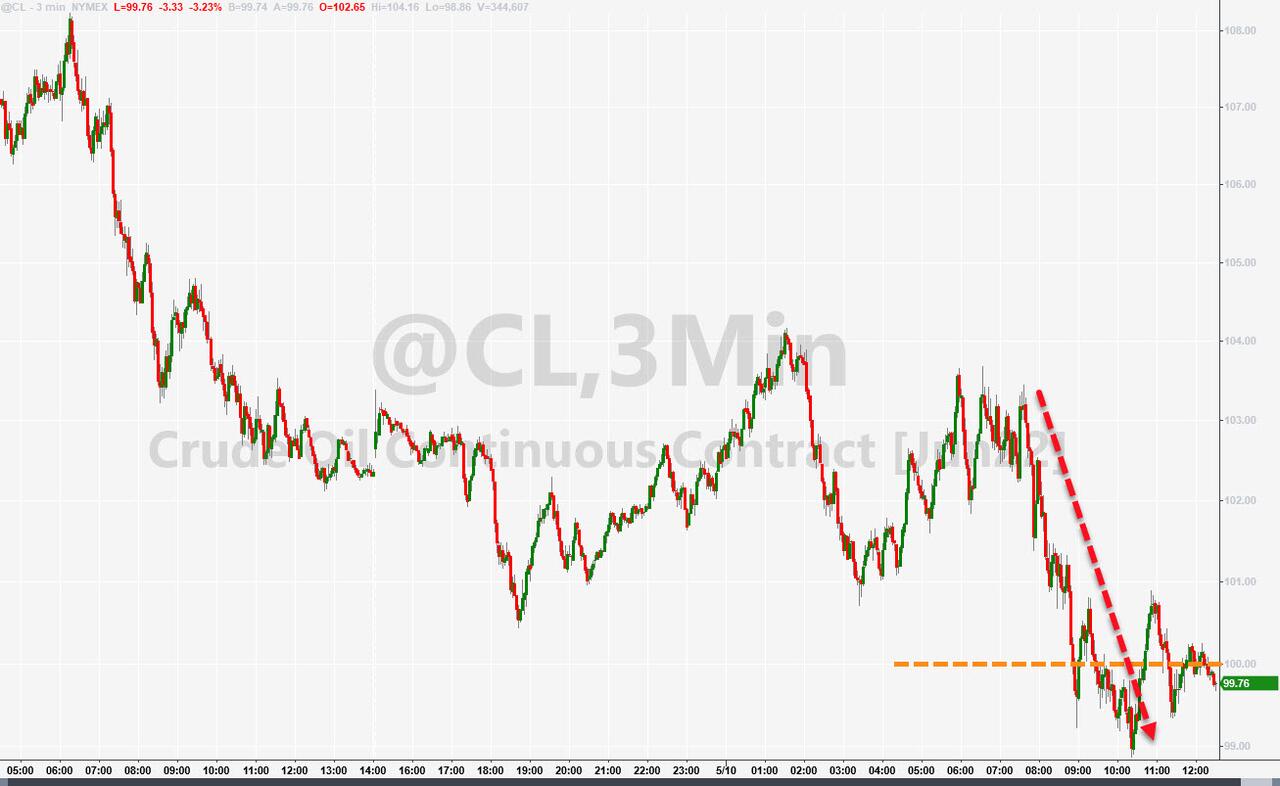
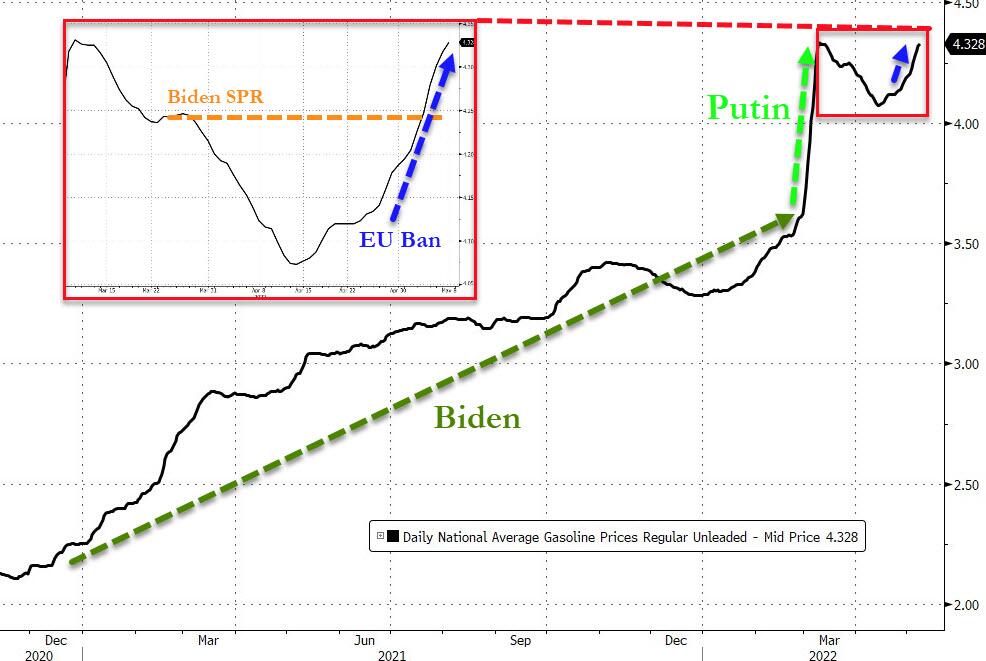
The US Dollar went sideways, Gold was held below its $1,900 level, while Crude Oil slipped below the $100 marker. US Retail Gasoline prices surged to a record new high but, as ZeroHedge explained with this chart “it’s still Putin’s fault, right?”
2. ETFs in the Spotlight
In case you missed the announcement and description of this section, you can read it here again.
It features some of the 10 broadly diversified domestic and sector ETFs from my HighVolume list as posted every Saturday. Furthermore, they are screened for the lowest MaxDD% number meaning they have been showing better resistance to temporary sell offs than all others over the past year.
The below table simply demonstrates the magnitude with which these ETFs are fluctuating above or below their respective individual trend lines (%+/-M/A). A break below, represented by a negative number, shows weakness, while a break above, represented by a positive percentage, shows strength.
For hundreds of ETF choices, be sure to reference Thursday’s StatSheet.
For this closed-out domestic “Buy” cycle (2/24/2022), here’s how some of our candidates have fared:

Click image to enlarge.
Again, the %+/-M/A column above shows the position of the various ETFs in relation to their respective long-term trend lines, while the trailing sell stops are being tracked in the “Off High” column. The “Action” column will signal a “Sell” once the -12% point has been taken out in the “Off High” column, which has replaced the prior -8% to -10% limits.
3. Trend Tracking Indexes (TTIs)
Our TTIs slipped again as bearish forces overpowered bullish intent.
This is how we closed 05/10/2022:
Domestic TTI: -8.07% below its M/A (prior close -7.80%)—Sell signal effective 02/24/2022.
International TTI: -8.72% below its M/A (prior close -8.62%)—Sell signal effective 03/08/2022.
Disclosure: I am obliged to inform you that I, as well as my advisory clients, own some of the ETFs listed in the above table. Furthermore, they do not represent a specific investment recommendation for you, they merely show which ETFs from the universe I track are falling within the specified guidelines.
All linked charts above are courtesy of Bloomberg via ZeroHedge.
Contact Ulli