
- Moving the markets
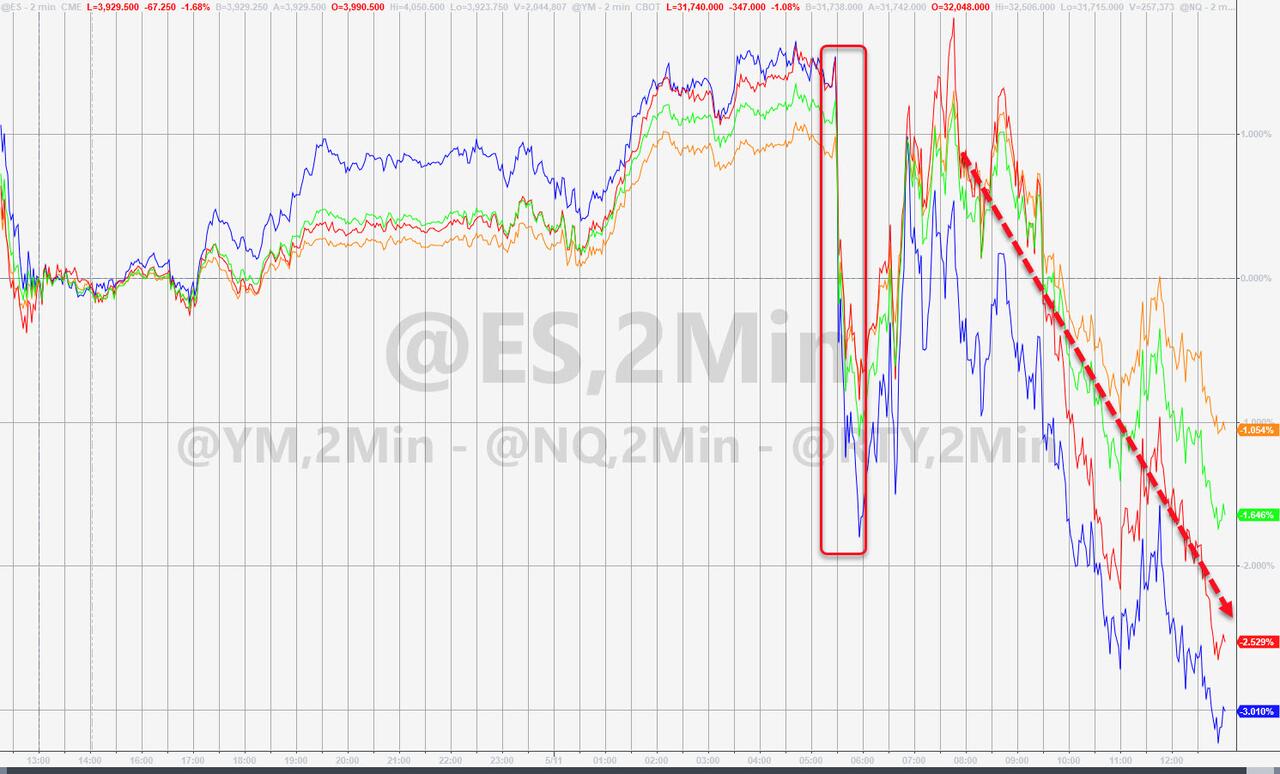
The pattern, that early ramps get wiped out during the session, has been occurring with such regularity, that we could conclude that they are merely dead-cat-bounces, i.e., hopeful leaps with no connection to reality.
Today was no exception. The chart above clearly demonstrates that occurrence and here again, the major indexes got spanked, despite a late day rebound above the unchanged line.
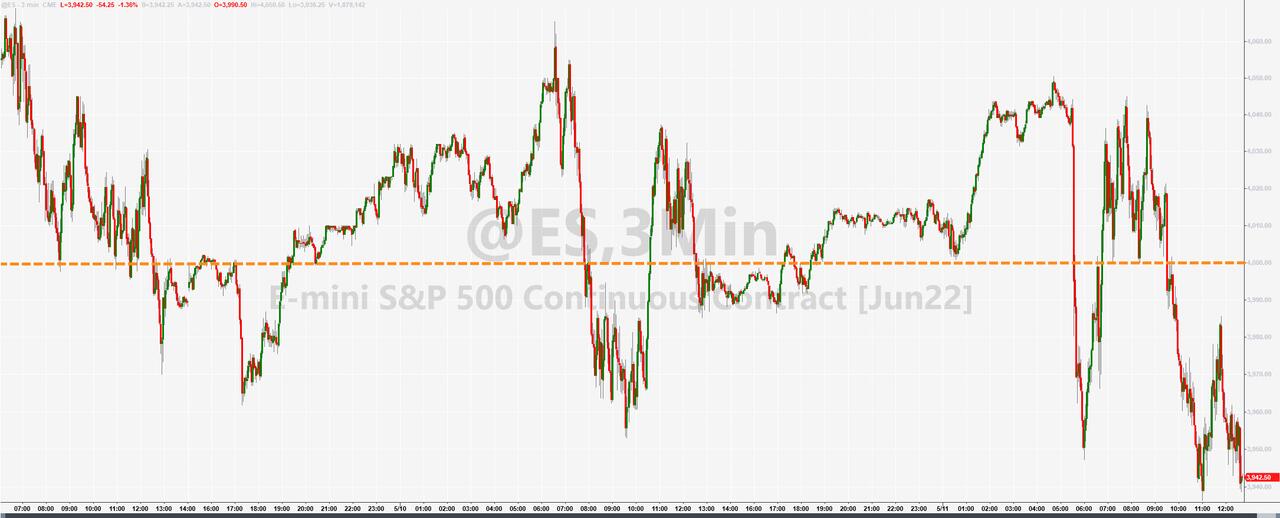
As ZeroHedge pointed out, today is the biggest 5-day drop for stocks since 3/20/20, with the S&P 500 now clearly having lost its 4k level:
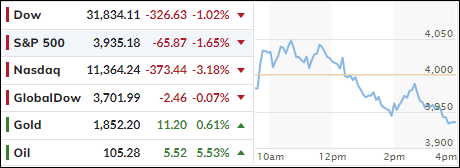
- Nasdaq is now down over 29% from its highs, Dow down over 17%, and the S&P almost 14%.
Today’s April CPI report of 8.3% YoY, while an improvement from March’s 8.5%, was higher than the expected 8.1%. Hope that inflation may have peaked, was nothing but wishful thinking, and that reality set in later and pulled the major indexes into the red.
As I have repeatedly said, the Fed is way behind in its attempts to curb inflation, and a far more aggressive approach is needed to not only conquer the price increases we are experiencing now—but also to get a handle on potential hyperinflation and a cost-of-living crisis. A puny 0.5% hike in the Federal Funds rate will not do it.
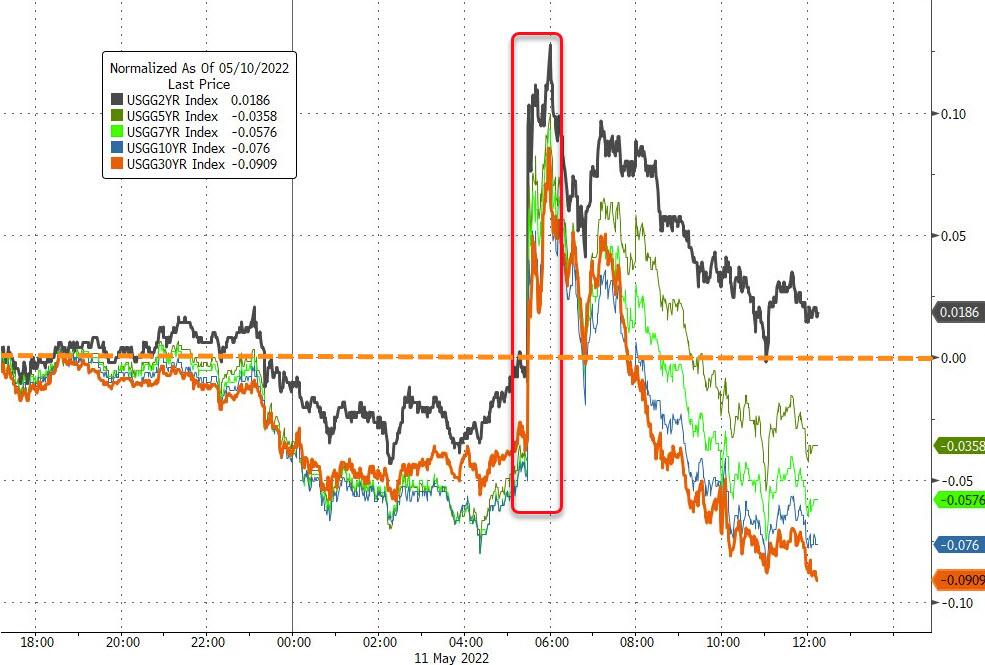
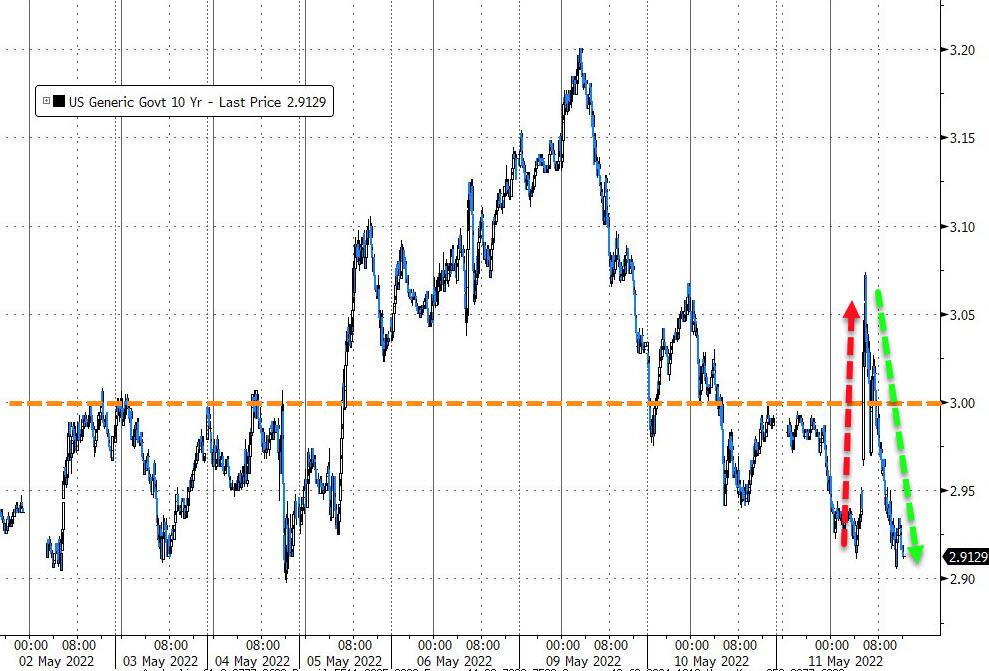
Bond yields spiked but pulled back late in the session, with the 10-year retreating from its 3.06% intra-day high to close down 7 bps at 2.93%.
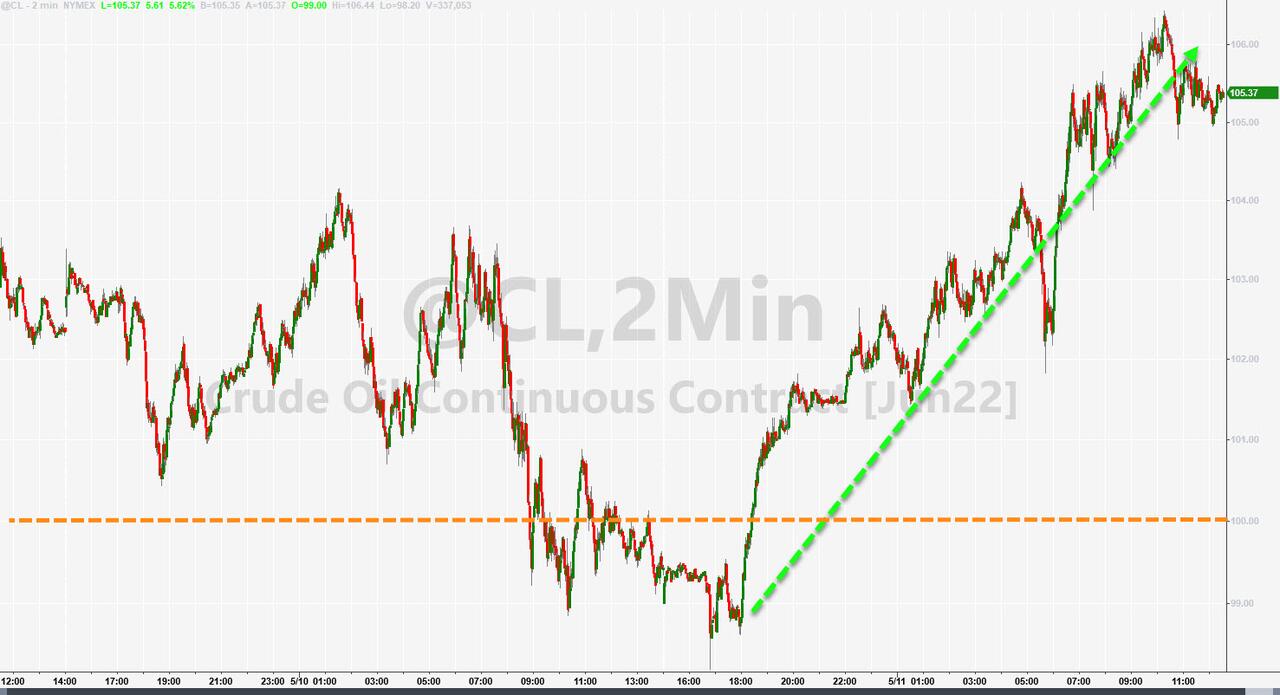
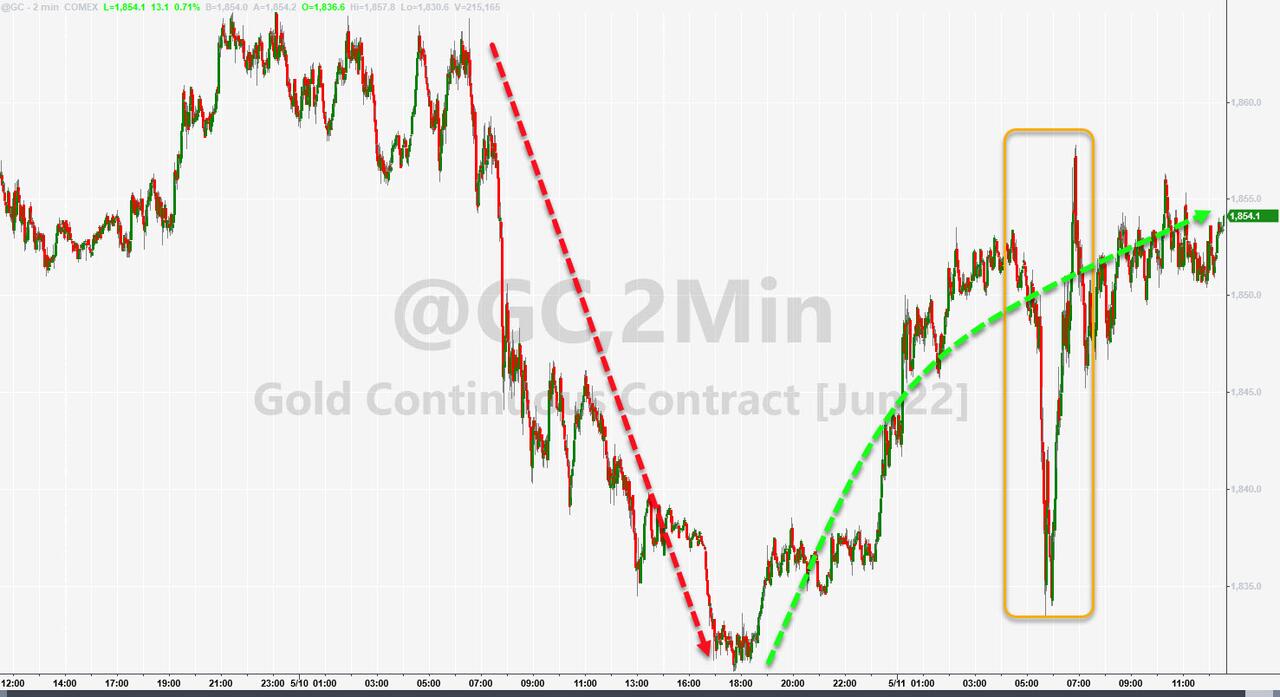
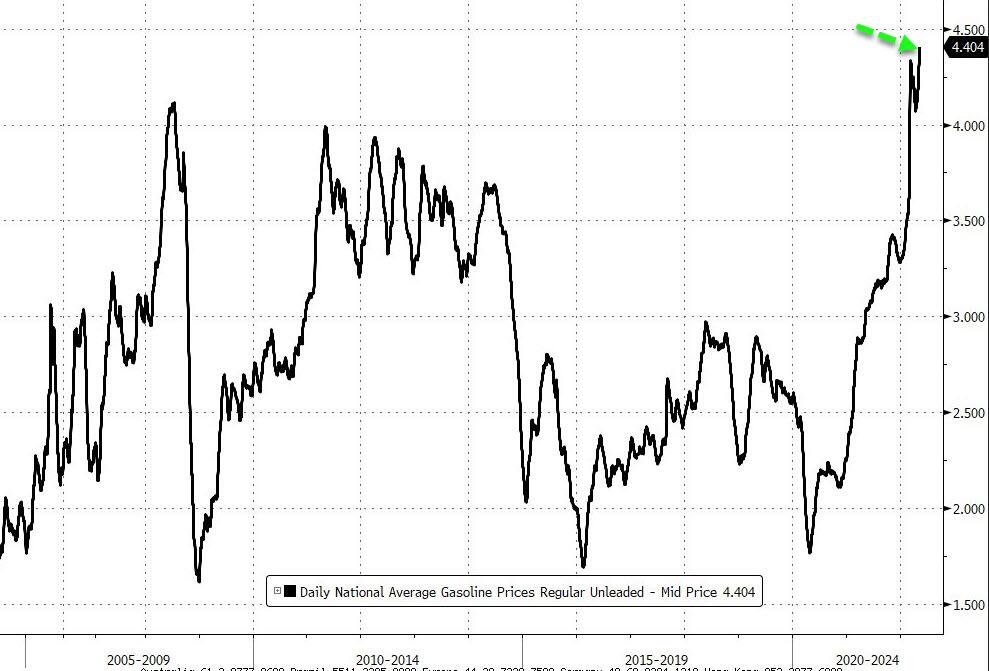
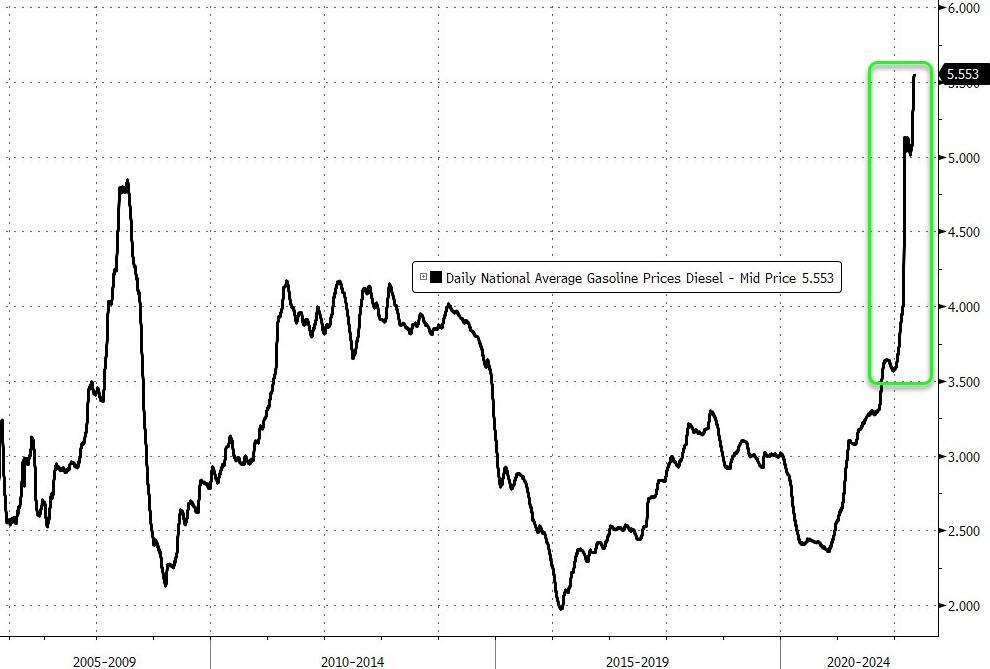
Crude Oil bounced back above $100, gold had a decent showing, but is still trying to climb back above its $1,900 level, and retail gasoline prices set a new record. More astounding was the price of Diesel fuel, which absolutely exploded.
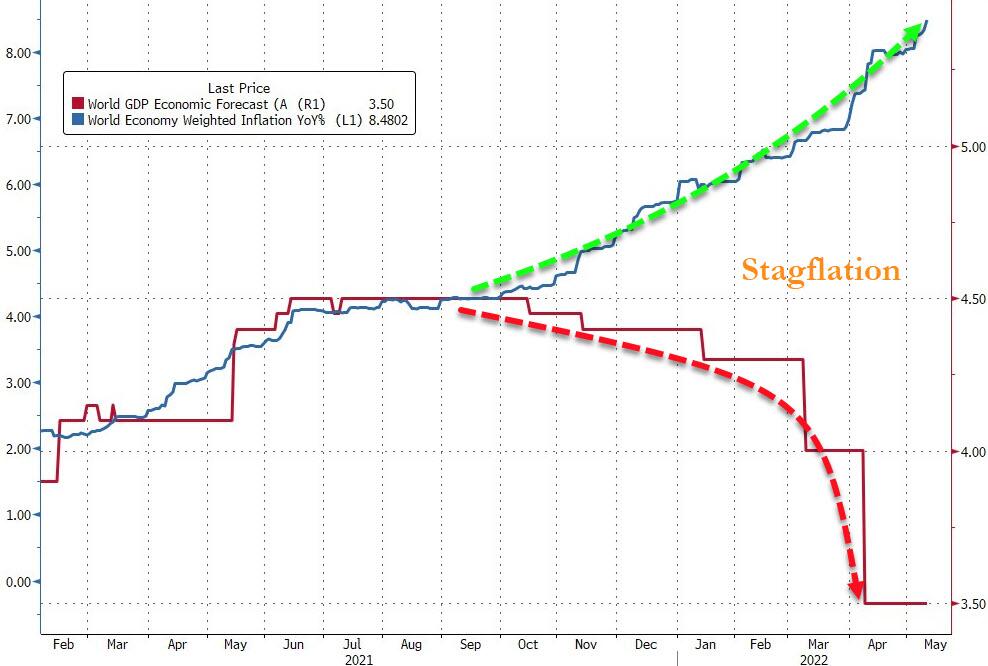
Having said all that, the dreaded “S” word, as in Stagflation (inflation + no growth), is making the rounds again, with Bloomberg producing this chart as evidence.
2. ETFs in the Spotlight
In case you missed the announcement and description of this section, you can read it here again.
It features some of the 10 broadly diversified domestic and sector ETFs from my HighVolume list as posted every Saturday. Furthermore, they are screened for the lowest MaxDD% number meaning they have been showing better resistance to temporary sell offs than all others over the past year.
The below table simply demonstrates the magnitude with which these ETFs are fluctuating above or below their respective individual trend lines (%+/-M/A). A break below, represented by a negative number, shows weakness, while a break above, represented by a positive percentage, shows strength.
For hundreds of ETF choices, be sure to reference Thursday’s StatSheet.
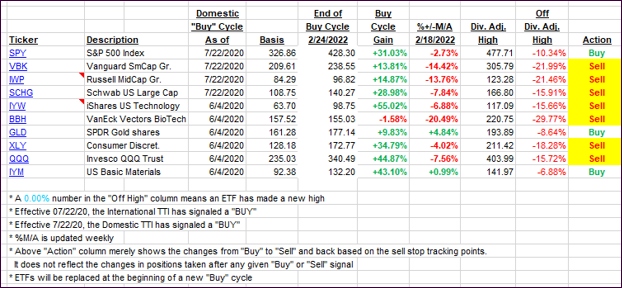
For this closed-out domestic “Buy” cycle (2/24/2022), here’s how some of our candidates have fared:
Click image to enlarge.
Again, the %+/-M/A column above shows the position of the various ETFs in relation to their respective long-term trend lines, while the trailing sell stops are being tracked in the “Off High” column. The “Action” column will signal a “Sell” once the -12% point has been taken out in the “Off High” column, which has replaced the prior -8% to -10% limits.
3. Trend Tracking Indexes (TTIs)
While the International TTI held up well, its Domestic cousin took a dive and hovers now deeply in bear market territory.
This is how we closed 05/11/2022:
Domestic TTI: -9.26% below its M/A (prior close -8.07%)—Sell signal effective 02/24/2022.
International TTI: -8.76% below its M/A (prior close -8.72%)—Sell signal effective 03/08/2022.
Disclosure: I am obliged to inform you that I, as well as my advisory clients, own some of the ETFs listed in the above table. Furthermore, they do not represent a specific investment recommendation for you, they merely show which ETFs from the universe I track are falling within the specified guidelines.
All linked charts above are courtesy of Bloomberg via ZeroHedge.
Contact Ulli