
- Moving the markets
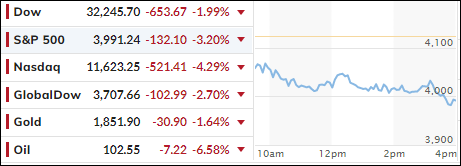
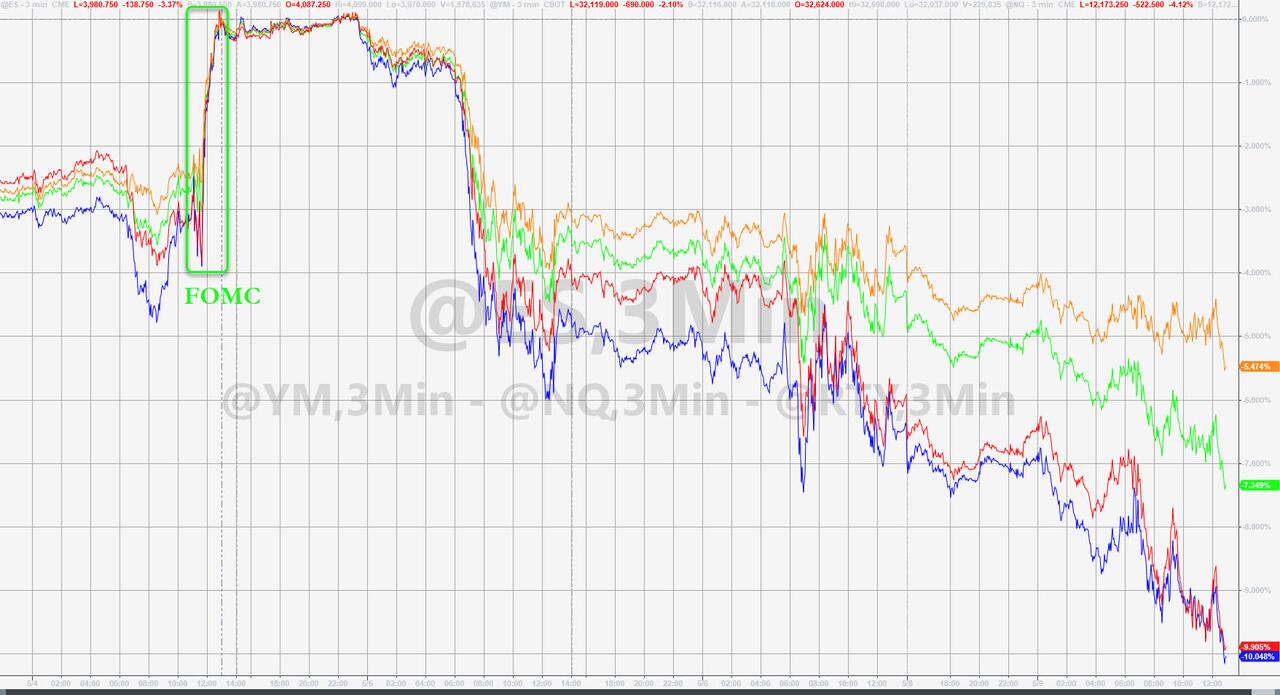
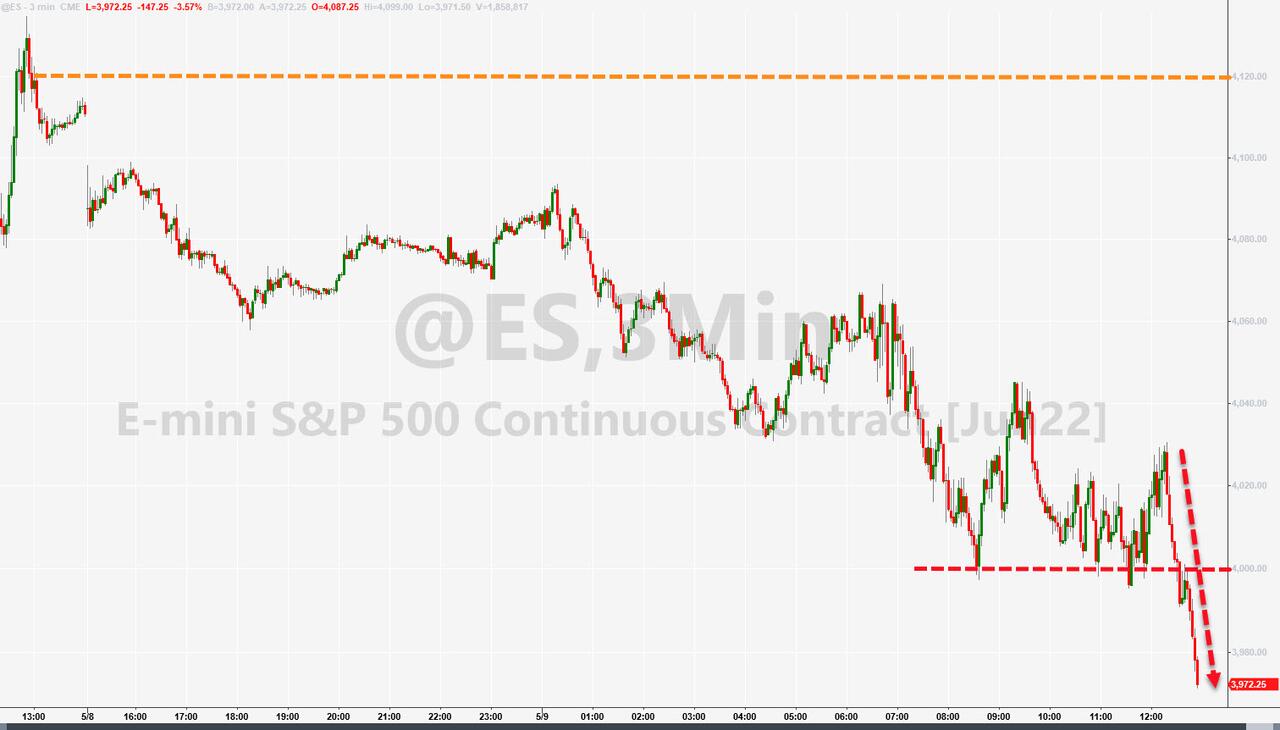
Not only did last week’s debacle continue this morning, but markets also took a sudden dive during the last hour of trading, with the S&P 500 breaching its psychologically important 4k marker to the downside to close slightly below it and at its lowest in 13 months.
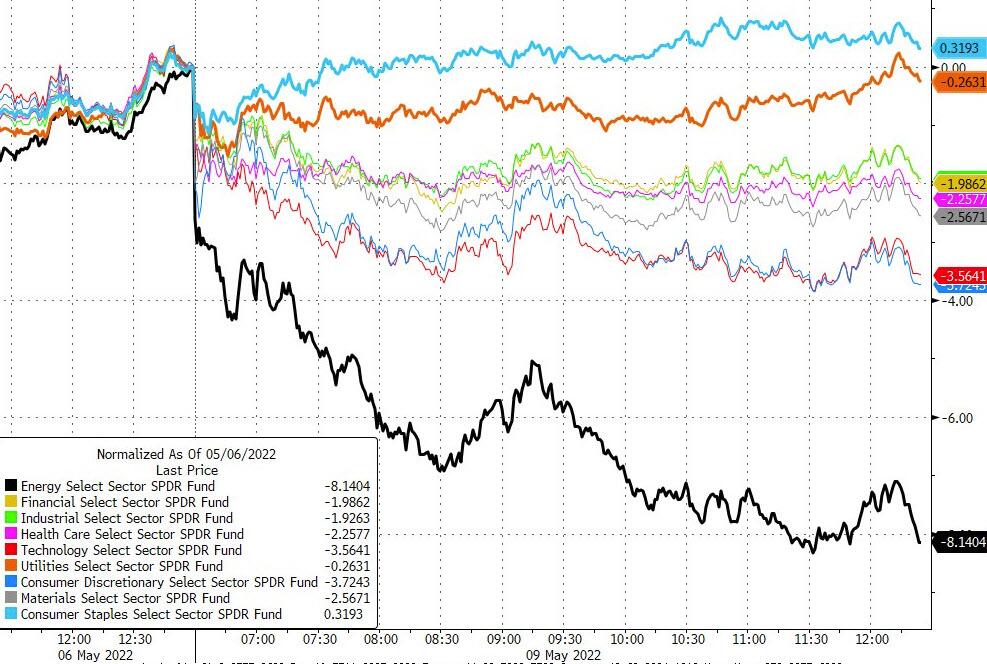
Again, this was a day with no place to hide, as even well-performing sector funds, like energy and commodities, were not immune from the onslaught of selling. Our energy sector position touched its trailing sell stop, which I took as an opportunity to get out of it and lock in some unrealized gains.
Interest rate fears had bonds swinging wildly with the 10-year slipping 9 basis points but maintaining its position above the 3% level. Rising interest rates have crushed the Nasdaq with the index caving another 4.3% today, and now down 27% from its record highs.
While bear market rallies can always develop suddenly, the major trend is to the downside, which had been confirmed by our Domestic TTI on 2/24/22.
As I pointed out, this is not the time to be in equities but to be in cash on the sidelines or in selected sector funds that are undergoing their own bullish trends. The Stagflation risk will be with us, which means that weakness in equities is bound to continue.
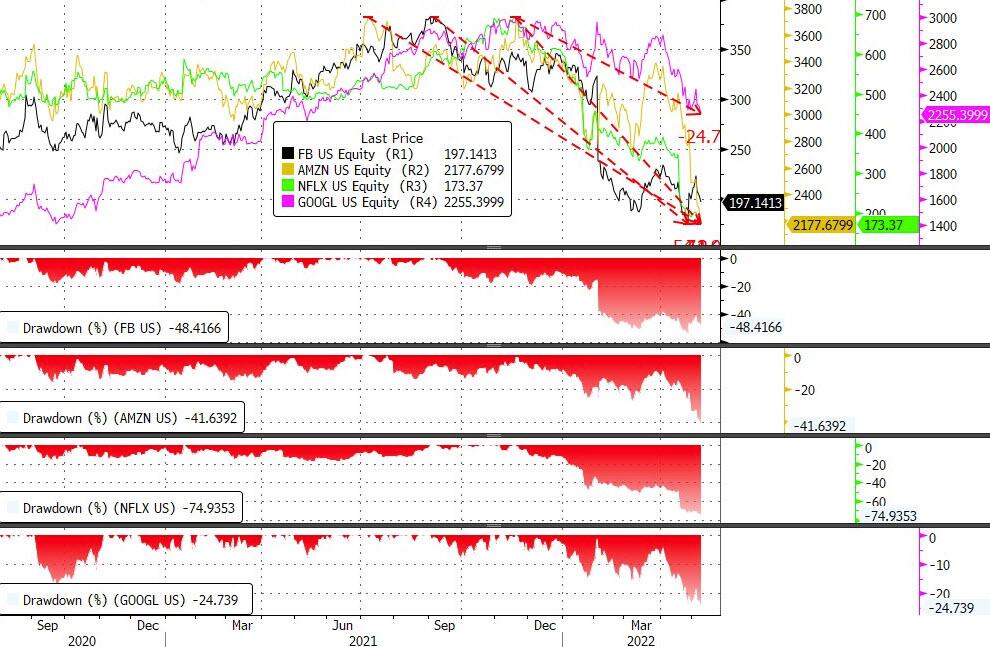
If this is not clear, ZH pointed to what happened to the Fang stocks so far:
FB -48%, AMZN -42%, NFLX -75%, GOOGL -25%
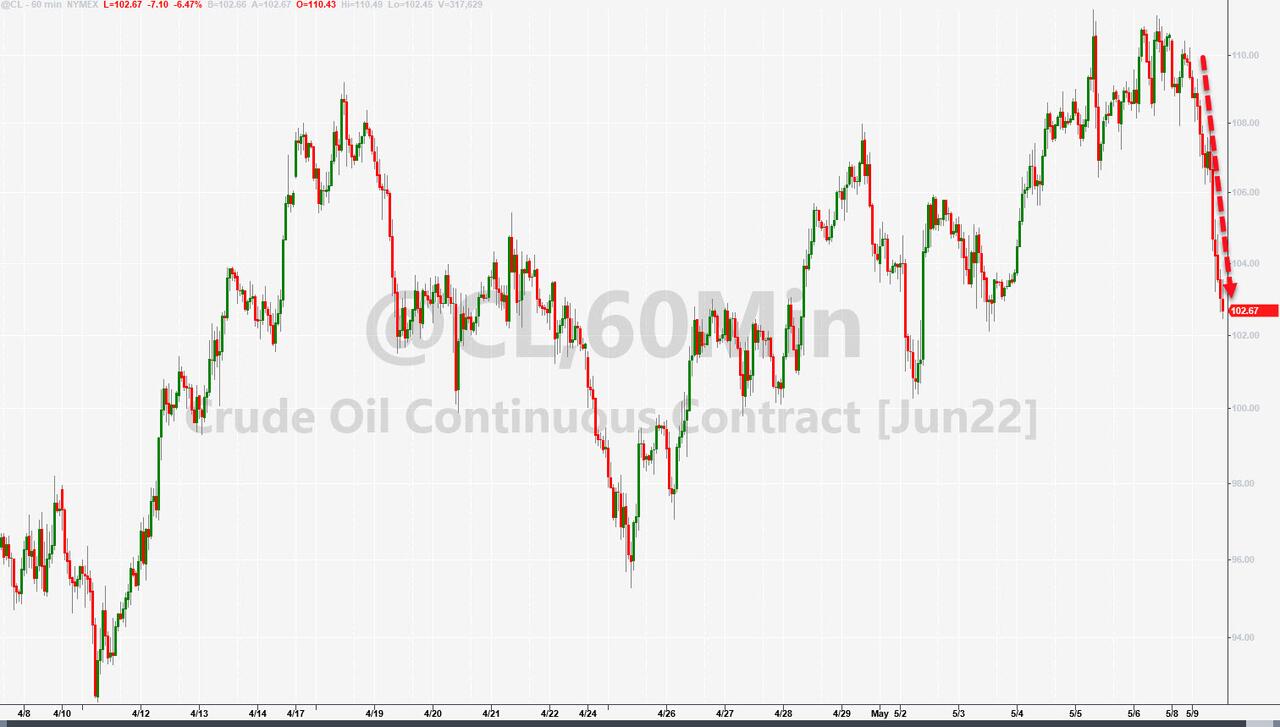
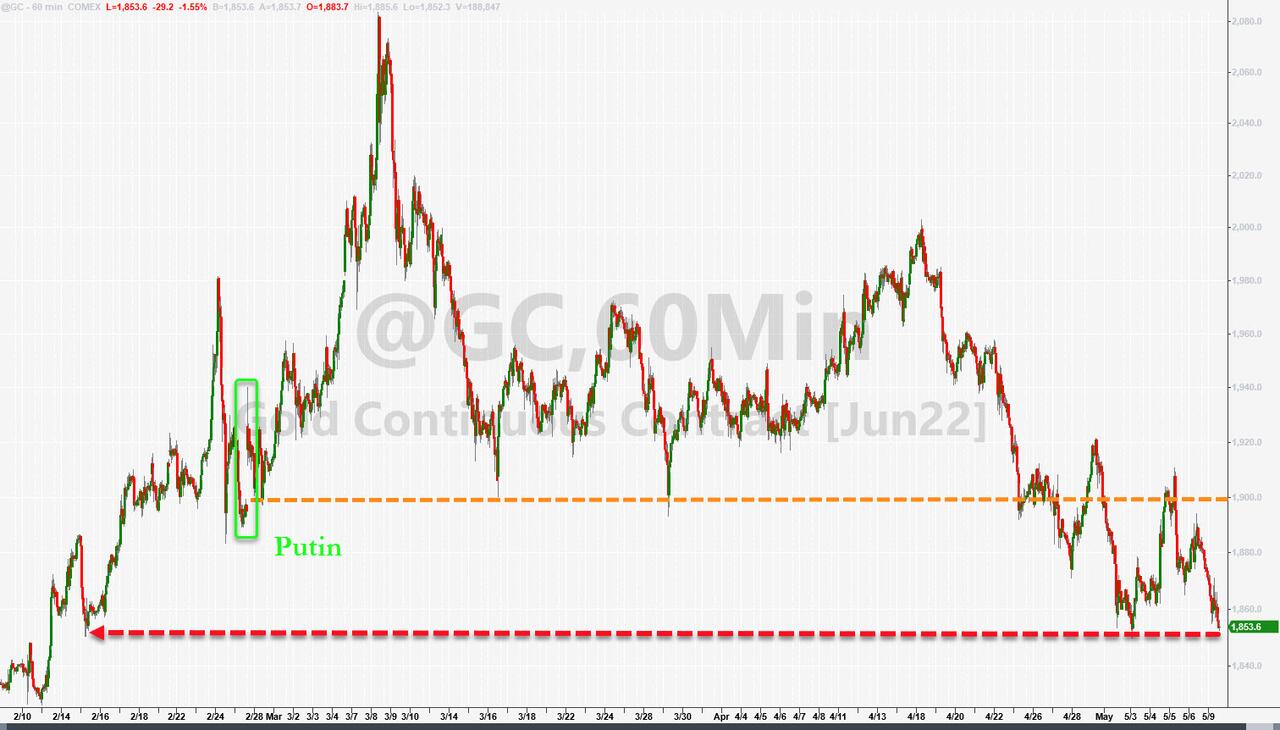
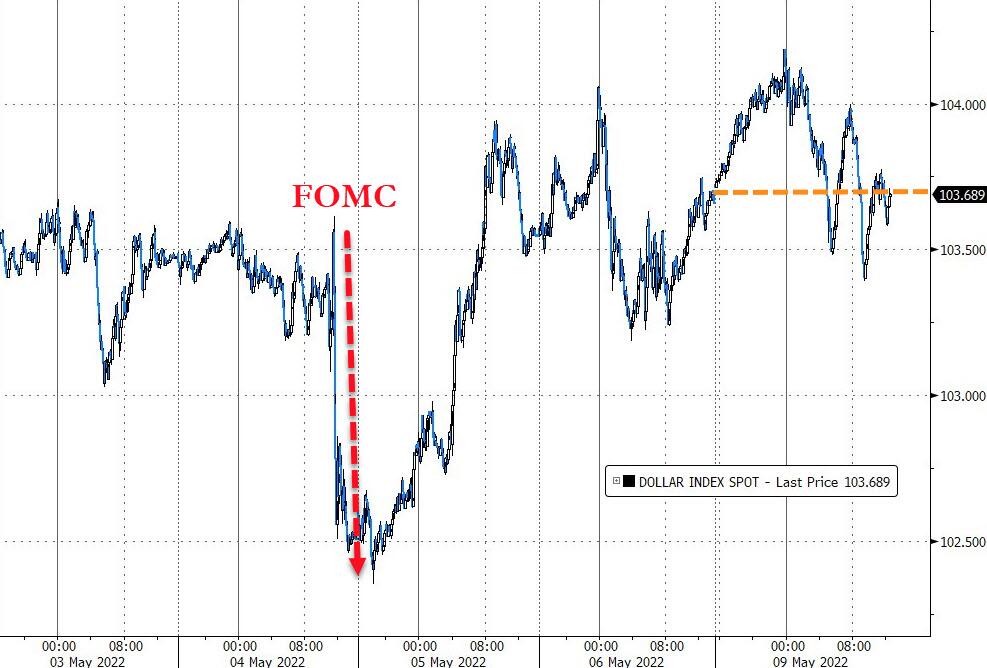
Crude oil plunged and gold tumbled, while the US Dollar went sideways and still hovers near its 20-year highs.
All this begs the question as to whether the Fed will fold to save the markets or be serious in its intentions to battle inflation.
2. ETFs in the Spotlight
In case you missed the announcement and description of this section, you can read it here again.
It features some of the 10 broadly diversified domestic and sector ETFs from my HighVolume list as posted every Saturday. Furthermore, they are screened for the lowest MaxDD% number meaning they have been showing better resistance to temporary sell offs than all others over the past year.
The below table simply demonstrates the magnitude with which these ETFs are fluctuating above or below their respective individual trend lines (%+/-M/A). A break below, represented by a negative number, shows weakness, while a break above, represented by a positive percentage, shows strength.
For hundreds of ETF choices, be sure to reference Thursday’s StatSheet.
For this closed-out domestic “Buy” cycle (2/24/2022), here’s how some of our candidates have fared:
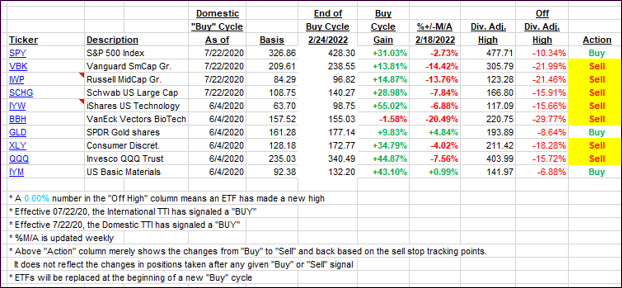
Click image to enlarge.
Again, the %+/-M/A column above shows the position of the various ETFs in relation to their respective long-term trend lines, while the trailing sell stops are being tracked in the “Off High” column. The “Action” column will signal a “Sell” once the -12% point has been taken out in the “Off High” column, which has replaced the prior -8% to -10% limits.
3. Trend Tracking Indexes (TTIs)
Our TTIs got spanked with the markets and dove deeper into bearish territory.
This is how we closed 05/09/2022:
Domestic TTI: -7.80% below its M/A (prior close -5.01%)—Sell signal effective 02/24/2022.
International TTI: -8.62% below its M/A (prior close -6.20%)—Sell signal effective 03/08/2022.
Disclosure: I am obliged to inform you that I, as well as my advisory clients, own some of the ETFs listed in the above table. Furthermore, they do not represent a specific investment recommendation for you, they merely show which ETFs from the universe I track are falling within the specified guidelines.
All linked charts above are courtesy of Bloomberg via ZeroHedge.
Contact Ulli