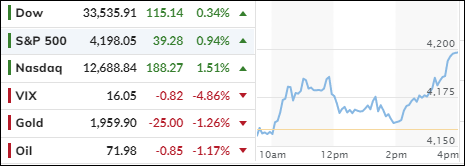
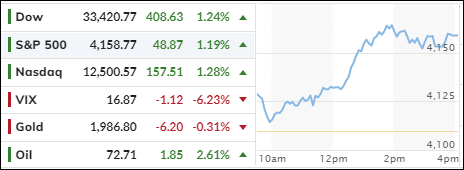
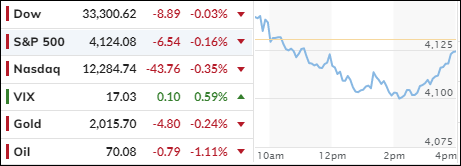
The stock market had a strong finish on Wednesday, overcoming a sluggish start and a midday dip. The S&P 500 turned positive for the month, while the Dow trailed behind the Nasdaq. The rally was fueled by optimism about a debt ceiling deal, as House Speaker McCarthy signaled progress in talks with President Biden.
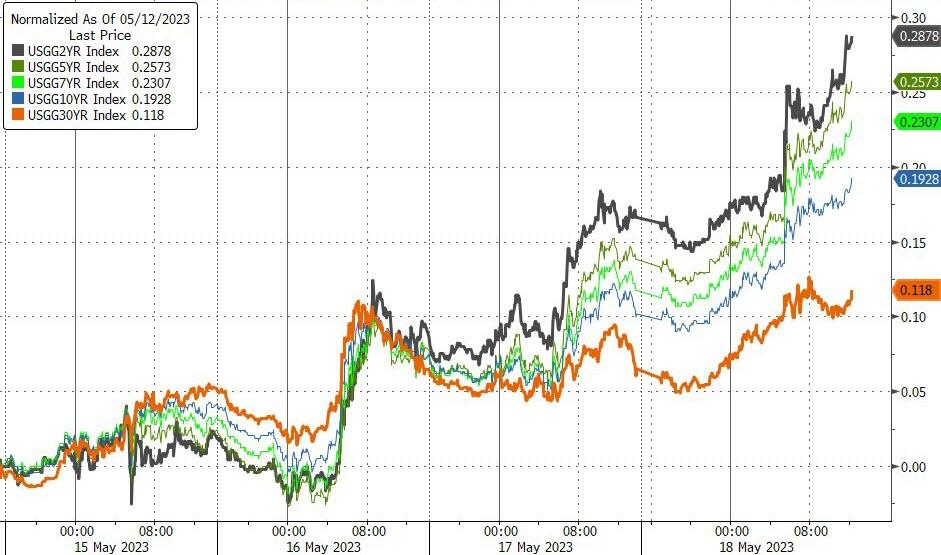
However, not everything was rosy on Wall Street. The Fed officials sounded hawkish, warning that inflation was too high and that rate hikes were still on the table. The bond market took notice, sending yields higher and hurting gold prices. The economic data was also mixed, with weak indicators for housing and business activity, but strong numbers for jobless claims and Walmart earnings.
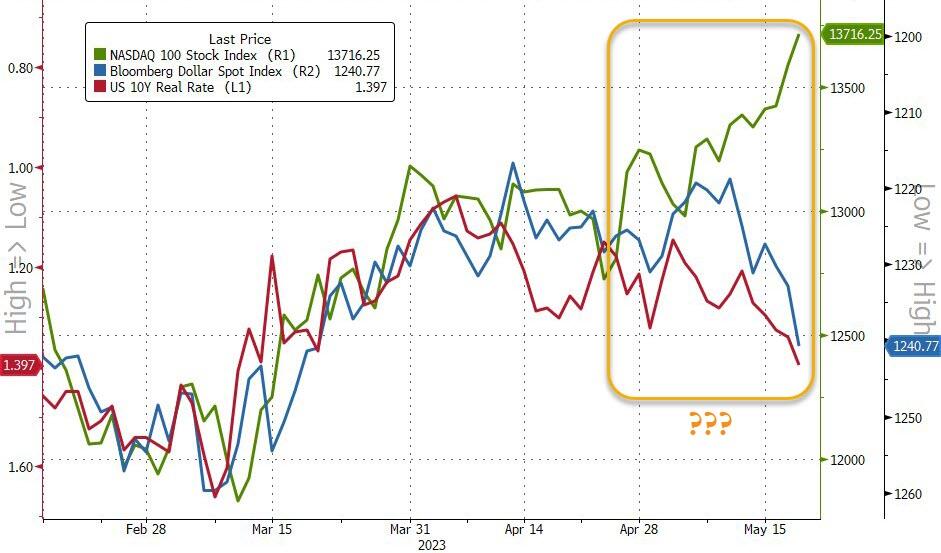
The Nasdaq seemed to ignore the rising bond yields, which usually weigh on growth stocks. This divergence could spell trouble down the road, as one of them will have to adjust to reality. Will the tech-heavy index fall or will the 10-year rate rise?
Stay tuned for the next episode of “The Market vs. The Fed”.
The markets were sluggish at first, but then they revved up their engines, as traders felt optimistic about a debt ceiling deal in the making. They were cheered by the words of speaker McCarthy, who said what Wall Street wanted to hear: “better progress”, “it’s possible to get a deal by the end of the week”, and “now we have a structure to find a way to come to a conclusion.”
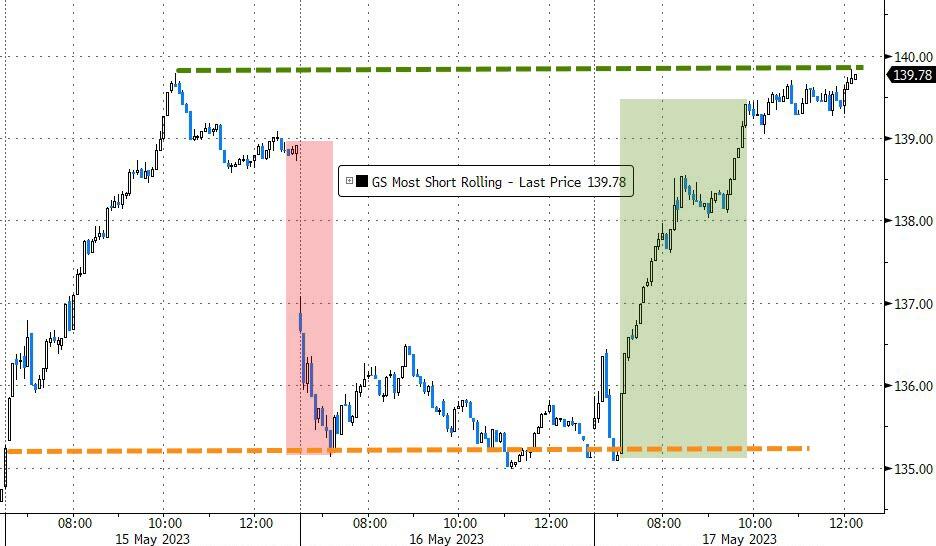
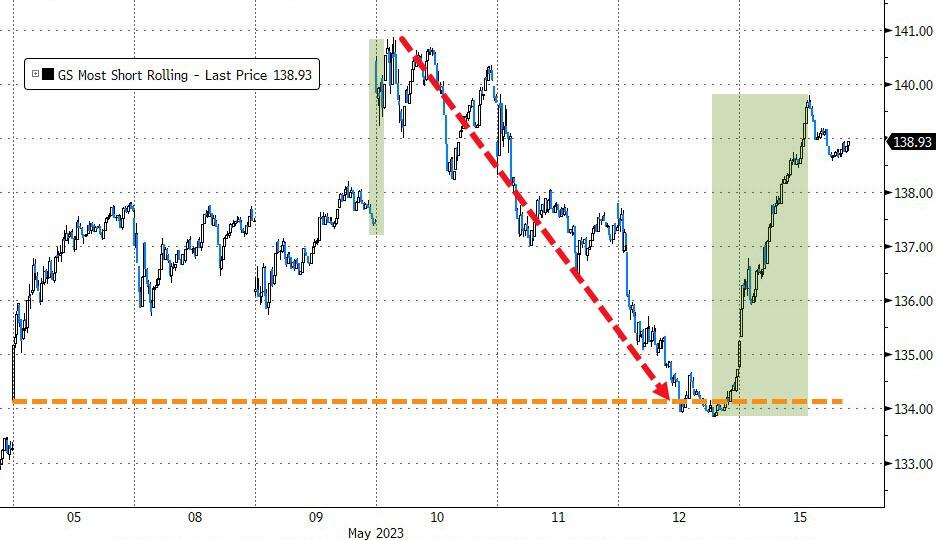
That boosted the mood of the bulls, who also benefited from a massive short squeeze, and pushed the major indexes to soar higher, especially since Biden did not object and said that it was a “productive” meeting and “I’m confident we will get a budget agreement.”
But the threat of a default still looms over the markets like a sword of Damocles, and until a deal is sealed, nothing is guaranteed. The markets have been stuck in limbo and have been oscillating around our directional indicator, the Domestic Trend Tracking Index (TTI).
It’s possible that a final debt deal clears the way for a breakout to the upside, but we could also witness a classic case of “buy the rumor, sell the fact”, which means that this euphoric move could reverse.
After all, none of the other problems that plague traders around economics, geo-politics, banking crisis and ever widening deficits have gone away and will come back to haunt us once the debt ceiling drama loses its steam.
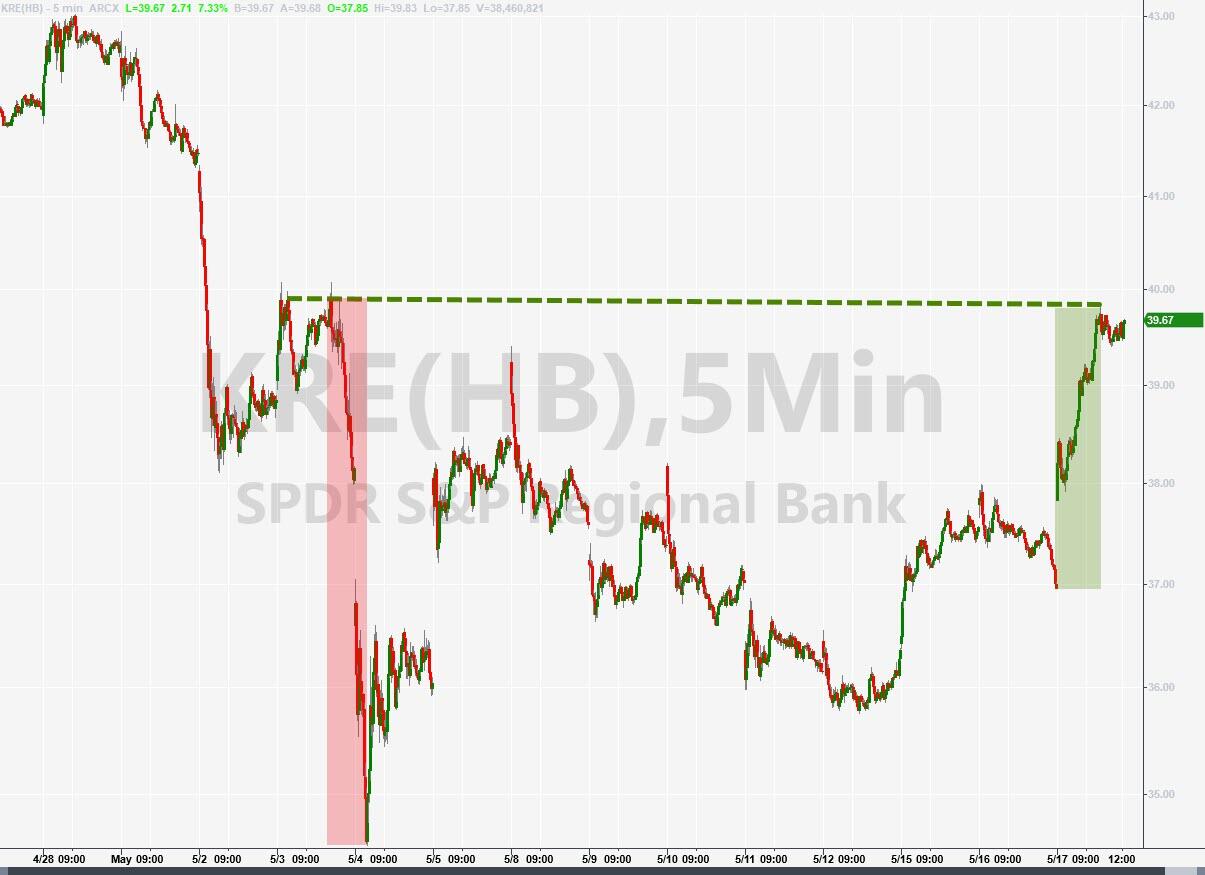
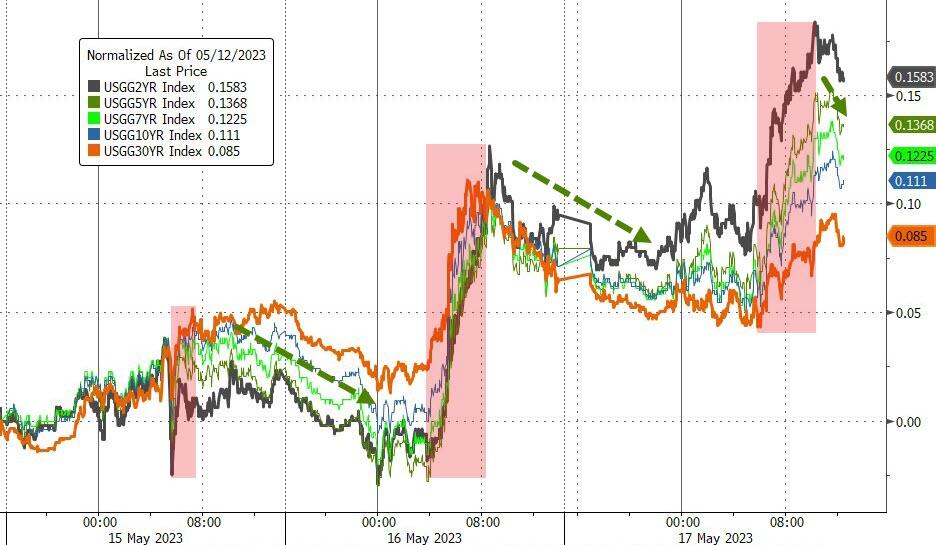
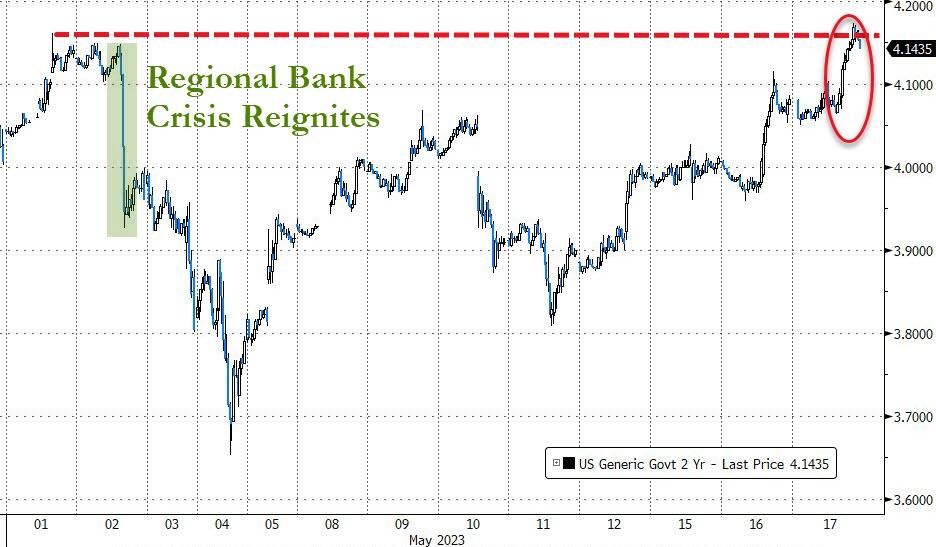
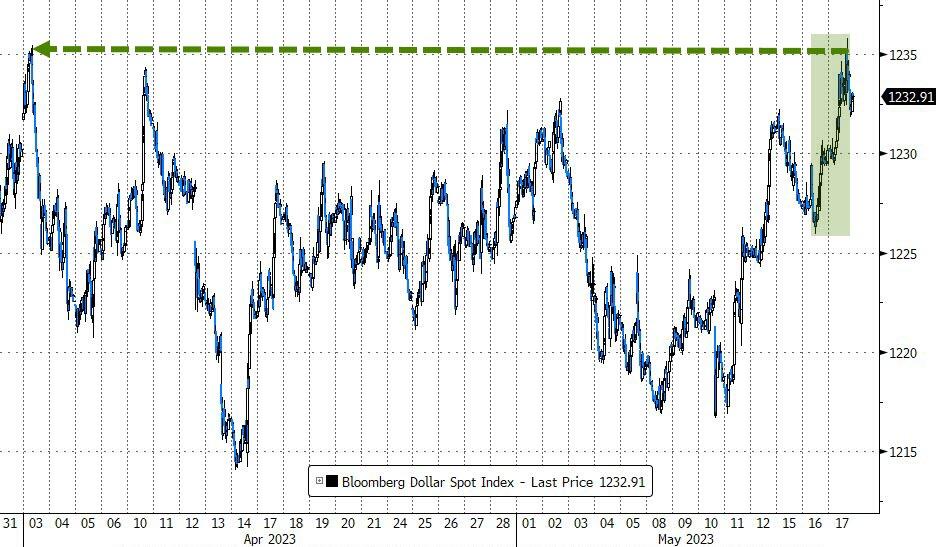
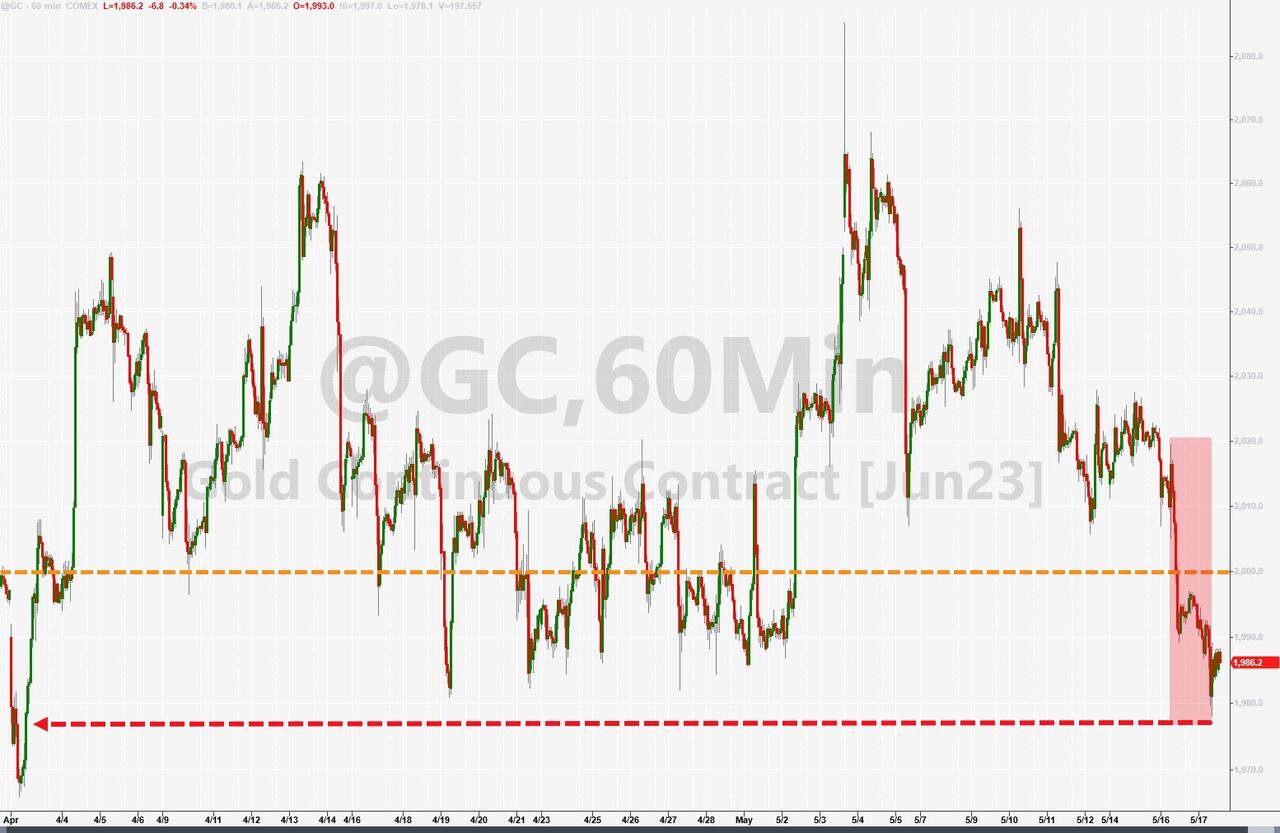
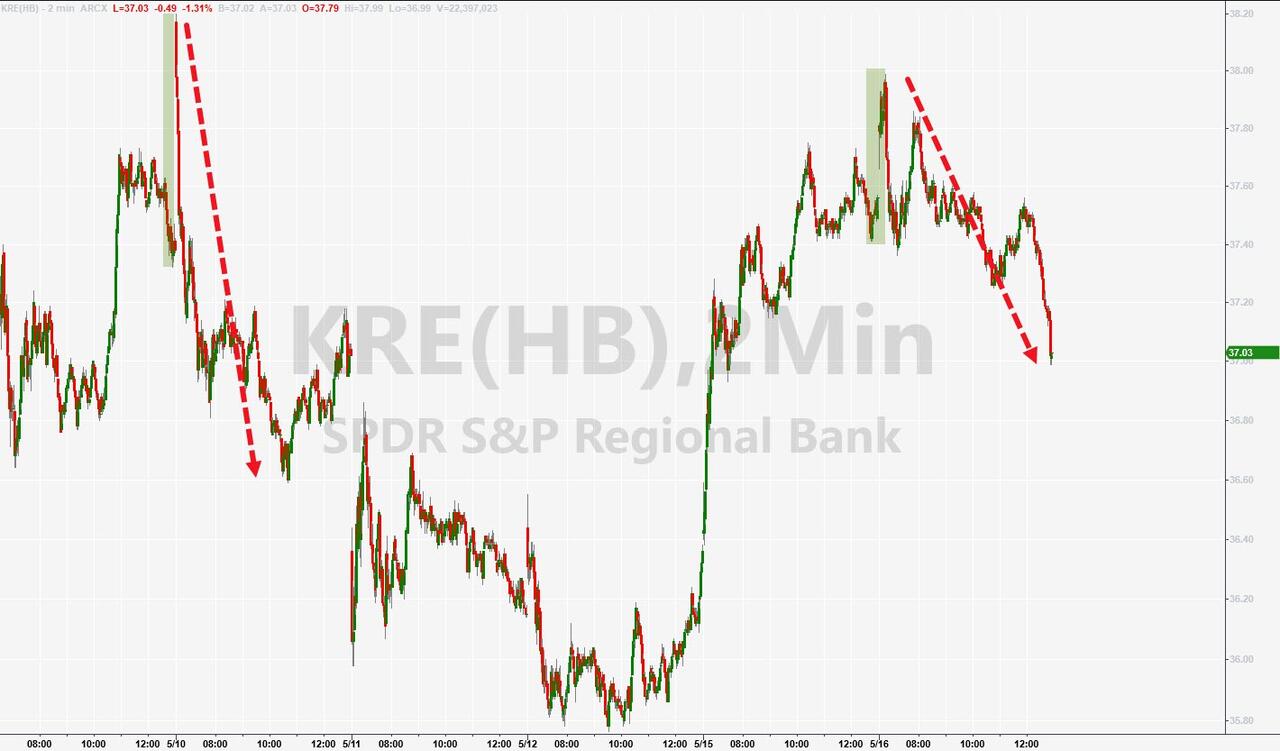
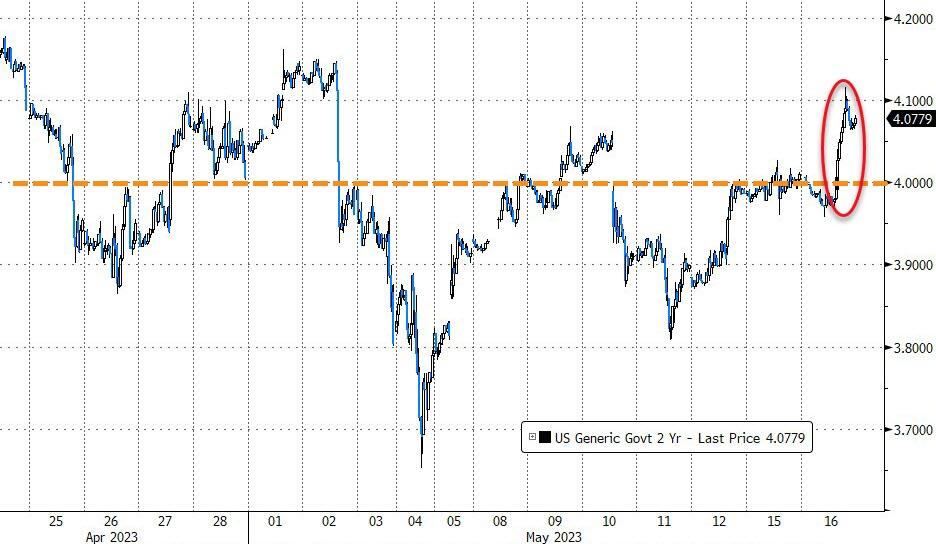
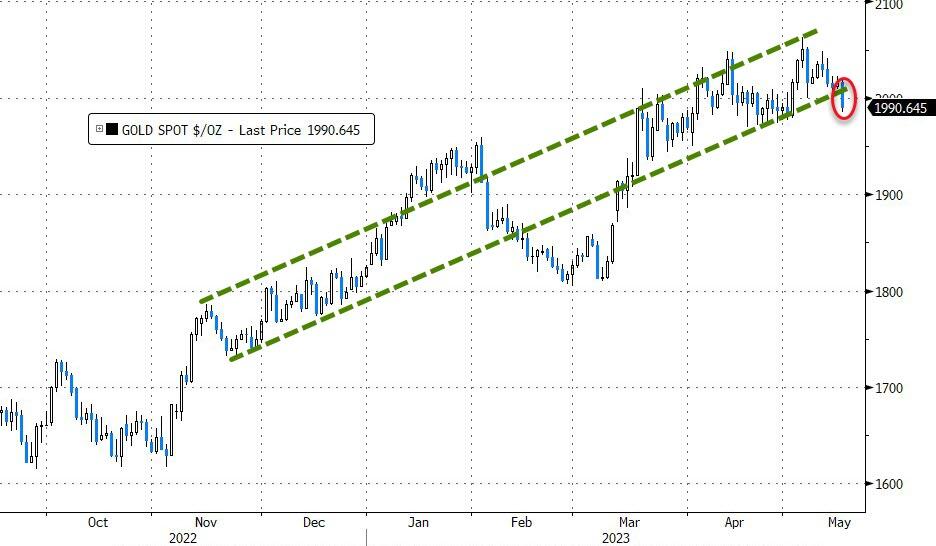
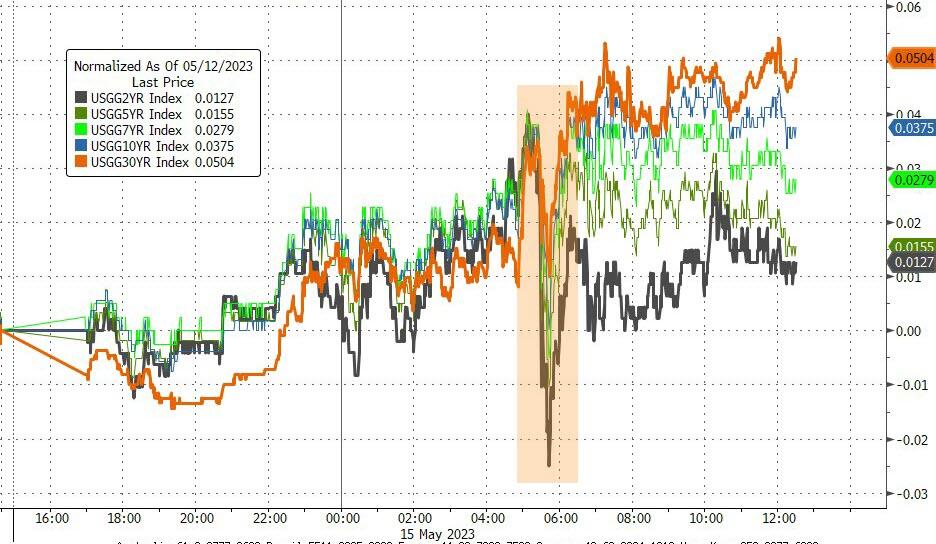
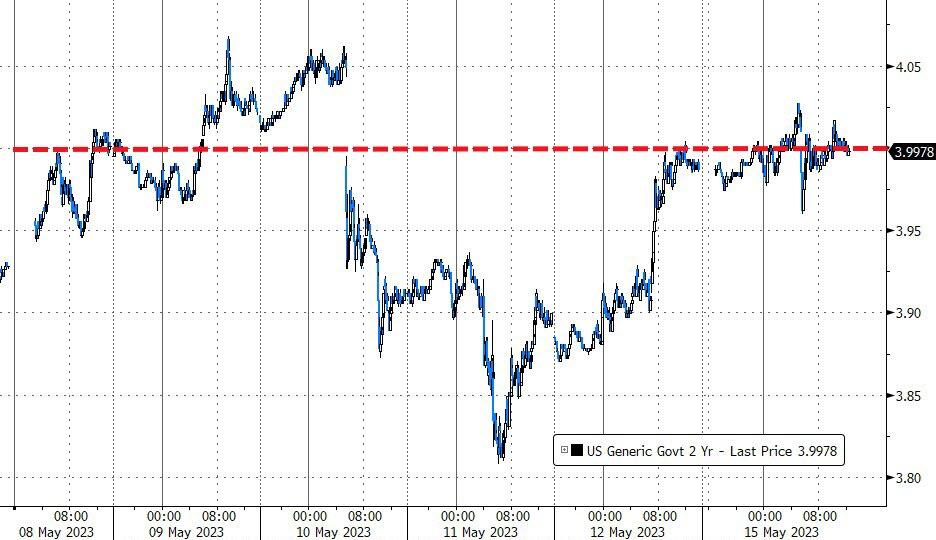
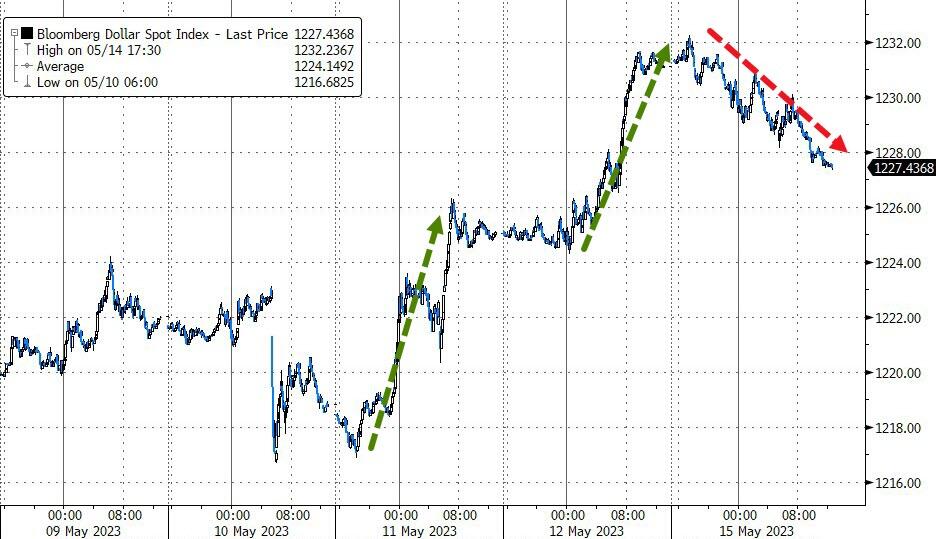
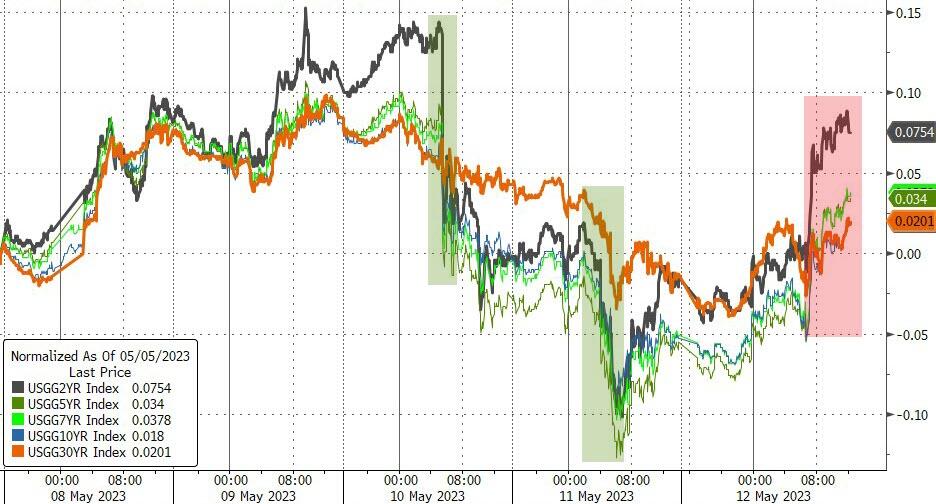
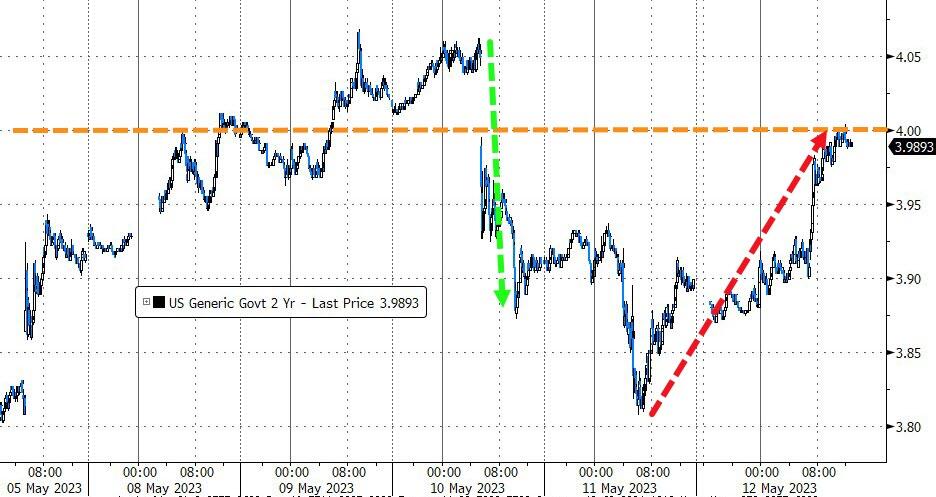
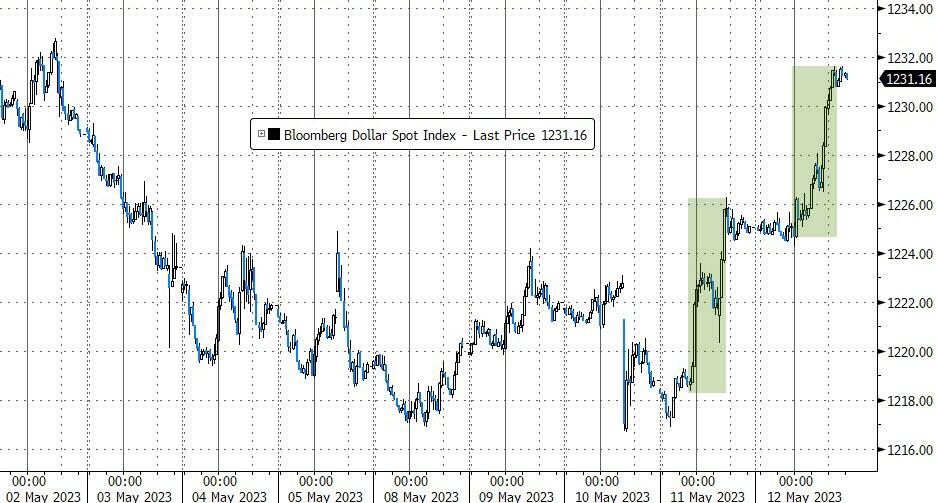
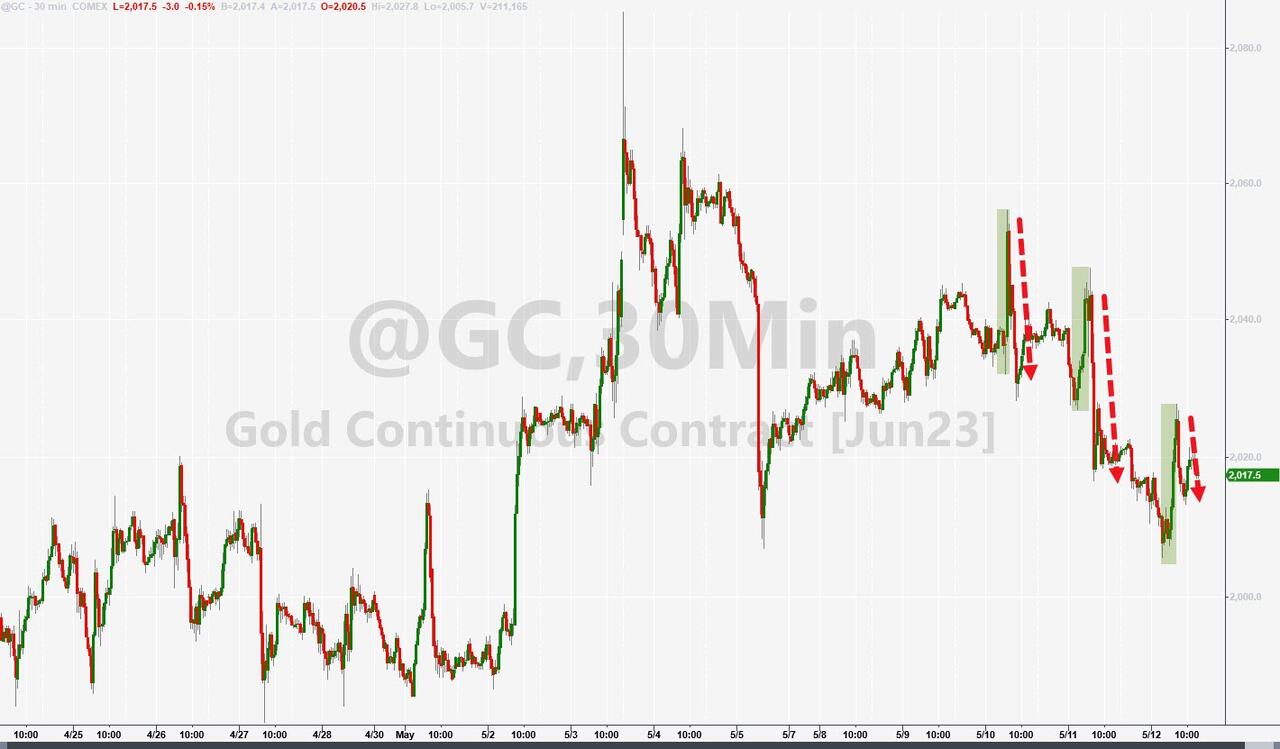
Regional banks joined in today’s rally with KRE hitting a resistance level. Bond yields dipped at first but then surged higher with the 2-year leaving the 4% level behind. With higher yields, the US Dollar climbed, but Gold retreated and remains stuck below its $2k level.
Adding to the economic slowdown are the banks, which are stingy with consumer loans, which in turn crimps consumer spending.
Home Depot’s dismal revenue report and bleak outlook sent the markets tumbling in the morning. The company blamed everything from bad weather to weak lumber prices to stingy consumers for its worst miss in two decades. The stock lost 5% of its value before clawing back some ground.
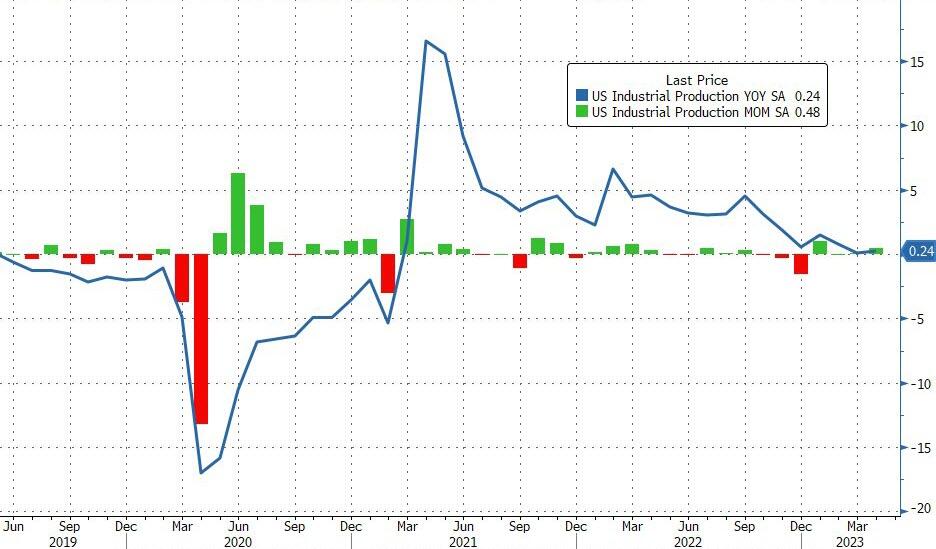
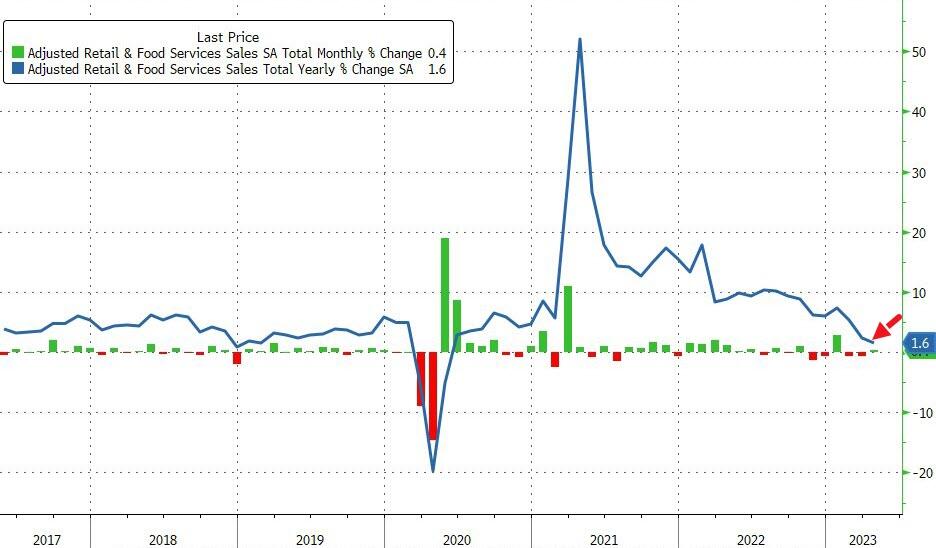
Meanwhile, some mixed signals from the economy added to the confusion. Industrial Production rose by 0.5% in April, beating expectations, but still showing no growth from a year ago. Retail Sales also fell short of the mark, posting their slowest annual increase since the pandemic hit.
And then there’s the looming debt ceiling crisis, which could spell disaster if not resolved soon. Yellen warned last week that failing to raise the limit could trigger an “economic catastrophe” that would hurt confidence, raise costs, and damage the US credit rating.
But neither Biden nor McCarthy seem eager to play nice and reach a deal. They are stuck in a stalemate that resembles previous showdowns; except this time, both parties are too stubborn to budge an inch.
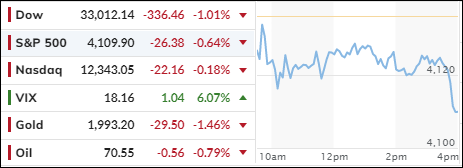
The market didn’t bounce back as expected in the afternoon, and we ended the day with the Nasdaq doing the best and the DJIA doing the worst.
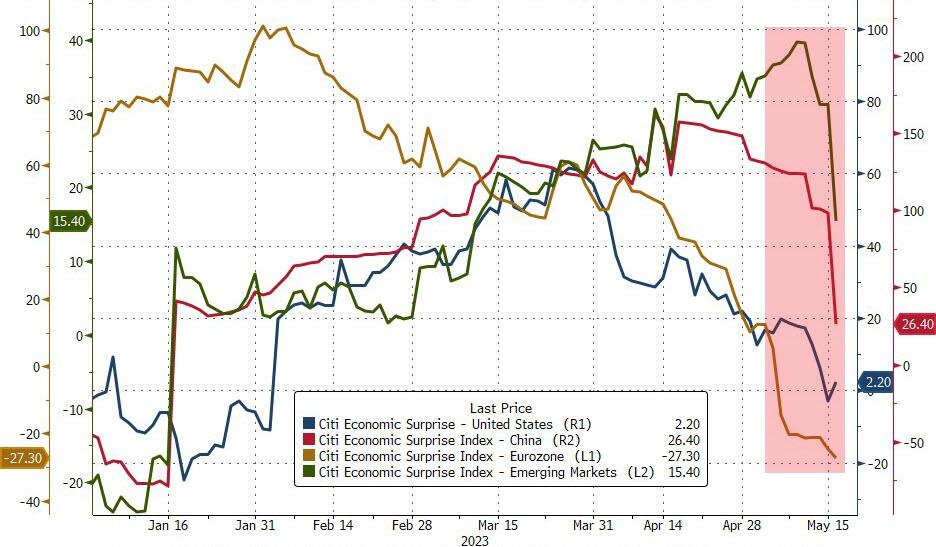
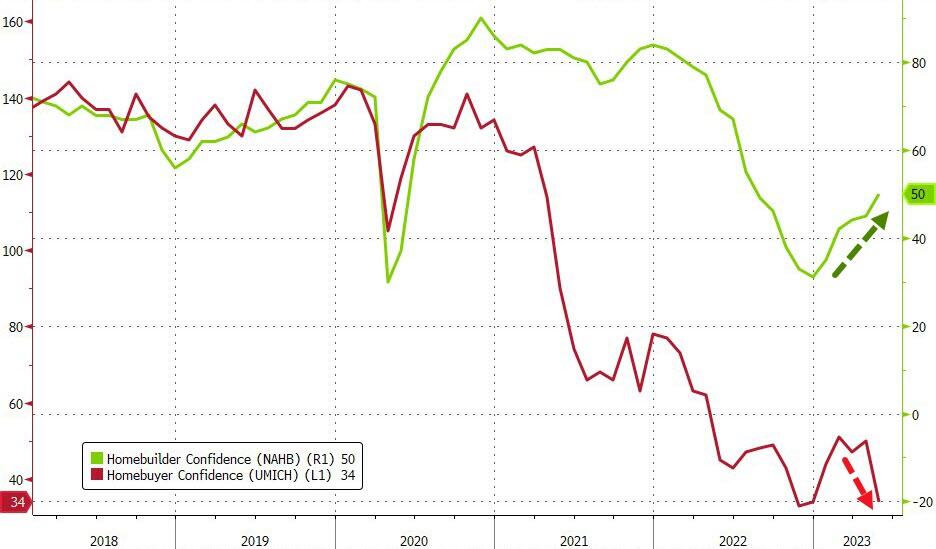
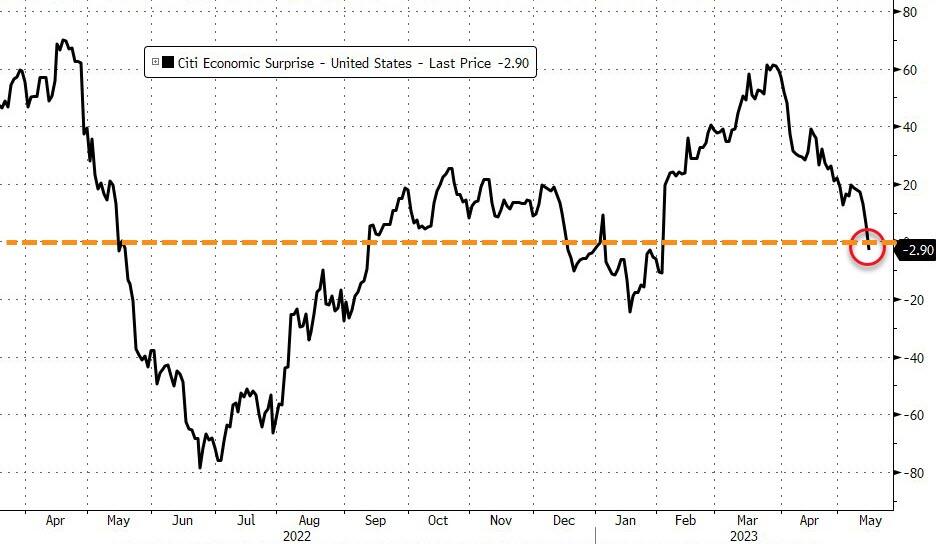
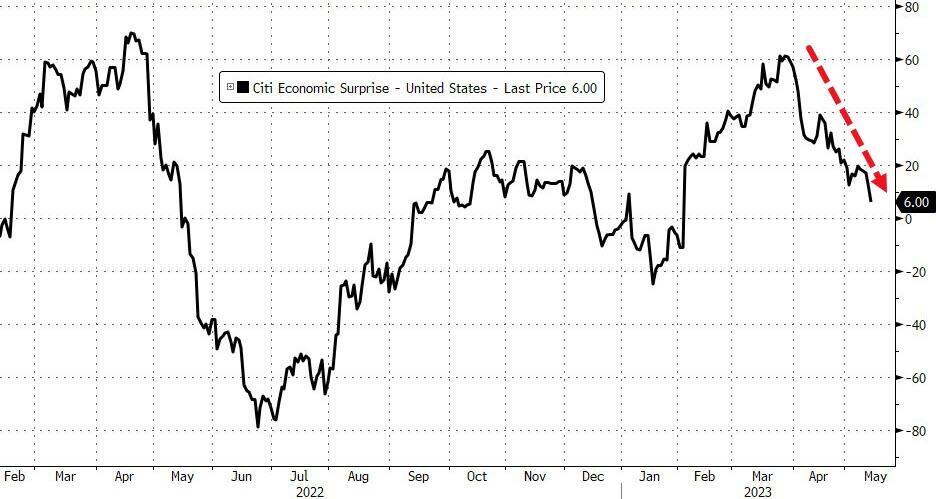
The mixed economic data and the debt ceiling drama dampened the bullish mood from yesterday, with all four global economic surprise indexes dropping together. It’s funny how US Homebuilders are optimistic, while Homebuyers are pessimistic. I wonder who will have the last laugh.
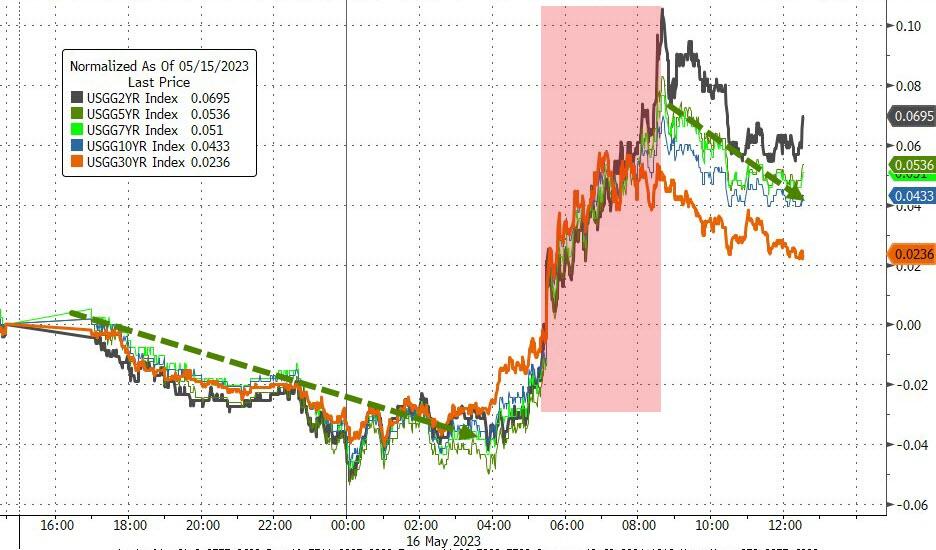
The regional banking sector had a brief short squeeze in the morning, but it didn’t last long and the KRE index turned around and plunged. US Bond yields jumped across the board, with the 2-year staying above 4%.
The higher rates helped the dollar bounce back, but gold took a hit and fell below $2k again.
This makes me wonder: Are the falling economic surprise indexes a hint that the Fed might tighten its policy sooner than later?
Last week’s moderate loss in the major indexes represented the S&P 500’s first two-week losing streak since February, with the overwhelming uncertainty being created by the ongoing debt ceiling negotiations.
We’re stuck in no man’s land waiting for decisions to be made, so markets can gain some traction and stop treading water. In the absence of any progress, it will be more difficult for the indexes to advance, in which case the path of least resistance will likely be to the downside.
The constant threat that looms over the markets, namely failure to reach a debt ceiling agreement, which could produce financial chaos, is promoted almost daily by Treasury Secretary Yellen with the deadline being June 1. Although she softened her rhetoric over the weekend by hinting that the US would avoid a default.
After an early drop, the major indexes rebounded to recapture their respective unchanged lines, thanks to a timely short squeeze, with all three of them eking out modest gains, while continuing to be stuck in a broad range. In the meantime, the economy, as represented by the Macro Surprise index, extended its 7-week slide.
In terms of what well-known mouthpieces uttered, ZeroHedge summed it up like this:
Biden said he will meet Congressional leaders tomorrow (Tuesday) to discuss the debt ceiling and that seemed to send stocks higher around 1300ET (even though there was nothing new in that comment at all).1325ET SEC’s Gensler said that there was no short-selling ban currently being weighed for US stocks (and rightly so because the last time they did that it triggered a massive wave of long liquidations).
1400ET Fed’s Bostic reconfirmed his ‘high for longer’ hawkish attitude by noting that he would probably vote to hold rates for now (but does not see cuts any time soon).
1410ET McCarthy warned that debt talks “nowhere near reaching a conclusion.”
Regional banks, as represented by their KRE index, rallied for no reason other than that we had a quiet weekend with none of them blowing up. The fact that Friday’s deposit data showed even more outflows, should have caused a bearish reaction. Go figure…
Bond yields rose moderately, as the 2-year successfully defended its 4% level. The US Dollar drifted lower, while Gold found some modest upward momentum.
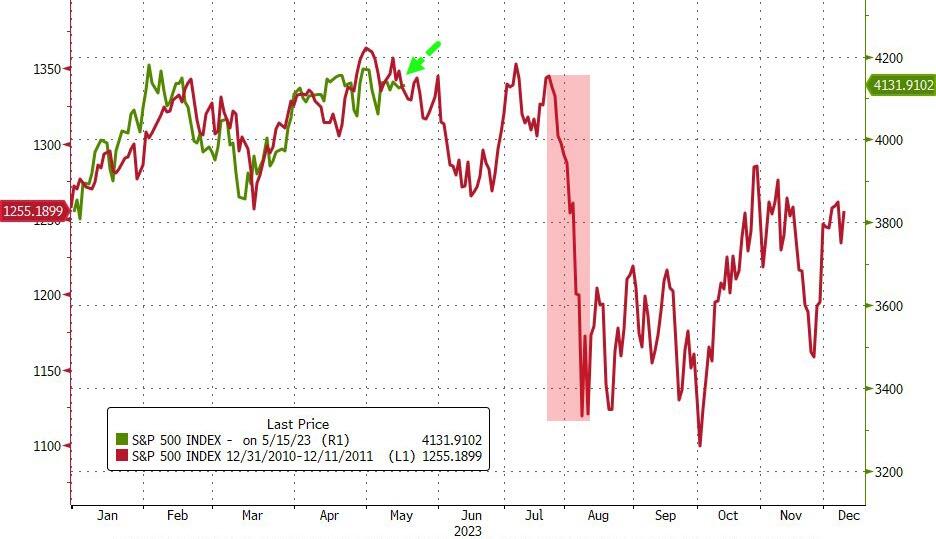
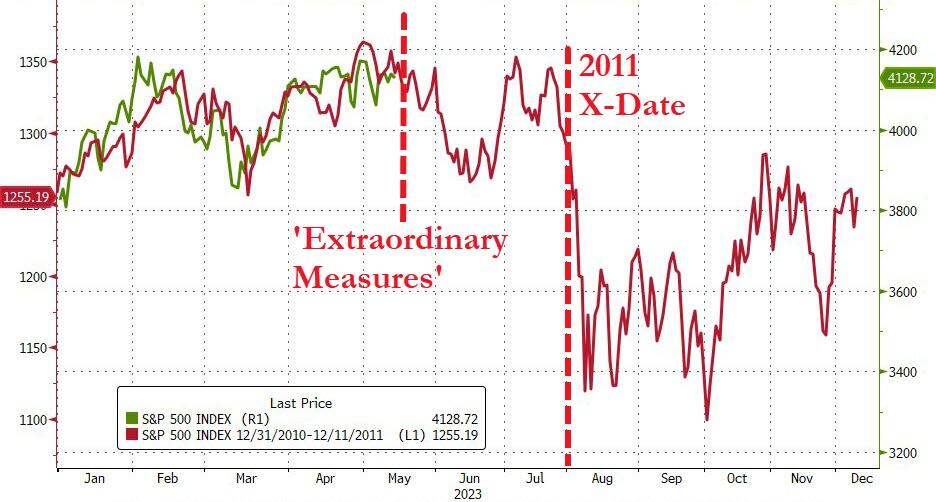
The comparison to the S&P’s developments of 2010 are still on, but for how long is the question?
Below, you can evaluate the latest High-Volume ETF Cutline report, which shows how far above or below their respective long-term trend lines (39-week SMA) my currently tracked ETFs are positioned.
This report covers the HV ETF Master List from Thursday’s StatSheet and includes 312 High Volume ETFs, defined as those with an average daily volume of more than $5 million, of which currently 180 (last report: 202) are hovering in bullish territory. The yellow line separates those ETFs that are positioned above their trend line (%M/A) from those that have dropped below it.
In case you are not familiar with some of the terminology used in the reports, please read the Glossary of Terms. If you missed the original post about the Cutline approach, you can read it here.
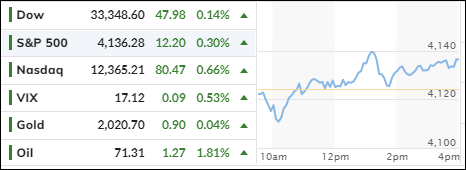
Traders were still trying to digest the double punch in the form of the struggling economy and the ongoing uncertainties in the banking sector. Neither provided any motivation to hold on to equities, so south we went.
However, as we have seen repeatedly, a slow afternoon climb pulled the major indexes out of the doldrums and back towards their unchanged lines. Initial losses were reduced, but we still closed in the red, not only for the day but also for the week.
Treading water and looking for direction best describes the past 5 trading days, during which the S&P 500 lost a moderate 1%. Traders were also concerned about the ongoing debt ceiling debacle, the latest meeting of which has been postponed till next week.
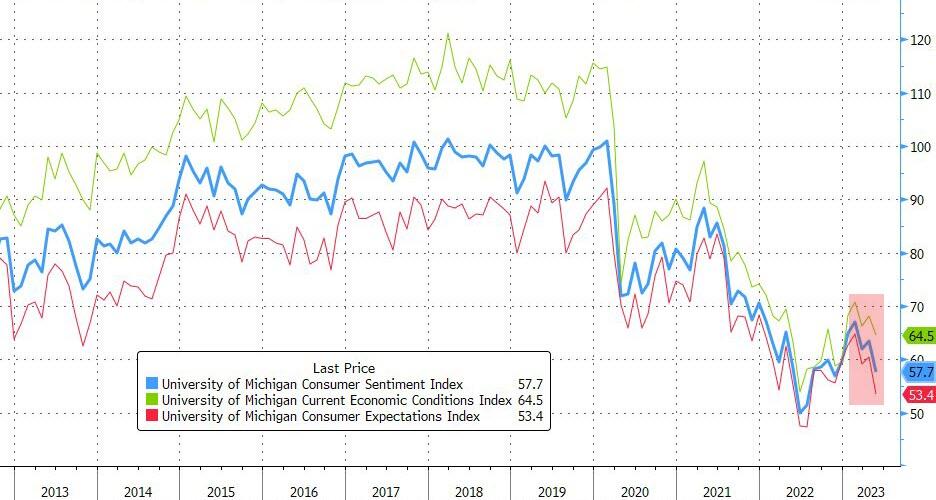
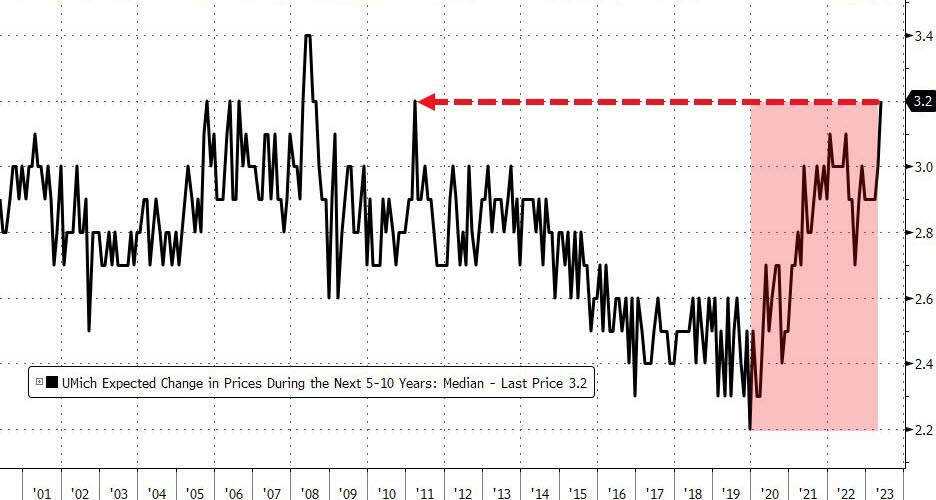
Consumer sentiment fell to a 6-month low to 57.7 from last month’s 63.5 reading, while inflation expectations dipped a tad but jumped to 3.2 when viewed over the next 5-10 years.
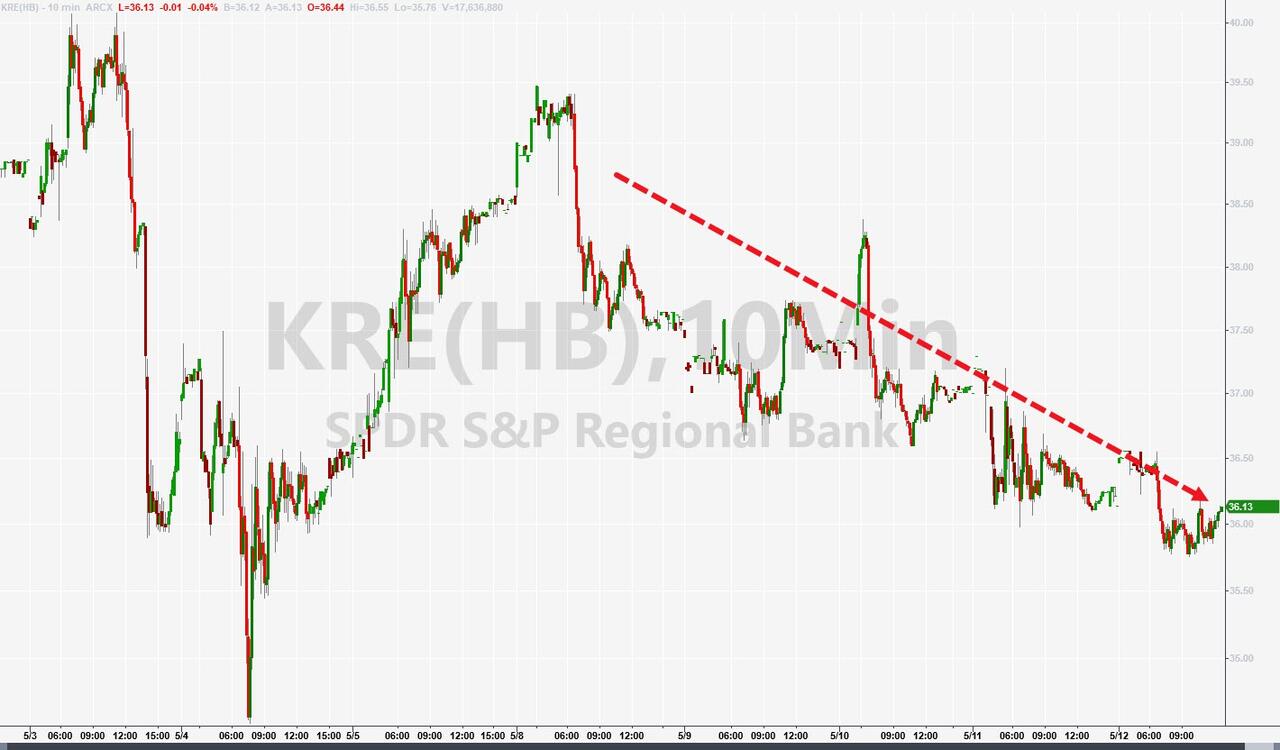
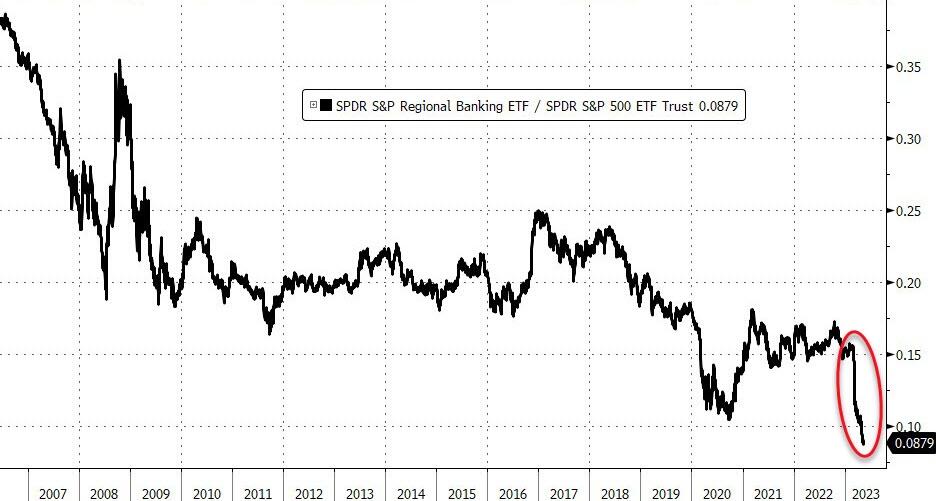
Meanwhile, in the banking world, we learned that PacWest fell another 2.9%, which is far more moderate than its recent drops. The regional banking index KRE held up well today but is stuck in a long-term downtrend, with regional bank stocks historically never having reached a lower point.
After two days of sinking bond yields, the pendulum swung the other way with the 2-year reaching its 4% level again. The US Dollar ripped higher and had its best weekly showing in 3 months. That took its toll on Gold, as the precious metal cranked and tanked and ratcheted lower for the week.
With the debt ceiling debacle on deck, ZeroHedge noticed some correlation to the events in 2011. This chart shows the current relationship between 2023 and 2011. We will have to wait and see if this comparison holds, or if it’s truly different this time.