
ETF Tracker StatSheet
You can view the latest version here.
STRUGGLING FOR GUIDANCE
- Moving the markets
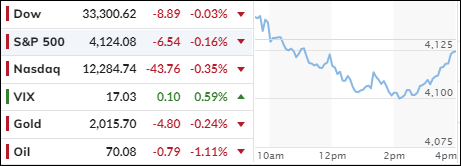
Traders were still trying to digest the double punch in the form of the struggling economy and the ongoing uncertainties in the banking sector. Neither provided any motivation to hold on to equities, so south we went.
However, as we have seen repeatedly, a slow afternoon climb pulled the major indexes out of the doldrums and back towards their unchanged lines. Initial losses were reduced, but we still closed in the red, not only for the day but also for the week.
Treading water and looking for direction best describes the past 5 trading days, during which the S&P 500 lost a moderate 1%. Traders were also concerned about the ongoing debt ceiling debacle, the latest meeting of which has been postponed till next week.
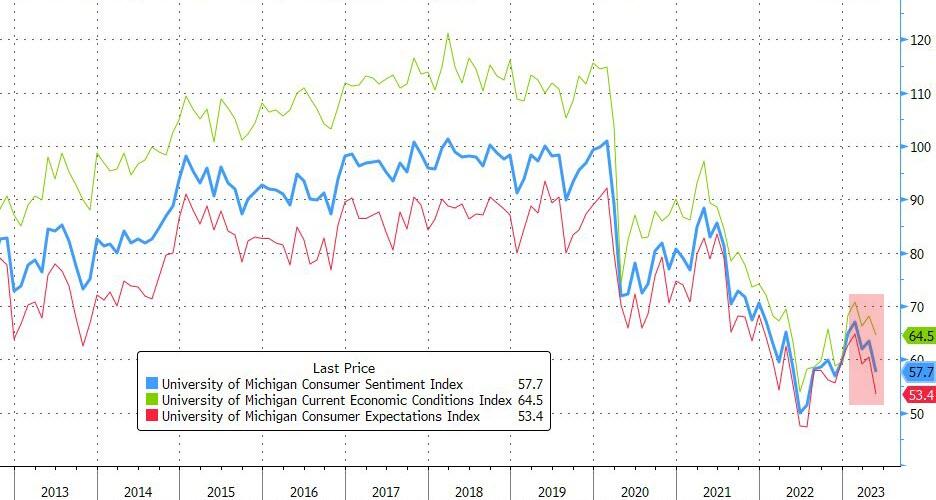
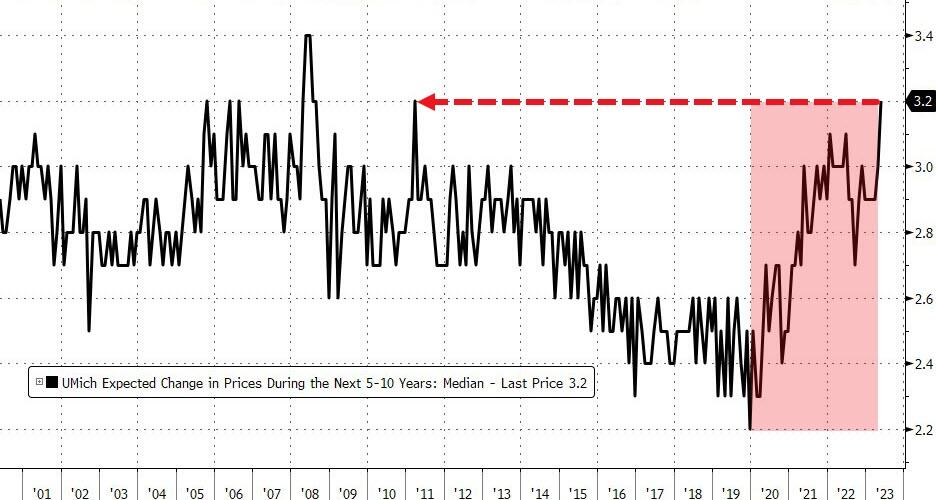
Consumer sentiment fell to a 6-month low to 57.7 from last month’s 63.5 reading, while inflation expectations dipped a tad but jumped to 3.2 when viewed over the next 5-10 years.
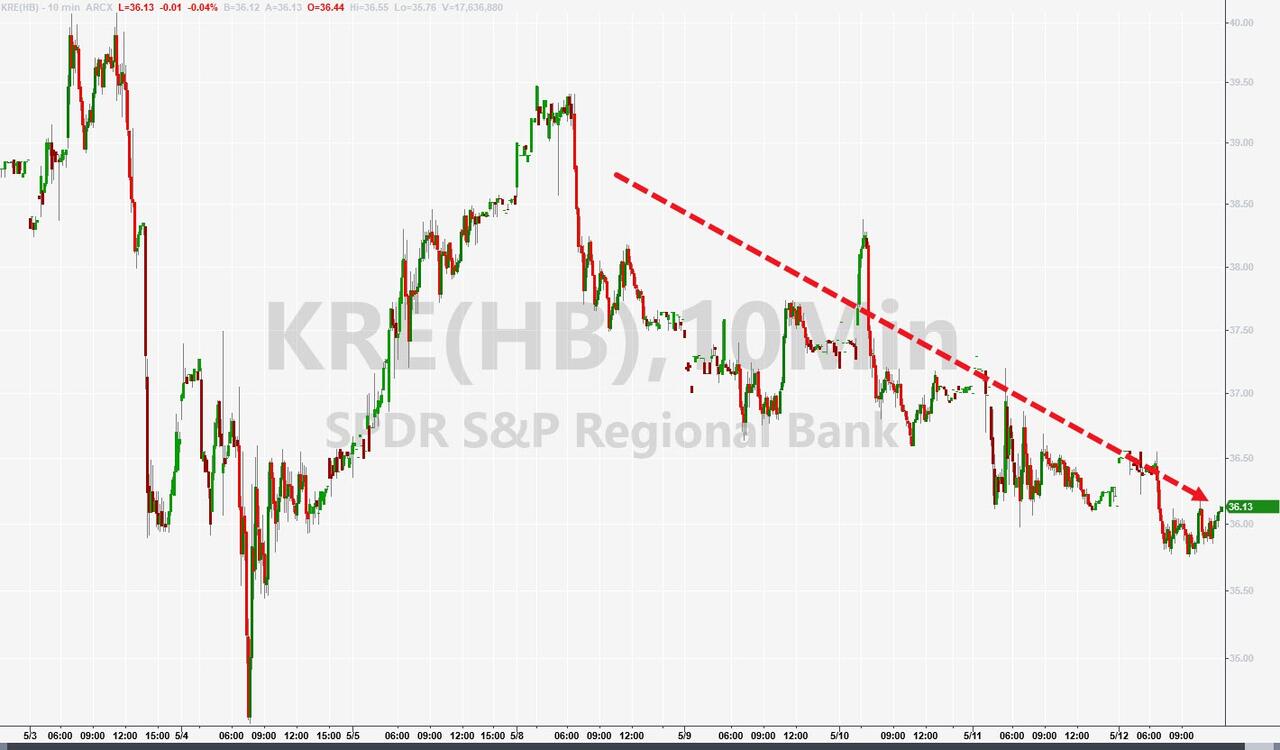
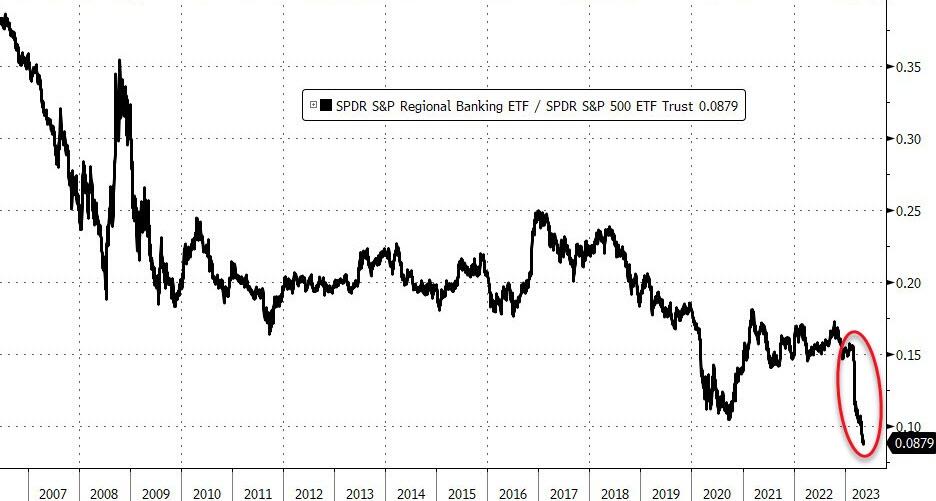
Meanwhile, in the banking world, we learned that PacWest fell another 2.9%, which is far more moderate than its recent drops. The regional banking index KRE held up well today but is stuck in a long-term downtrend, with regional bank stocks historically never having reached a lower point.
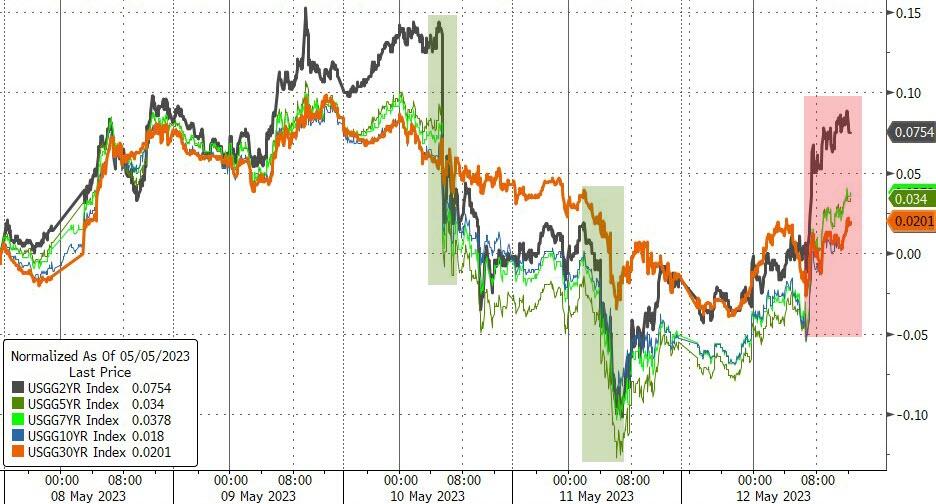
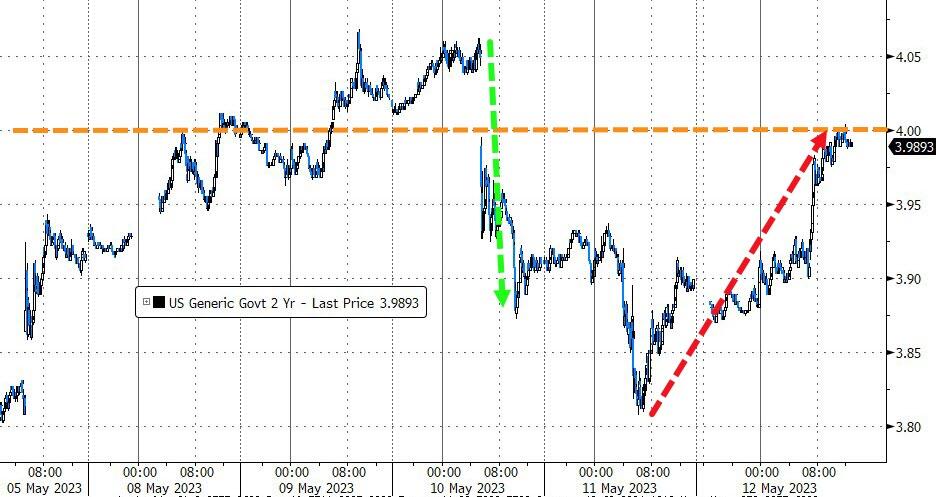
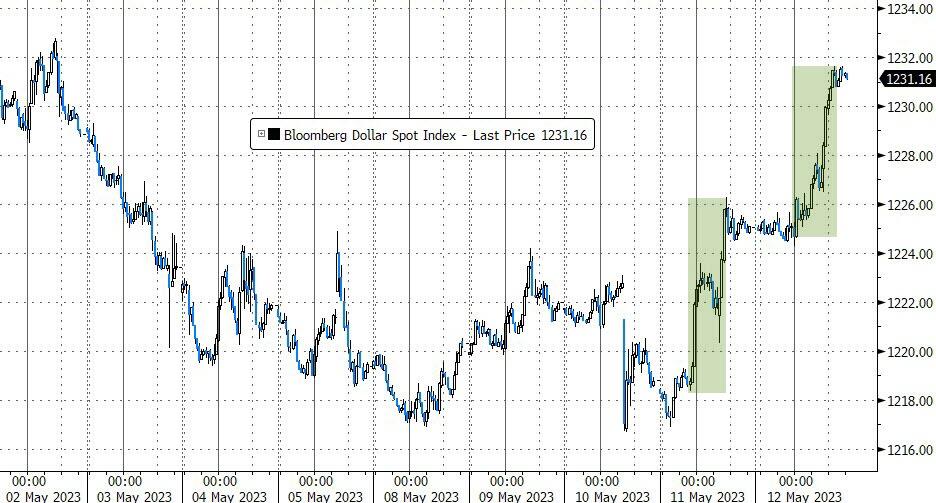
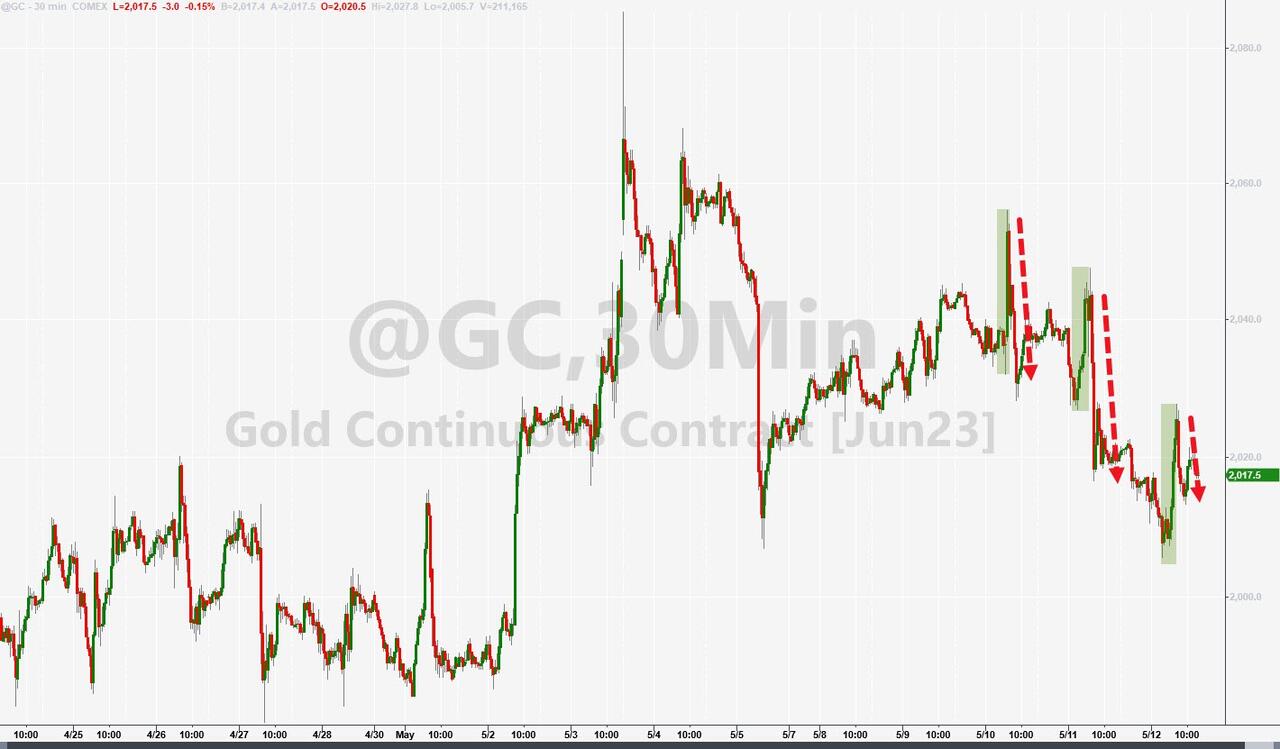
After two days of sinking bond yields, the pendulum swung the other way with the 2-year reaching its 4% level again. The US Dollar ripped higher and had its best weekly showing in 3 months. That took its toll on Gold, as the precious metal cranked and tanked and ratcheted lower for the week.
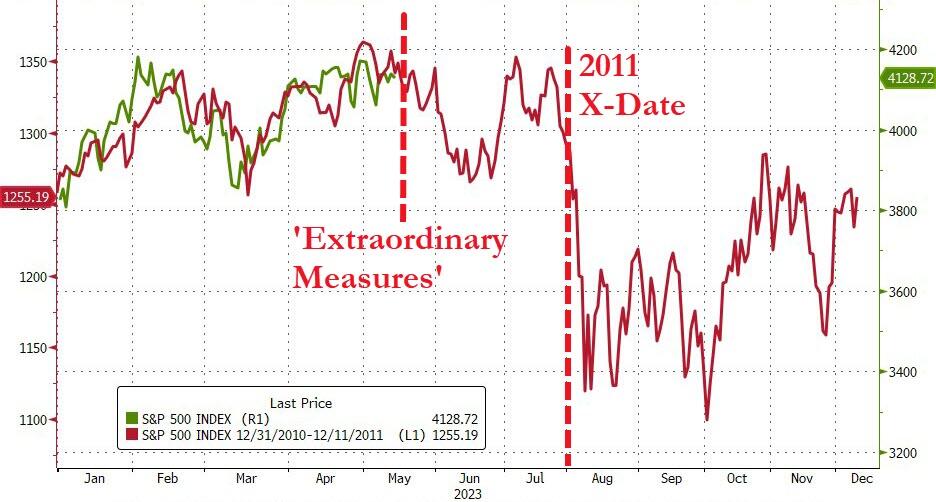
With the debt ceiling debacle on deck, ZeroHedge noticed some correlation to the events in 2011. This chart shows the current relationship between 2023 and 2011. We will have to wait and see if this comparison holds, or if it’s truly different this time.
2. “Buy” Cycle Suggestions
For the current Buy cycle, which started on 12/1/2022, I suggested you reference my then current StatSheet for ETF selections. However, if you came on board later, you may want to look at the most recent version, which is published and posted every Thursday at 6:30 pm PST.
I also recommend you consider your risk tolerance when making your selections by dropping down more towards the middle of the M-Index rankings, should you tend to be more risk adverse. Likewise, a partial initial exposure to the markets, say 33% to start with, will reduce your risk in case of a sudden directional turnaround.
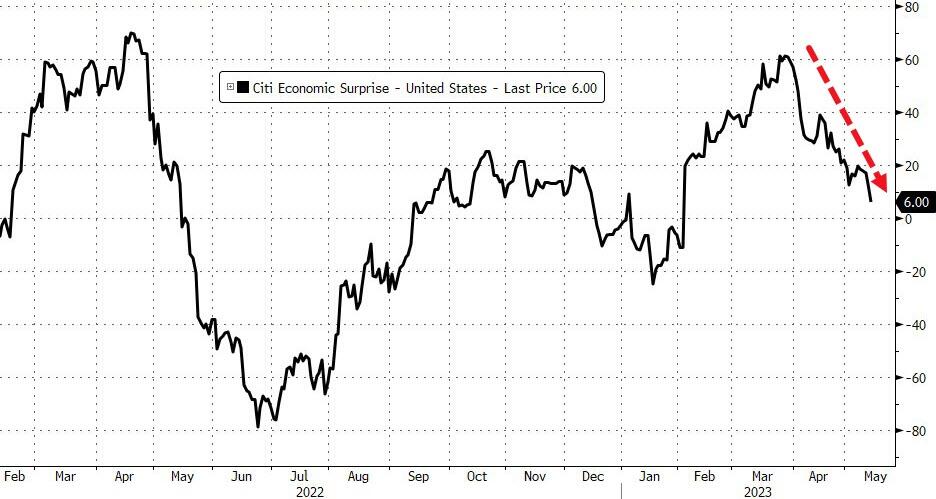
We are living in times of great uncertainty, with economic fundamentals steadily deteriorating, which will eventually affect earnings negatively and, by association, stock prices.
In my advisor’s practice, we are therefore looking for limited exposure in value, some growth and dividend ETFs. Of course, gold has been a core holding for a long time.
With all investments, I recommend the use of a trailing sell stop in the range of 8-12% to limit your downside risk.
3. Trend Tracking Indexes (TTIs)
The Domestic TTI improved a tad yet remains stuck slightly below its trend line.
As a result, there are no changes to our investment positions.
This is how we closed 05/12/2023:
Domestic TTI: -0.24% below its M/A (prior close -0.39%)—Buy signal effective 12/1/2022.
International TTI: +4.96% above its M/A (prior close +5.43%)—Buy signal effective 12/1/2022.
All linked charts above are courtesy of Bloomberg via ZeroHedge.
———————————————————-
WOULD YOU LIKE TO HAVE YOUR INVESTMENTS PROFESSIONALLY MANAGED?
Do you have the time to follow our investment plans yourself? If you are a busy professional who would like to have his portfolio managed using our methodology, please contact me directly to get more details.
Contact Ulli