
- Moving the markets
Home Depot’s dismal revenue report and bleak outlook sent the markets tumbling in the morning. The company blamed everything from bad weather to weak lumber prices to stingy consumers for its worst miss in two decades. The stock lost 5% of its value before clawing back some ground.
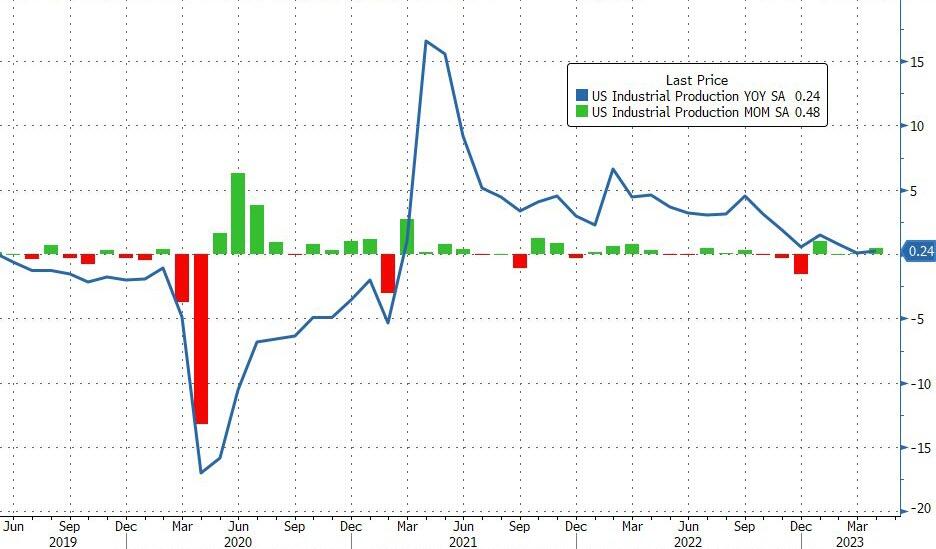
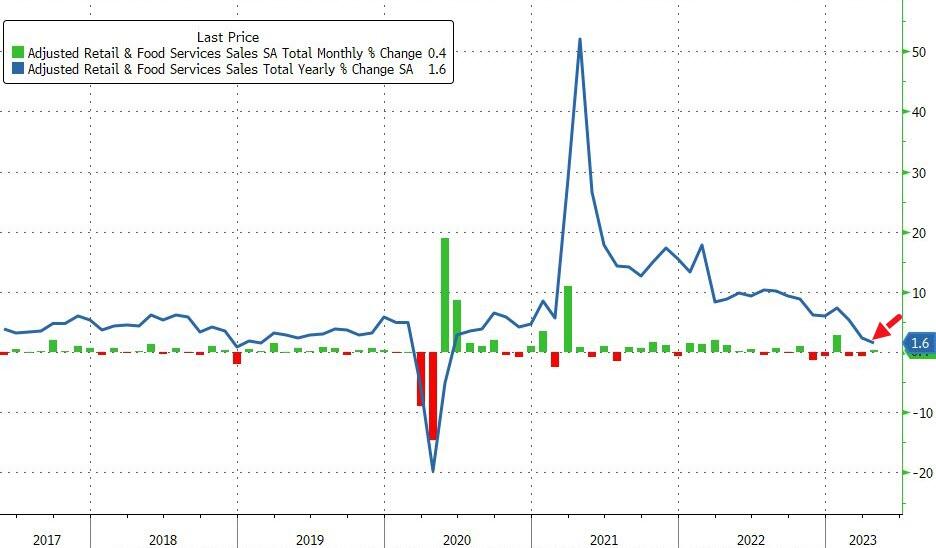
Meanwhile, some mixed signals from the economy added to the confusion. Industrial Production rose by 0.5% in April, beating expectations, but still showing no growth from a year ago. Retail Sales also fell short of the mark, posting their slowest annual increase since the pandemic hit.
And then there’s the looming debt ceiling crisis, which could spell disaster if not resolved soon. Yellen warned last week that failing to raise the limit could trigger an “economic catastrophe” that would hurt confidence, raise costs, and damage the US credit rating.
But neither Biden nor McCarthy seem eager to play nice and reach a deal. They are stuck in a stalemate that resembles previous showdowns; except this time, both parties are too stubborn to budge an inch.
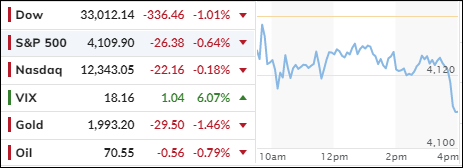
The market didn’t bounce back as expected in the afternoon, and we ended the day with the Nasdaq doing the best and the DJIA doing the worst.
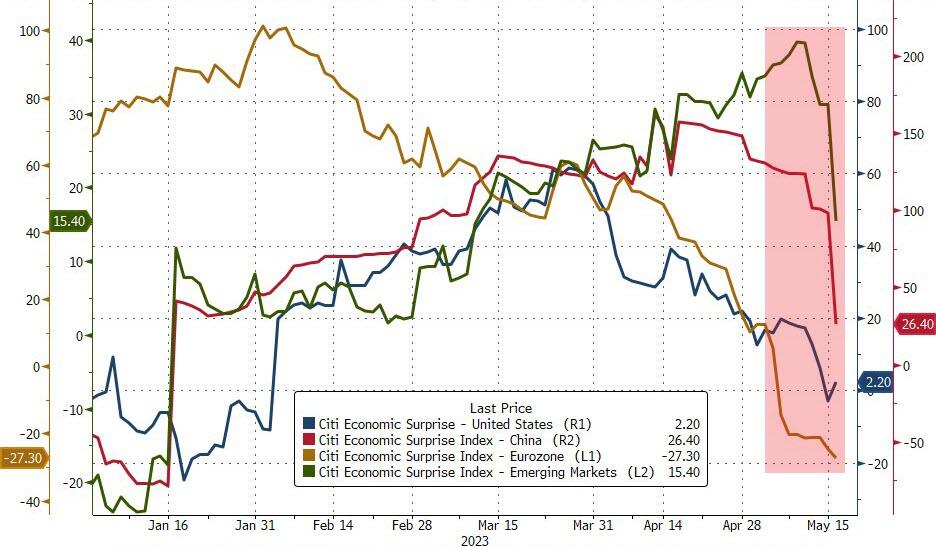
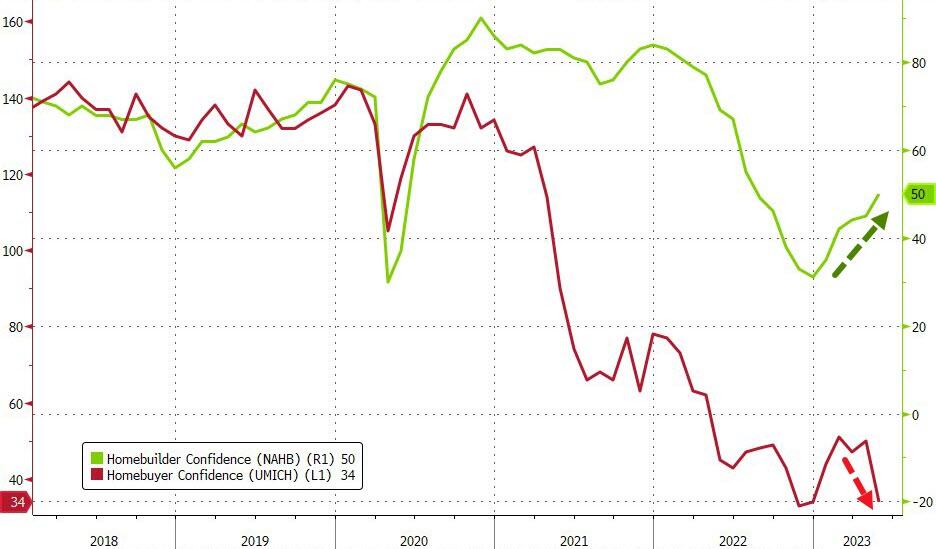
The mixed economic data and the debt ceiling drama dampened the bullish mood from yesterday, with all four global economic surprise indexes dropping together. It’s funny how US Homebuilders are optimistic, while Homebuyers are pessimistic. I wonder who will have the last laugh.
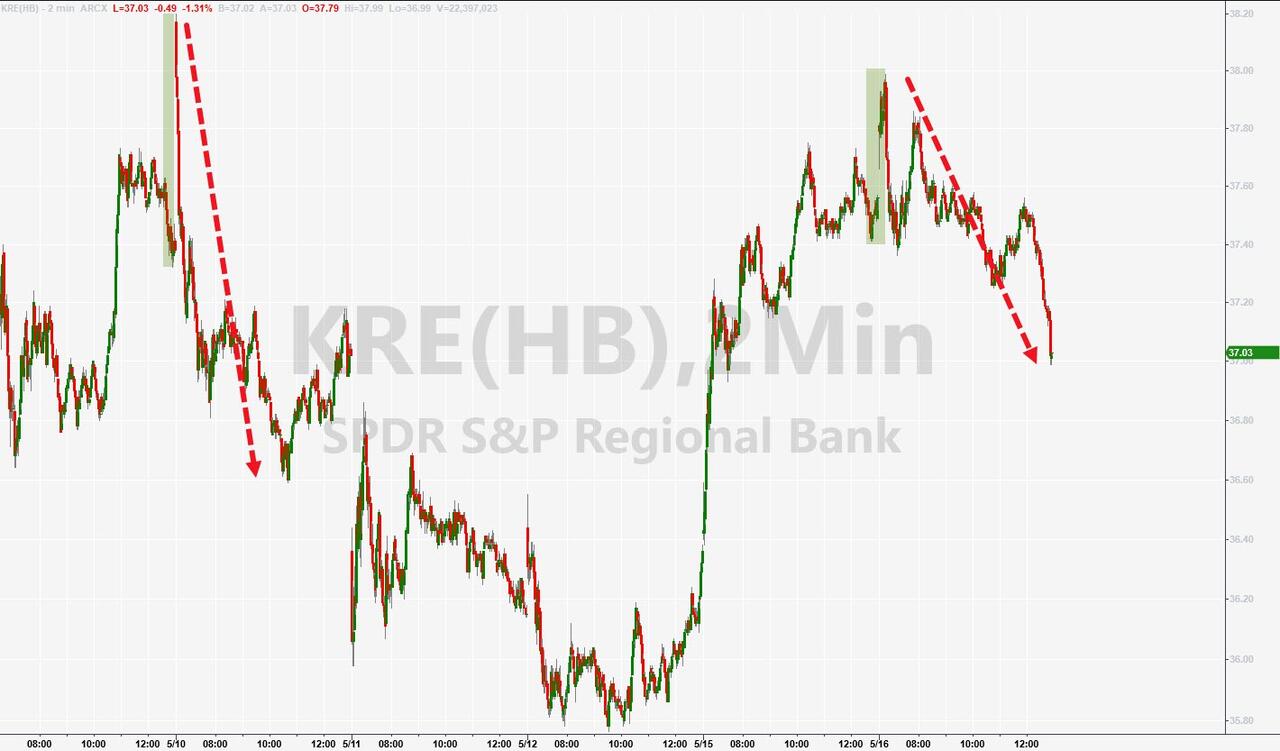
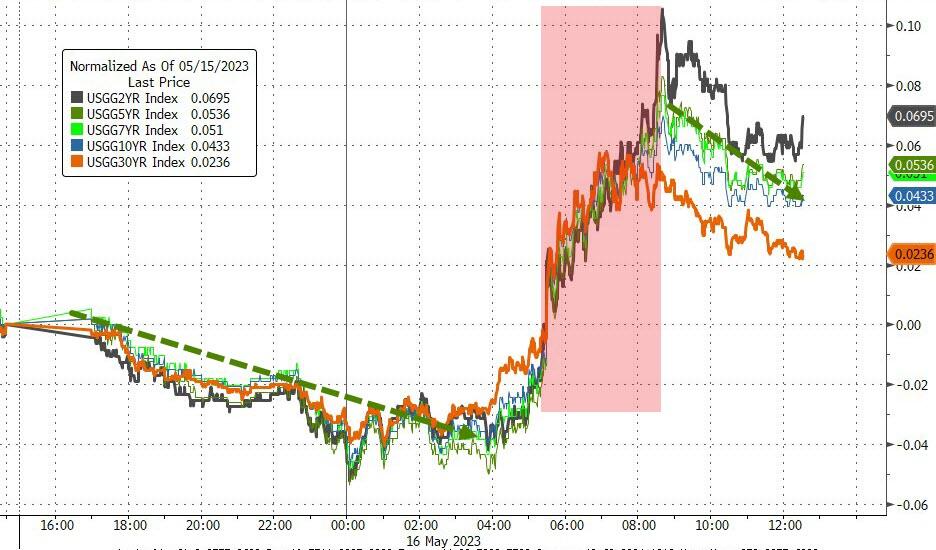
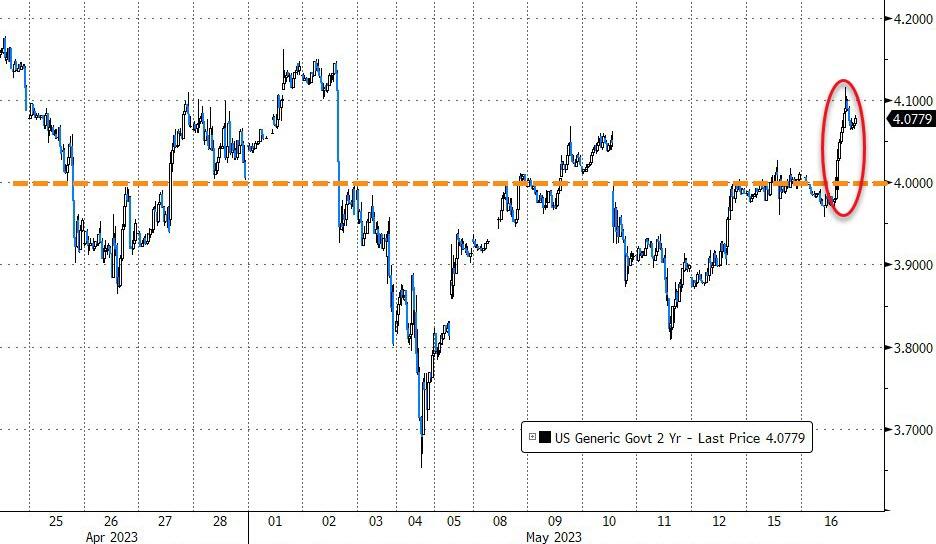
The regional banking sector had a brief short squeeze in the morning, but it didn’t last long and the KRE index turned around and plunged. US Bond yields jumped across the board, with the 2-year staying above 4%.
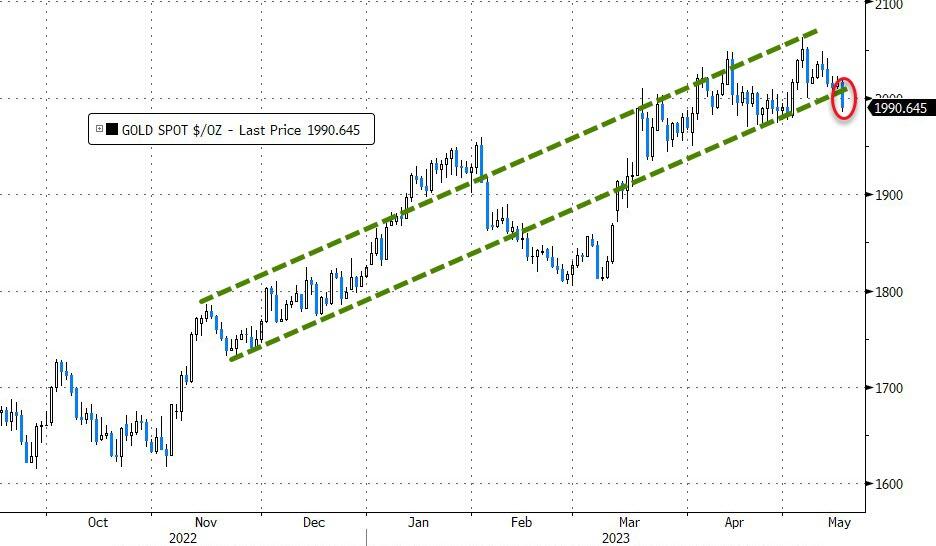
The higher rates helped the dollar bounce back, but gold took a hit and fell below $2k again.
This makes me wonder: Are the falling economic surprise indexes a hint that the Fed might tighten its policy sooner than later?
2. “Buy” Cycle Suggestions
For the current Buy cycle, which started on 12/1/2022, I suggested you reference my then current StatSheet for ETF selections. However, if you came on board later, you may want to look at the most recent version, which is published and posted every Thursday at 6:30 pm PST.
I also recommend you consider your risk tolerance when making your selections by dropping down more towards the middle of the M-Index rankings, should you tend to be more risk adverse. Likewise, a partial initial exposure to the markets, say 33% to start with, will reduce your risk in case of a sudden directional turnaround.
We are living in times of great uncertainty, with economic fundamentals steadily deteriorating, which will eventually affect earnings negatively and, by association, stock prices.
In my advisor’s practice, we are therefore looking for limited exposure in value, some growth and dividend ETFs. Of course, gold has been a core holding for a long time.
With all investments, I recommend the use of a trailing sell stop in the range of 8-12% to limit your downside risk.
3. Trend Tracking Indexes (TTIs)
Weak data points and the debt ceiling debacle combined forces to push the markets down and with it our Domestic TTI, which now slipped again into bear market territory. A “Sell” signal will be generated once the index remains below the line and shows some duration and staying power.
This is how we closed 05/16/2023:
Domestic TTI: -1.09% below its M/A (prior close +0.32%)—Buy signal effective 12/1/2022.
International TTI: +4.98% above its M/A (prior close +5.61%)—Buy signal effective 12/1/2022.
All linked charts above are courtesy of Bloomberg via ZeroHedge.
Contact Ulli