
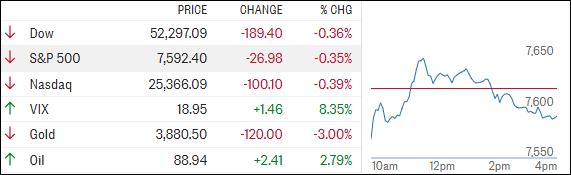
[Chart courtesy of MarketWatch.com]
- Moving the market
The markets got a cold splash of reality today. Nvidia’s stock dropped more than 5% after Jensen Huang stepped down and the company named CFO Colette Kress interim CEO.
Losing the guy who basically built the AI boom is about as close to a worst-case scenario as it gets—visionary leadership doesn’t just transfer with the org chart.
Some money rotated into AMD and Broadcom, but the broader AI trade still felt the pressure.
Oil popped higher after Trump’s blunt Truth Social note that the U.S. doesn’t need a deal with Iran.
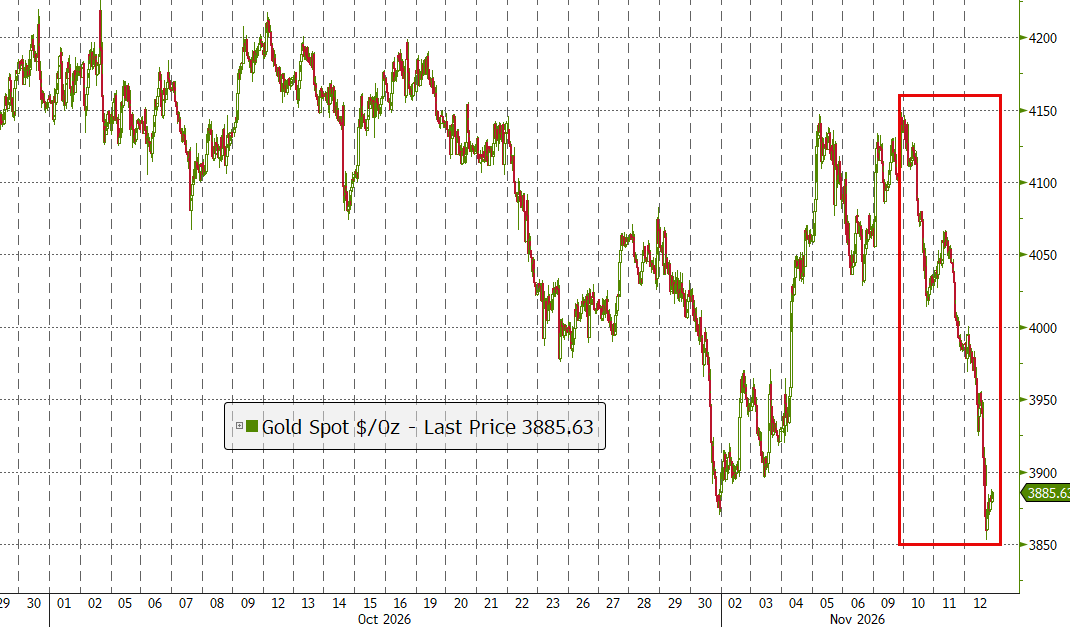
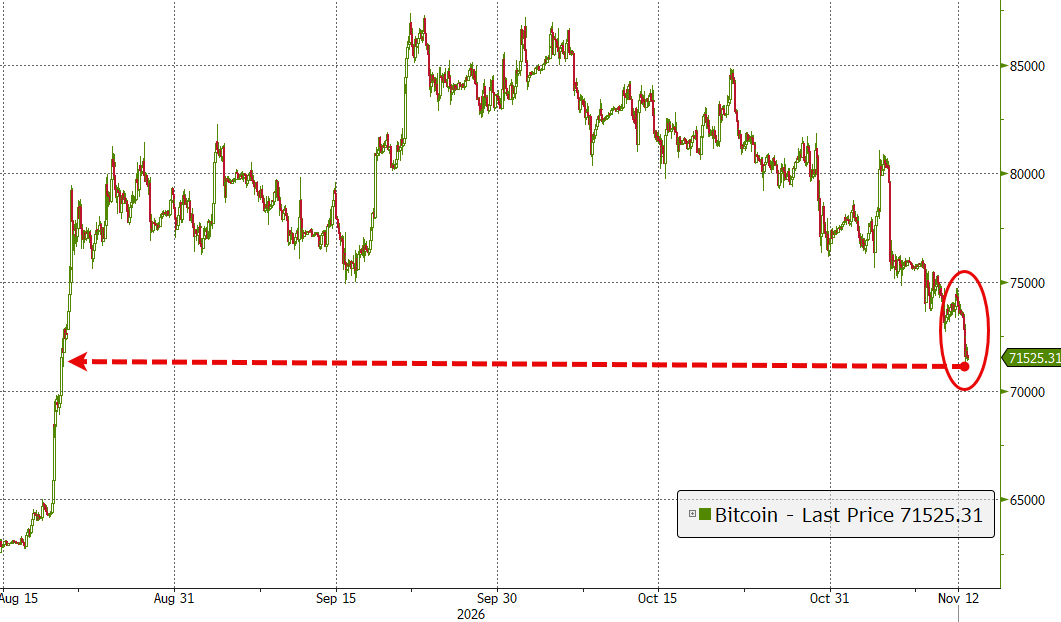
Meanwhile bond yields kept climbing, the 10-year back above 5%, the dollar punched out of its long range, and both gold and bitcoin took it on the chin.
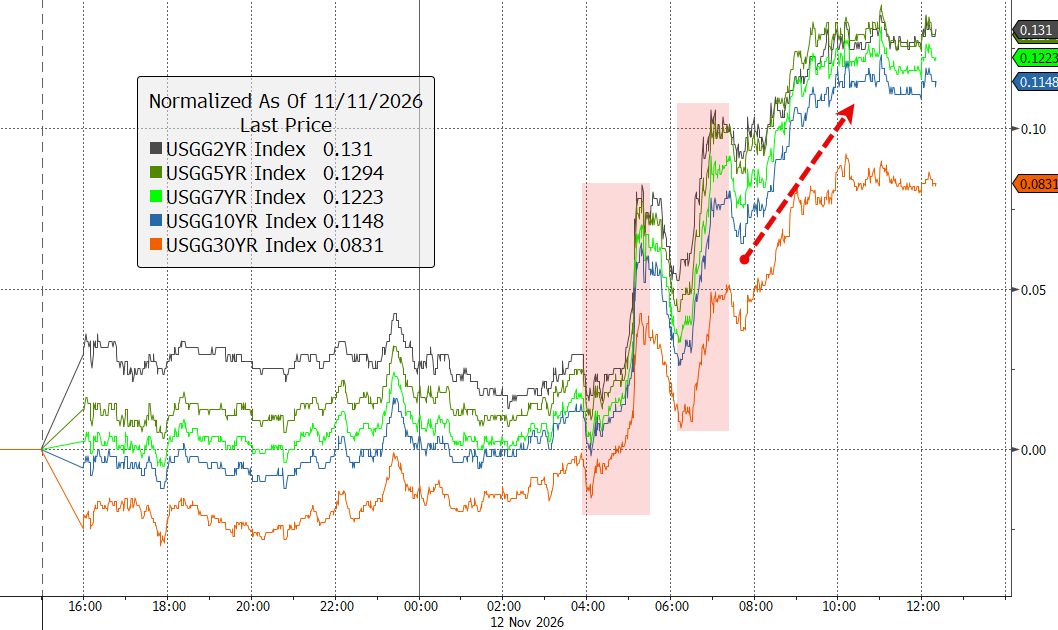
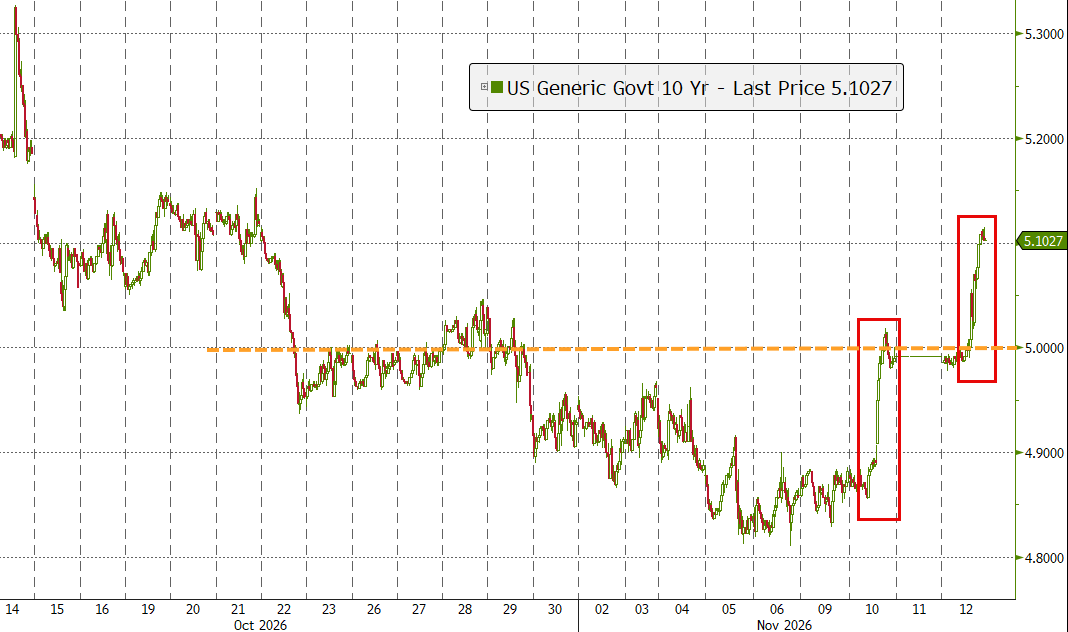
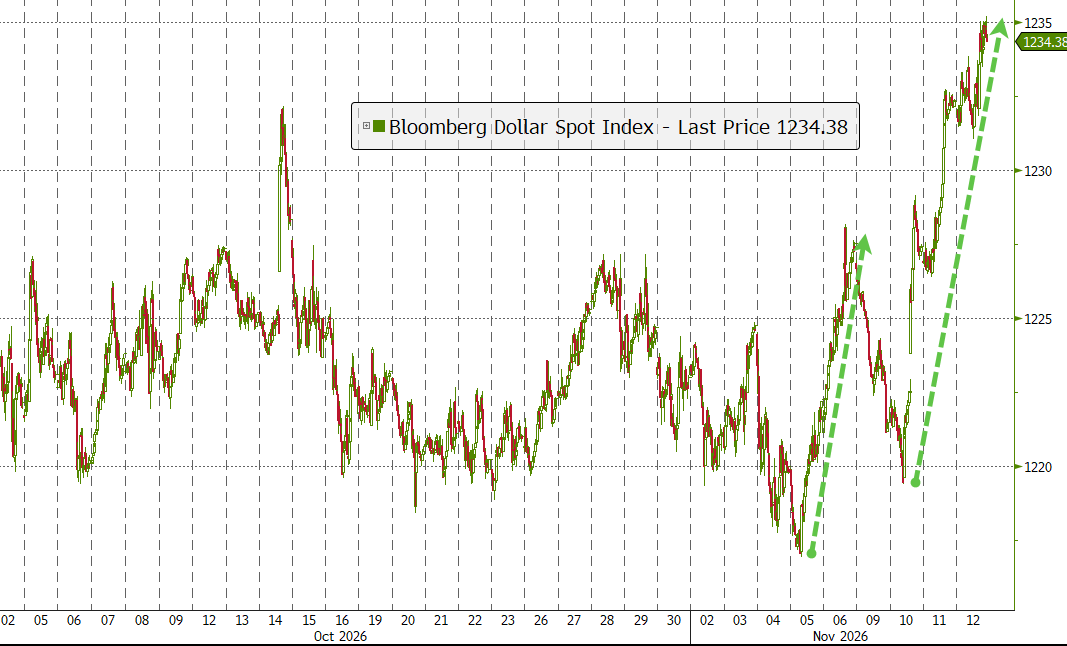
Existing-home sales hit their weakest level in over 16 years as mortgage rates refused to cooperate.
All of it left the major indexes in a modest retreat and traders looking for something—anything—that feels like a clear positive.
Anyone else starting to wonder how long this “uncertainty premium” sticks around?
2. Current domestic “Buy” Cycle (effective 5/20/2025); International “Buy” Cycle (effective 5/8/25)
Our domestic bullish cycle that began on November 21, 2023, concluded on April 3, 2025, following a market downturn triggered by President Trump’s tariff policy announcement.
This development caused significant declines across major indexes and broader market indices. However, markets subsequently rebounded, culminating in a new domestic “Buy” signal taking effect May 20, 2025.
Concurrently, our International Trend Tracking Index (TTI) experienced parallel volatility. On April 4, 2025, it breached critical thresholds, prompting a “Sell” recommendation. This position reversed as global markets recovered, with the International TTI regaining sufficient momentum to issue a new “Buy” signal effective May 8, 2025.
3. Trend Tracking Indexes (TTIs)
Markets looked a little confused today. Higher oil prices and rising bond yields teamed up with Nvidia’s latest hiccup to keep everyone guessing.
The major indexes slipped modestly, while the metals sector took a sharper hit as yields kept climbing.
Our TTIs drifted lower but are still holding comfortably above their trend lines in bullish territory—no panic, just a bit of chop.
This is how we closed 11/12/2026:
Domestic TTI: +6.34% above its M/A (prior close +7.23%)—Buy signal effective 5/20/25.
International TTI: +3.98% above its M/A (prior close +4.40%)—Buy signal effective 5/8/25.
All linked charts above are courtesy of Bloomberg via ZeroHedge.
———————————————————-
WOULD YOU LIKE TO HAVE YOUR INVESTMENTS PROFESSIONALLY MANAGED?
Do you have the time to follow our investment plans yourself? If you are a busy professional who would like to have his portfolio managed using our methodology, please contact me directly to get more details.
Contact Ulli