ETF Tracker Newsletter For March 21, 2023

Ulli Uncategorized Contact

ETF Tracker StatSheet          

You can view the latest version here.

ENDING THE MONTH ON A POSITIVE NOTE
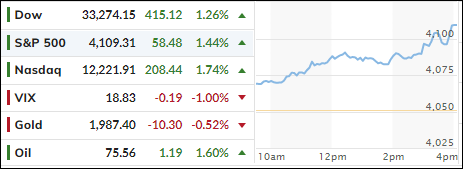
[Chart courtesy of MarketWatch.com]

  1. Moving the markets

It was only three trading days ago when the S&P 500 had finally climbed back to a point where its performance was even for the month, after having been clobbered during the banking crises. 

From that moment in time, the major indexes ramped higher, as banking fears evaporated, thereby saving the month and the quarter from a dismal performance. Today’s boost came thanks to a softer reading from the Fed’s favorite inflation indicator, namely the core PCE (Personal Consumption Expenditure index).

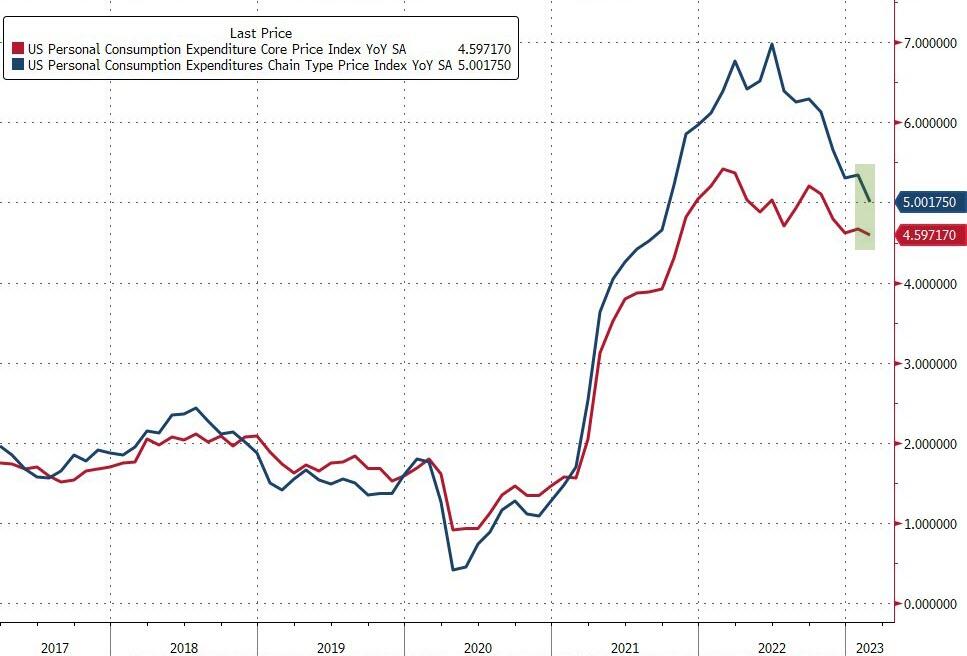
It was expected to come in unchanged at 4.7% but instead improved a tad to its lowest since October 2021 (4.6% YoY). That was music in the ears of traders and algos alike, and the Ramp-A-Thon continued throughout the session.

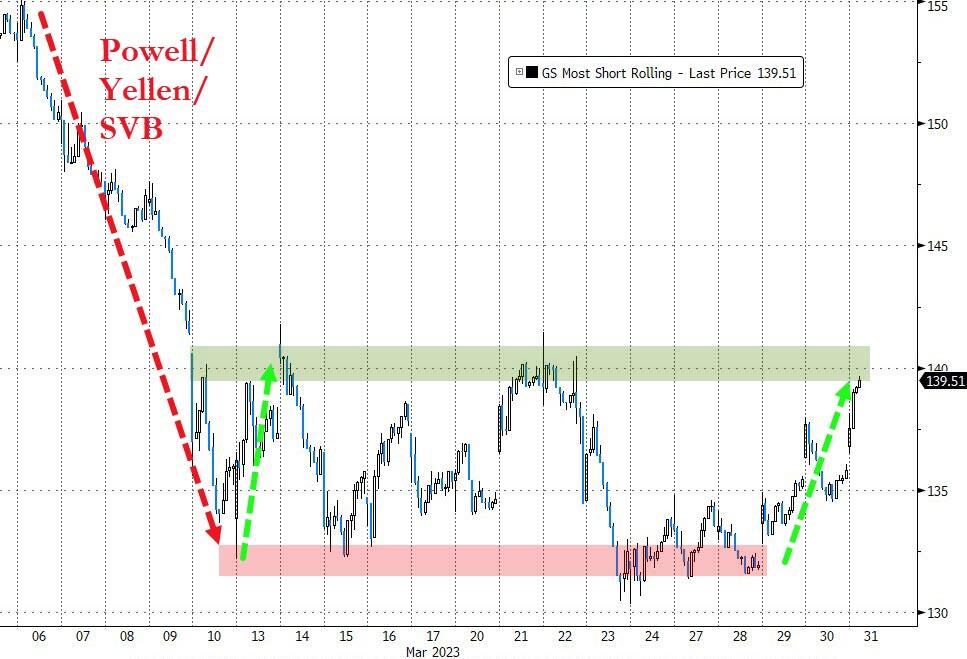
After having been absent since March 28th, a short-squeeze was activated and provided the much-need firepower to close this week on a bullish note. Of course, a bull market scenario can’t live on short covering alone, real buyers are needed to support this effort over the longer term. We will find out next week if the past 3 days were indeed nothing but quarterly window dressing.

For sure, the month of March was not a smooth ride due to the failure of two reginal banks and a forced takeover of Credit Suisse. While this 3-day rally helped market sentiment, the crisis has been merely put on the backburner and could very well reappear without much warning.

Why?

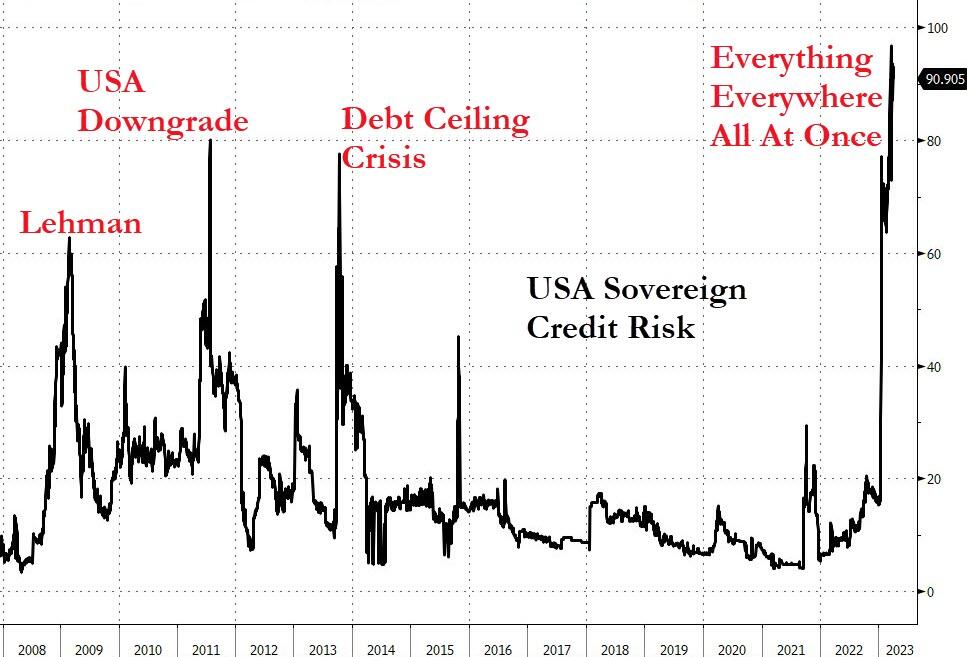
Because all banks are fractionally operated, meaning they only have a portion of your money on deposit, and are therefore potential victims to sudden massive withdrawals. Bloomberg looked at where we are in this chart when considering the bigger picture, so caution is warranted in terms of the magnitude of market exposure.     

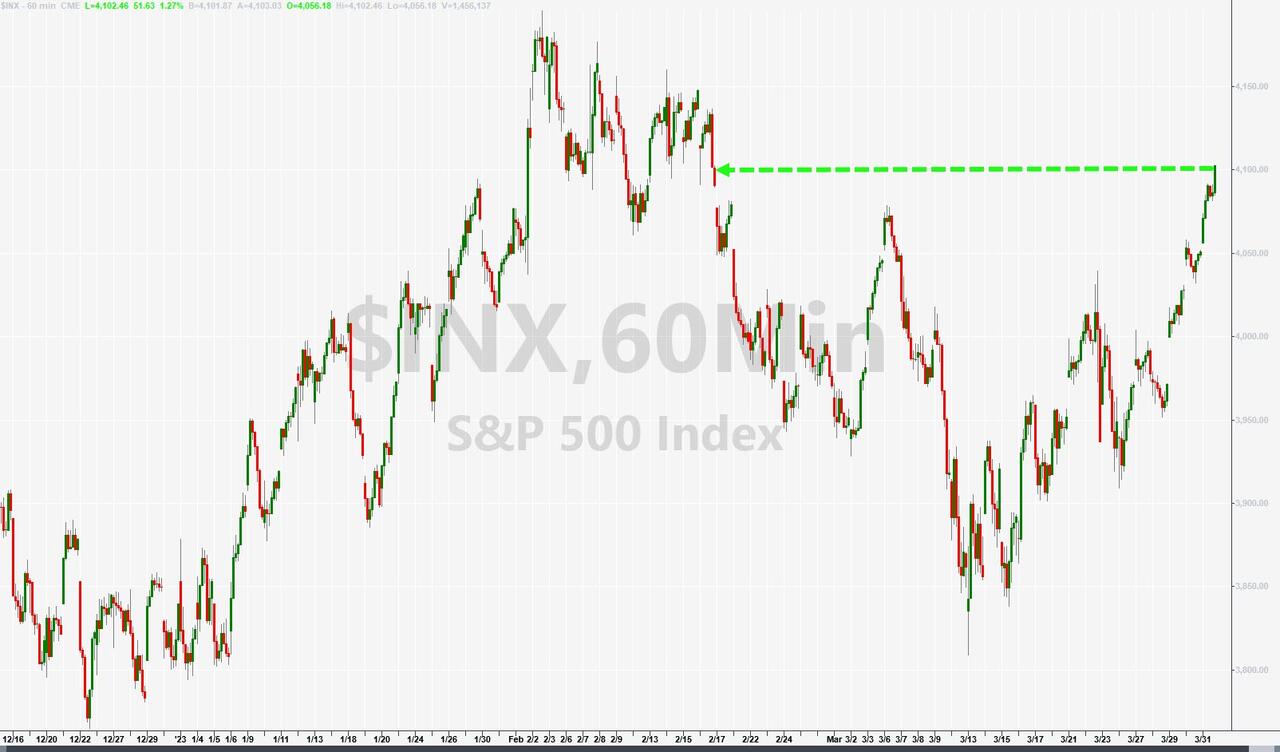
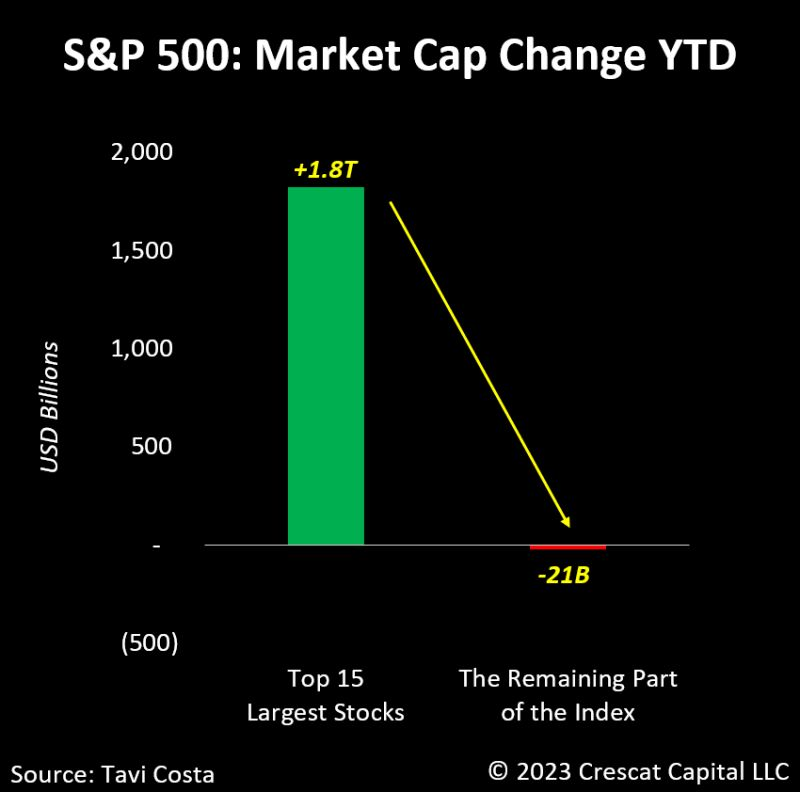
While the S&P’s comeback, and recapture of the 4,100 leve,l is indeed impressive, it’s noteworthy, as ZH pointed out, that its performance in Q1 was dominated by just 15 stocks,

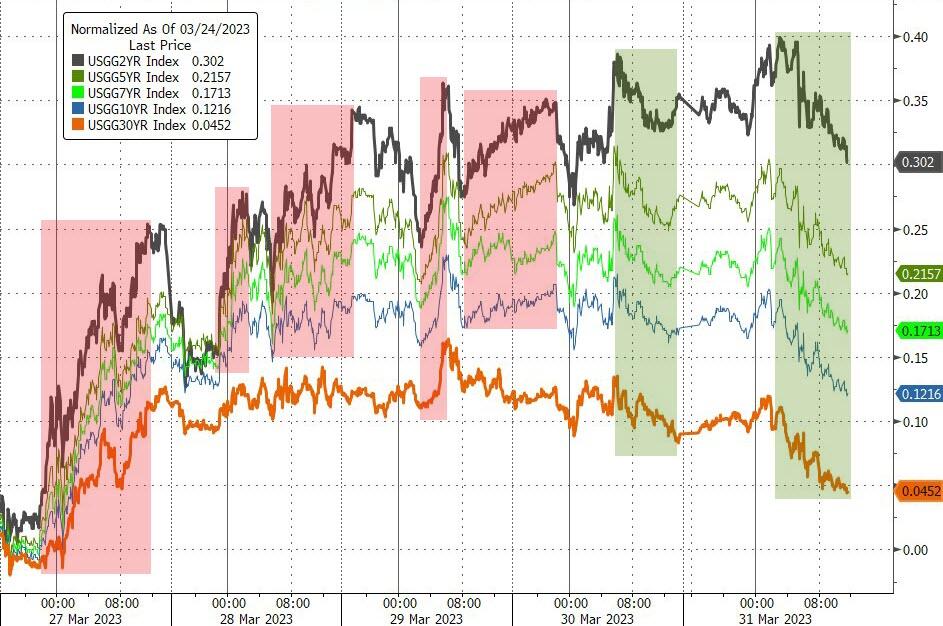
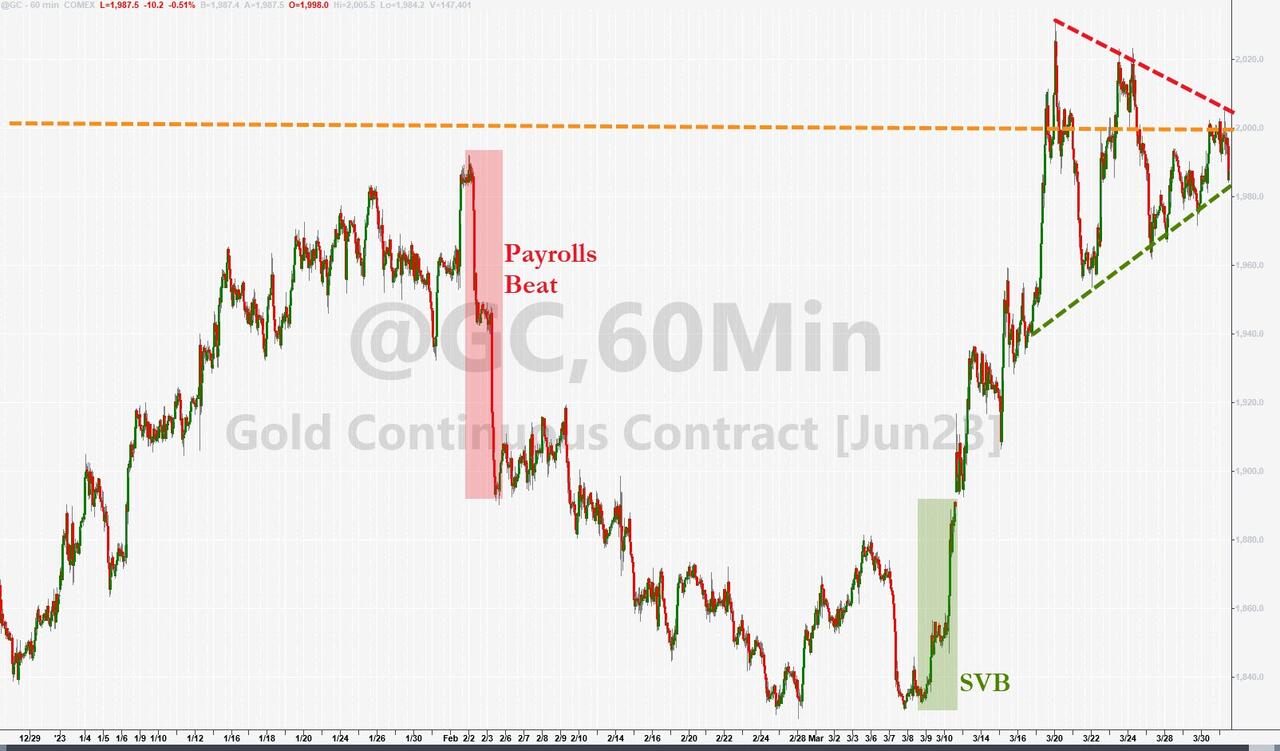
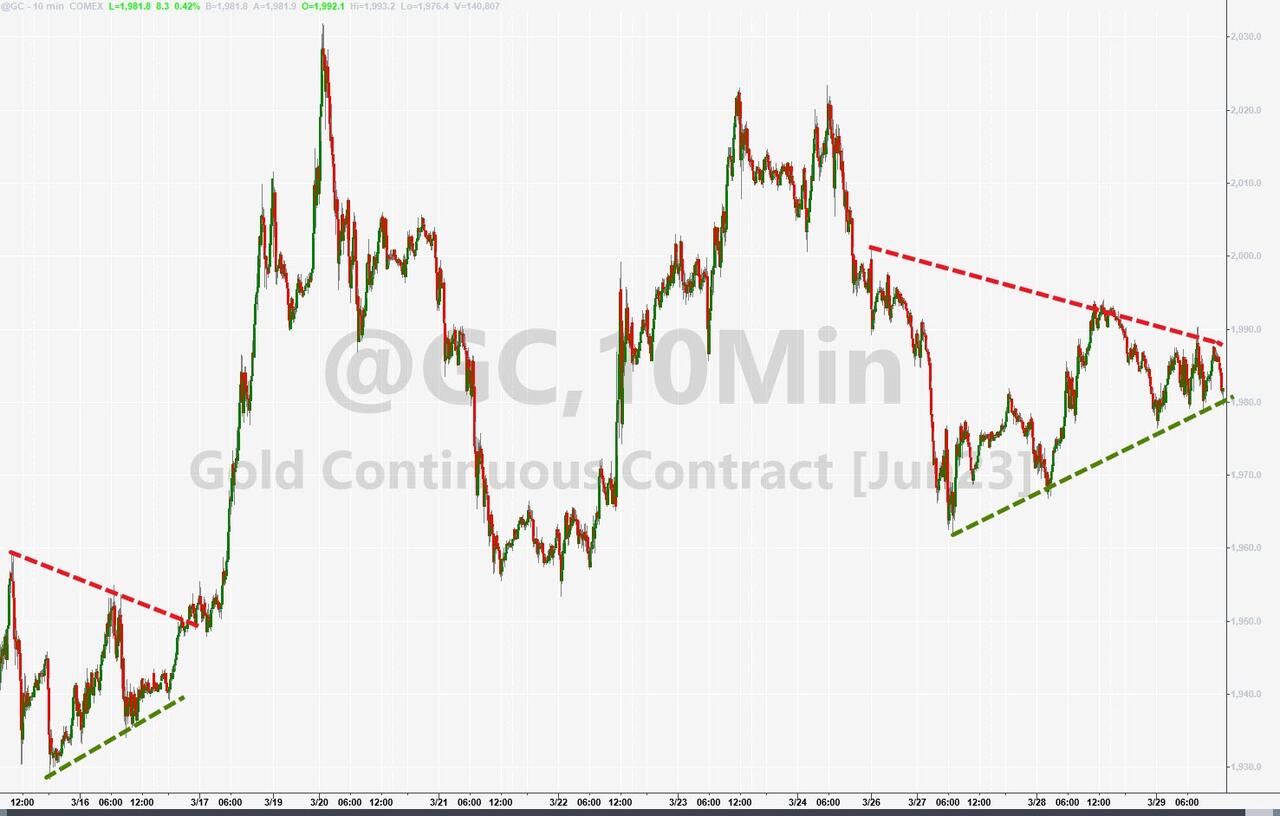
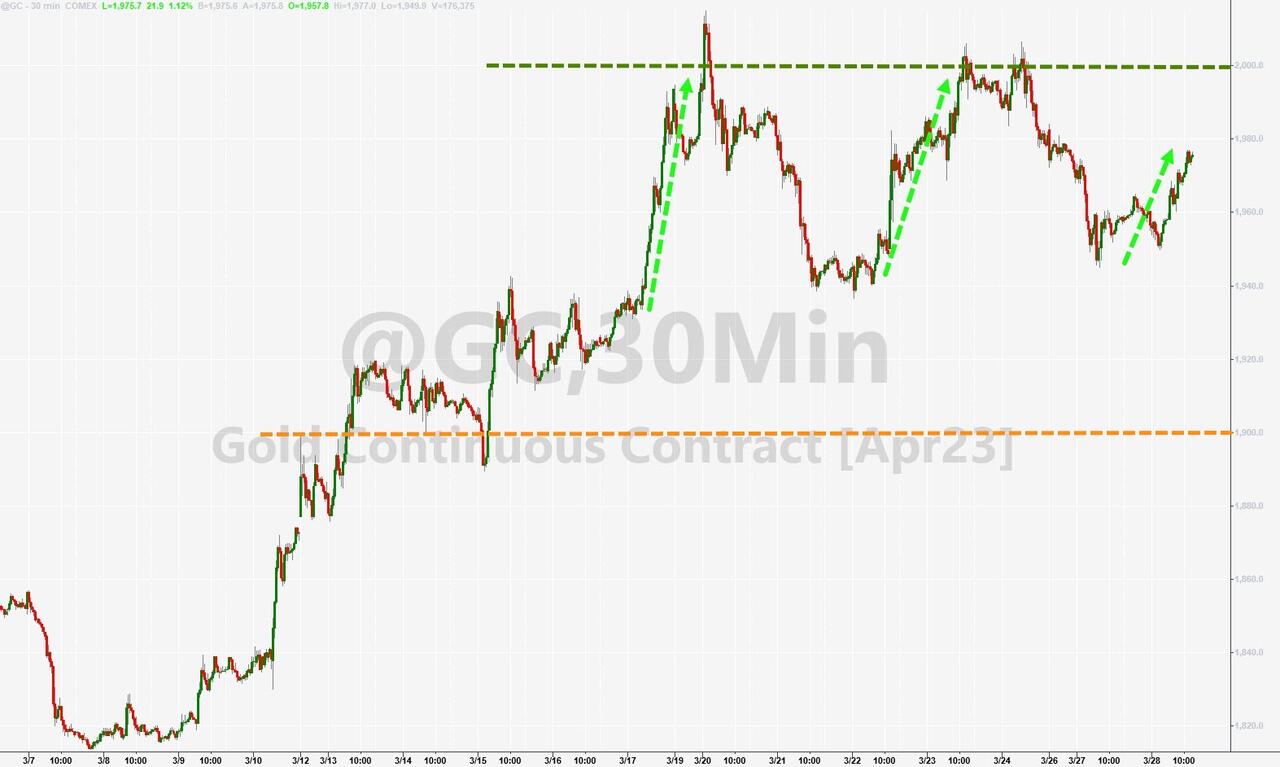
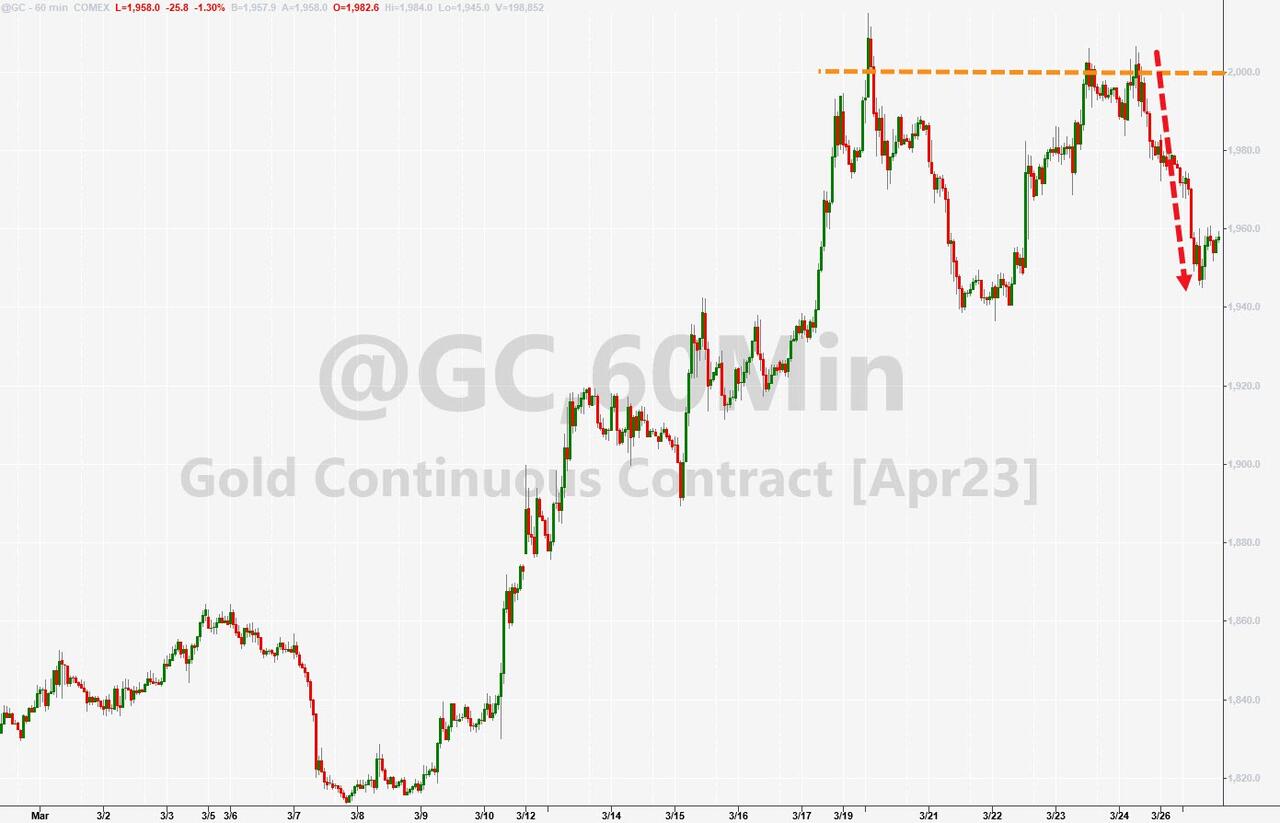
Bond yields rose for the week, and Gold continued its top performance (up over 19% in the last 6 months, its best gain since 2016). The precious metal has now scored its highest quarterly close in history with a March gain of almost 9%.

With recessionary bells ringing, could this rebound be again part of the strong conviction that some “easing” by the Fed is warranted—despite their hawkish tones?

Read More
Weekly StatSheet For The ETF Tracker Newsletter – Updated Through 03/30/2023

Ulli ETF StatSheet Contact

ETF Data updated through Thursday, March 30, 2023

Methodology/Use of this StatSheet:

1. From the universe of over 1,800 ETFs, I have selected only those with a trading volume of over $5 million per day (HV ETFs), so that liquidity and a small bid/ask spread are assured.

2. Trend Tracking Indexes (TTIs)

Buy or Sell decisions for Domestic and International ETFs (section 1 and 2), are made based on the respective TTI and its position either above or below its long-term M/A (Moving Average). A crossing of the trend line from below accompanied by some staying power above constitutes a “Buy” signal. Conversely, a clear break below the line constitutes a “Sell” signal. Additionally, I use a 12% trailing stop loss on all positions in these categories to control downside risk.

3. All other investment arenas do not have a TTI and should be traded based on the position of the individual ETF relative to its own respective trend line (%M/A). That’s why those signals are referred to as a “Selective Buy.” In other words, if an ETF crosses its own trendline to the upside, a “Buy” signal is generated. Here too, I recommend trailing sell stop of 12%, or less, depending on your risk tolerance.

If you are unfamiliar with some of the terminology, please see Glossary of Terms and new subscriber information in section 9.     

1. DOMESTIC EQUITY ETFs: BUY — since 12/01/2022

Click on chart to enlarge

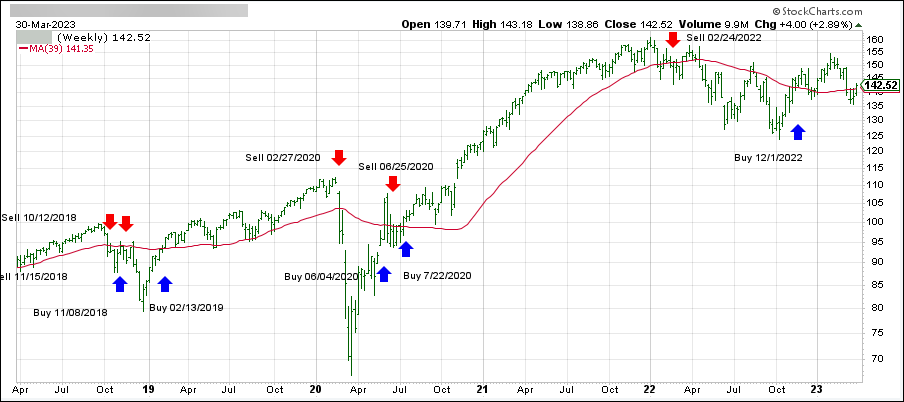
Our main directional indicator, the Domestic Trend Tracking Index (TTI-green line in the above chart) has reclaimed its long-term trend line (red) by +0.98% and remains in “Buy” mode for the time being.

Read More
Maintaining Altitude

Ulli Market Commentary Contact

[Chart courtesy of MarketWatch.com]

  1. Moving the markets

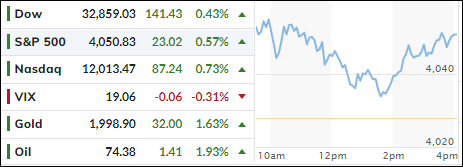
Again, the belief prevailed on Wall Street that the worst of the regional banking crisis is now in the rearview mirror, which caused traders and algos to push the major indexes higher for the second day in a row.

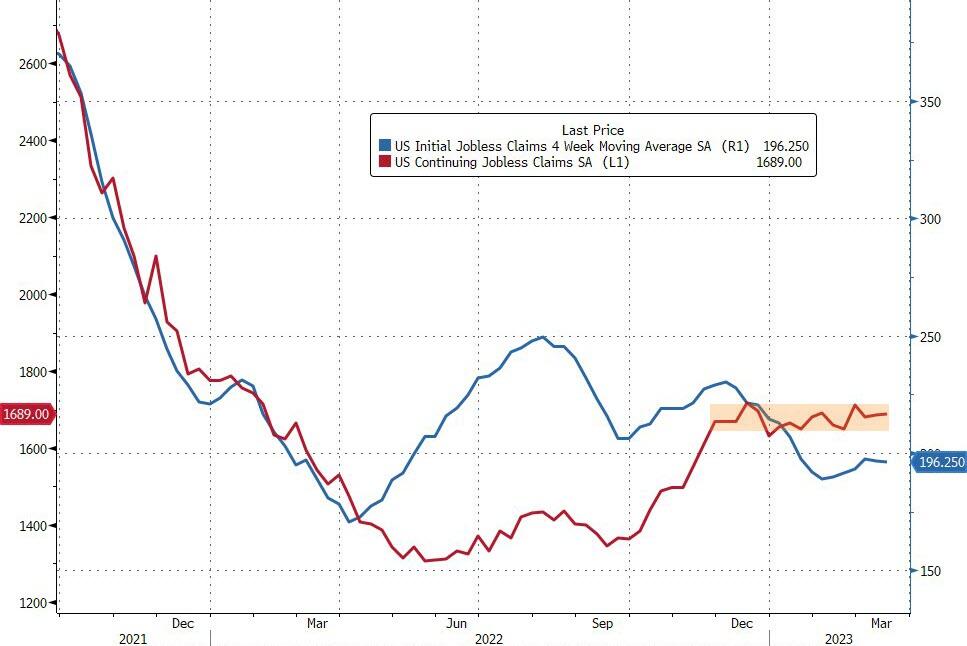
Jobless claims dropped moderately but have not gone anywhere in four months, thereby supporting hopes that the Fed might be inclined to slow down its tightening efforts, as the labor market appears to show signs of cooling, which in turn gave an assist to equities.

To me it looks like the market is getting ahead of itself by pricing in a Goldilocks scenario, in which we would see the best of both worlds: Traders expecting a recession with low rates and reduced inflation in an environment that does not negatively affect corporate earnings.

Sure, such a setting would indeed be good for equities, but I don’t think this scenario is even remotely realistic, because all banks are in similar situations like the failed ones, it just has not become public knowledge yet.

That means more systemically important institutions will have to be bailed out with money that the US Treasury doesn’t have. Therefore, dollars must be created out of thin air, and inflation will rear its ugly head again. If the Fed is serious about battling back, interest rates/bond yields will have to go considerably higher.  

These are all known cause-and-effect facts, the only unknown at this moment is the timing of it.

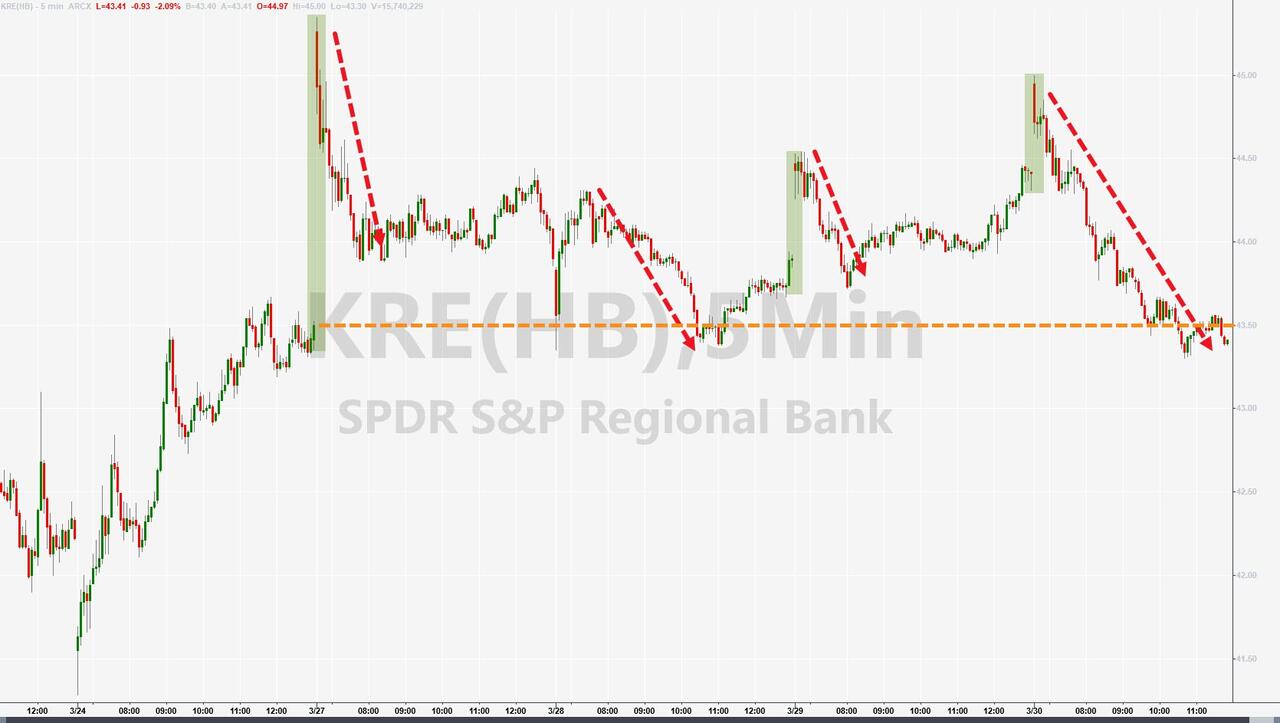
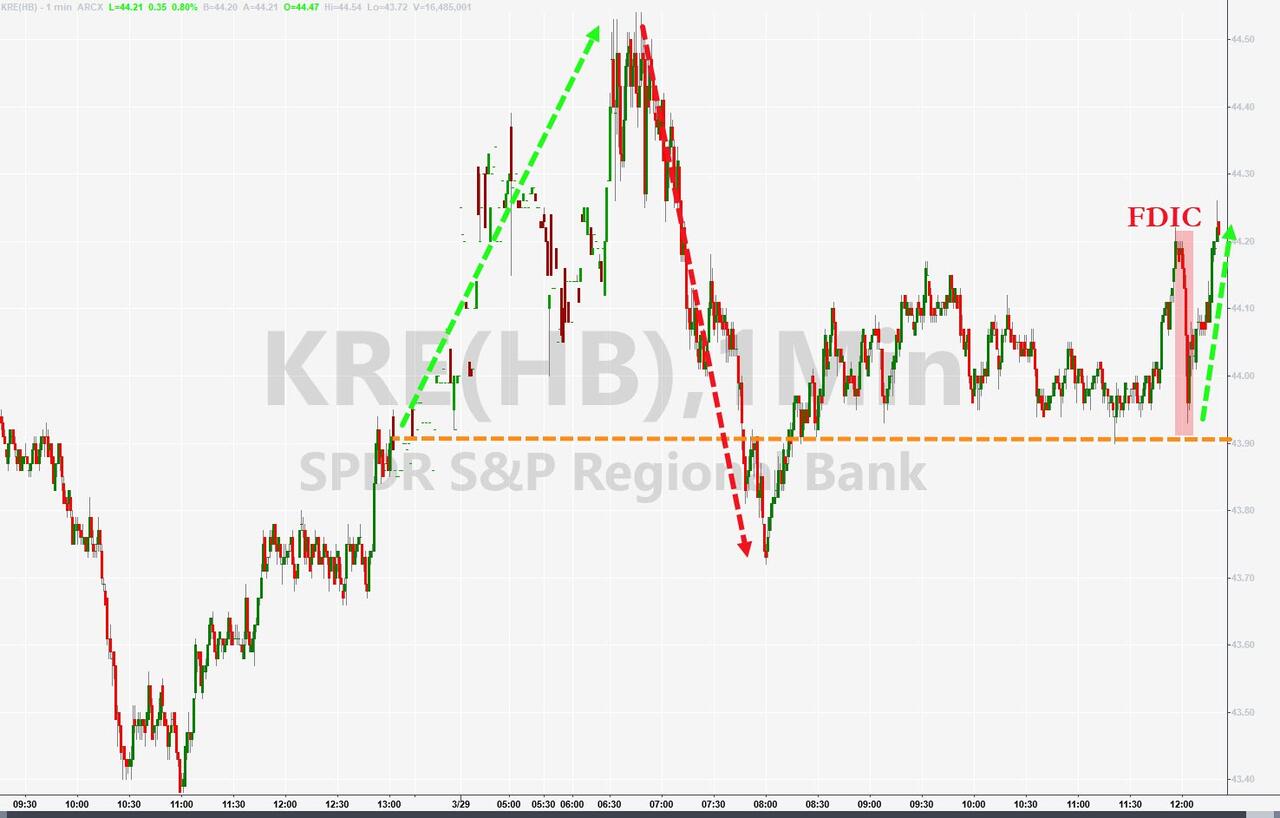
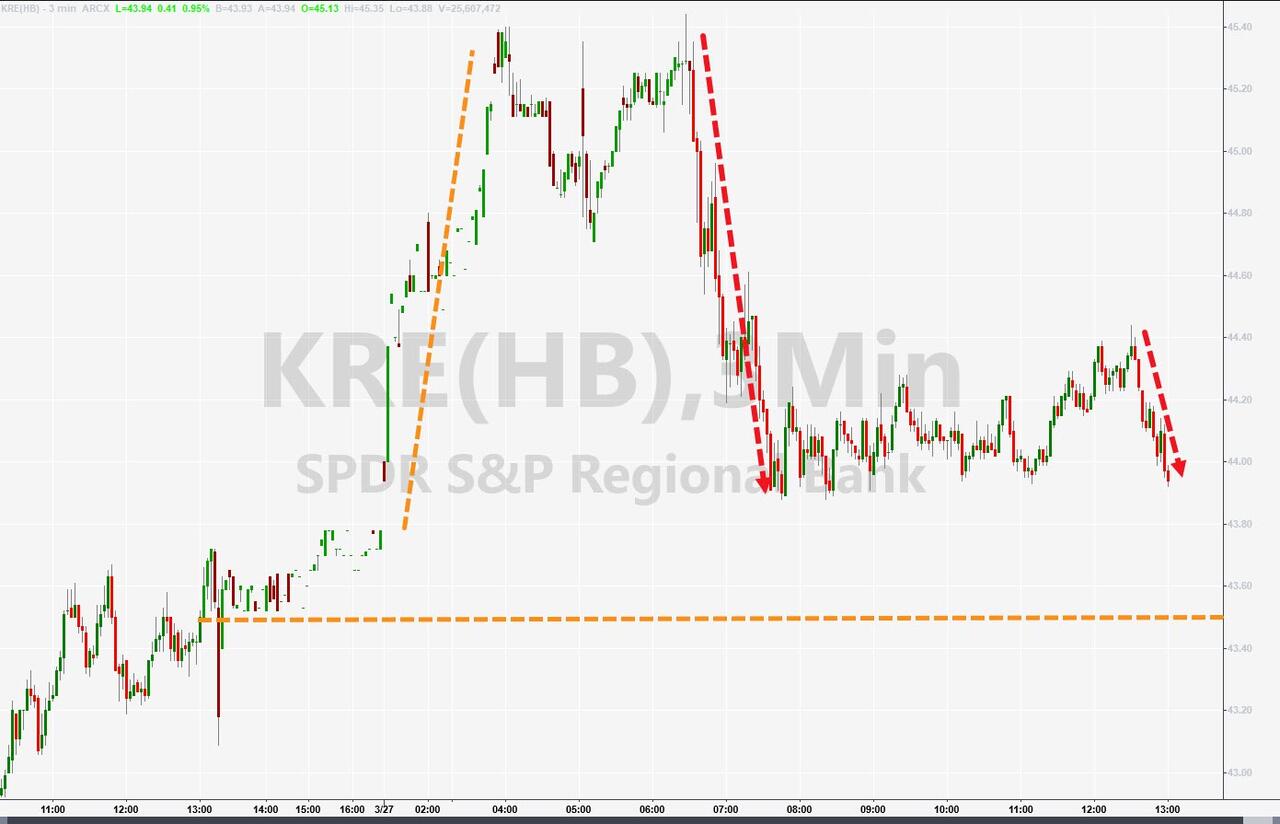
Despite this unbridled optimism about the banking crisis, the regional banking index KRE slipped after riding the roller coaster all day. Stocks followed suit with one Fed governor spewing hawkish words while another walked back the tough talk with some dovish tones, which pulled equities out of their midday slide.

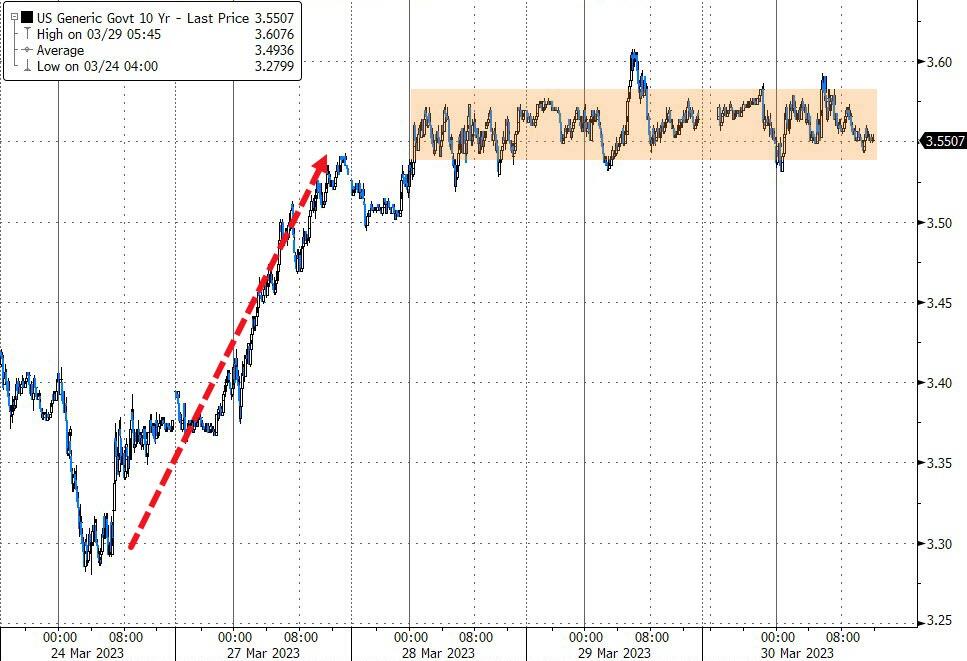
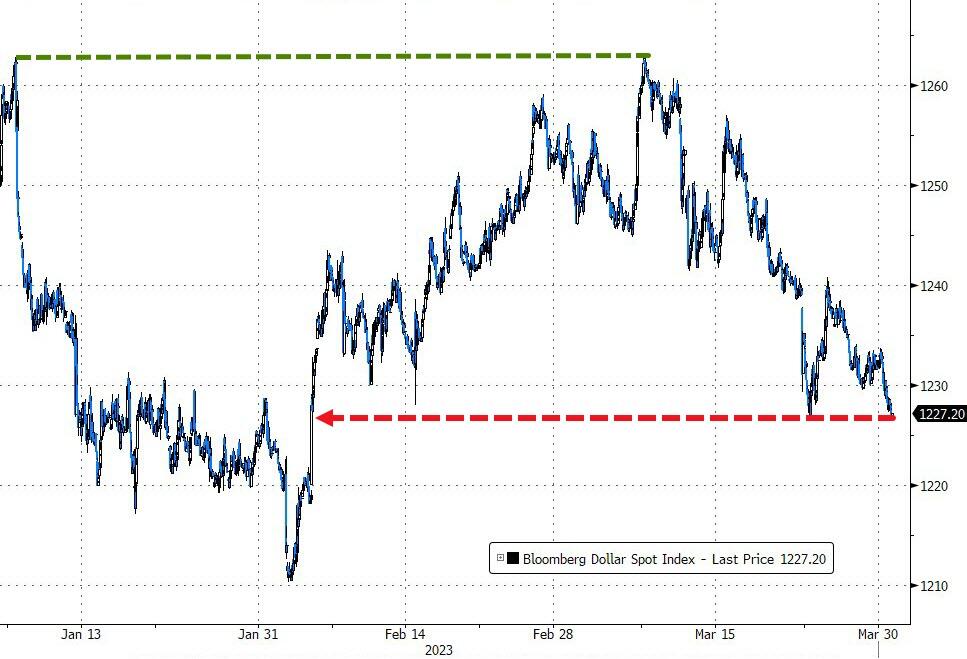
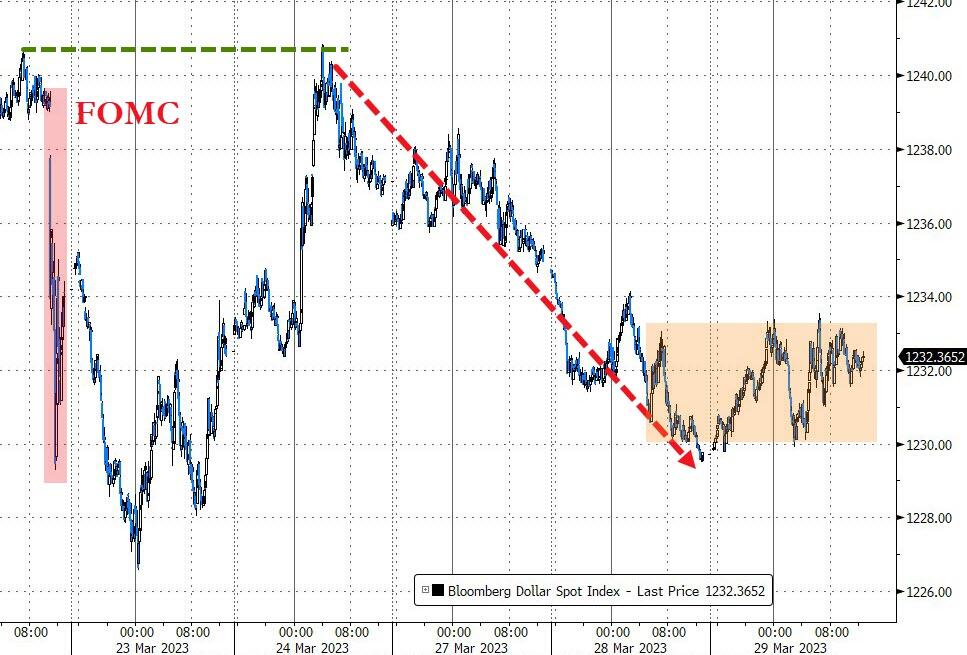
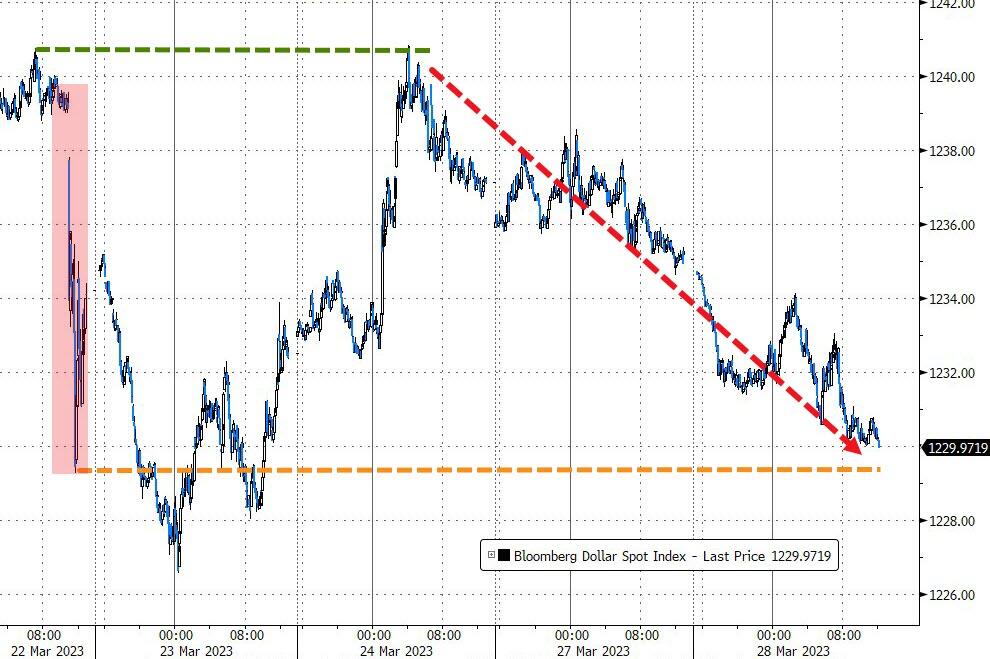
Bond yields slipped a tad, with the 10-year continuing its 3-day sideways pattern. The US Dollar fell to its lowest close since February 3rd, while Gold ripped higher by +1.63% and stopping just short of its $2k level.  

Read More
Is The Worst Of The Banking Crisis Over?

Ulli Market Commentary Contact

[Chart courtesy of MarketWatch.com]

  1. Moving the markets

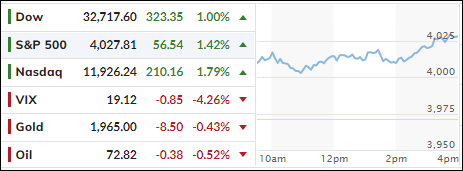
Judging by today’s rebound, it appears that traders and algos alike were no longer concerned with the state of the banking sector, nor if or when the Fed might shift into easing mode. None of it mattered, as sentiment maintained its bullish influence, with the S&P 500 reclaiming its 4,000 level—also helped by a calm bond market.

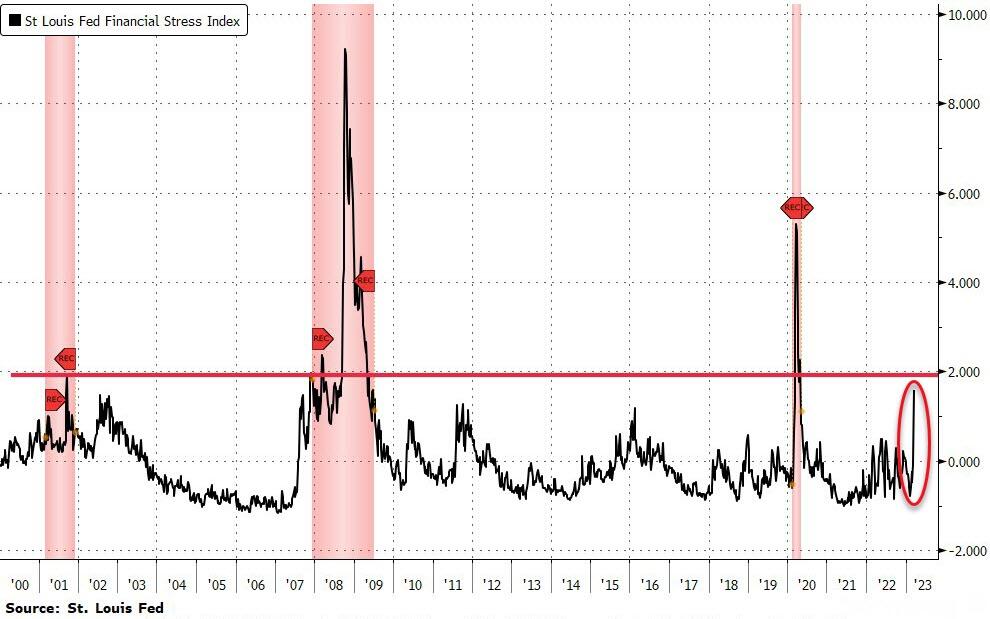
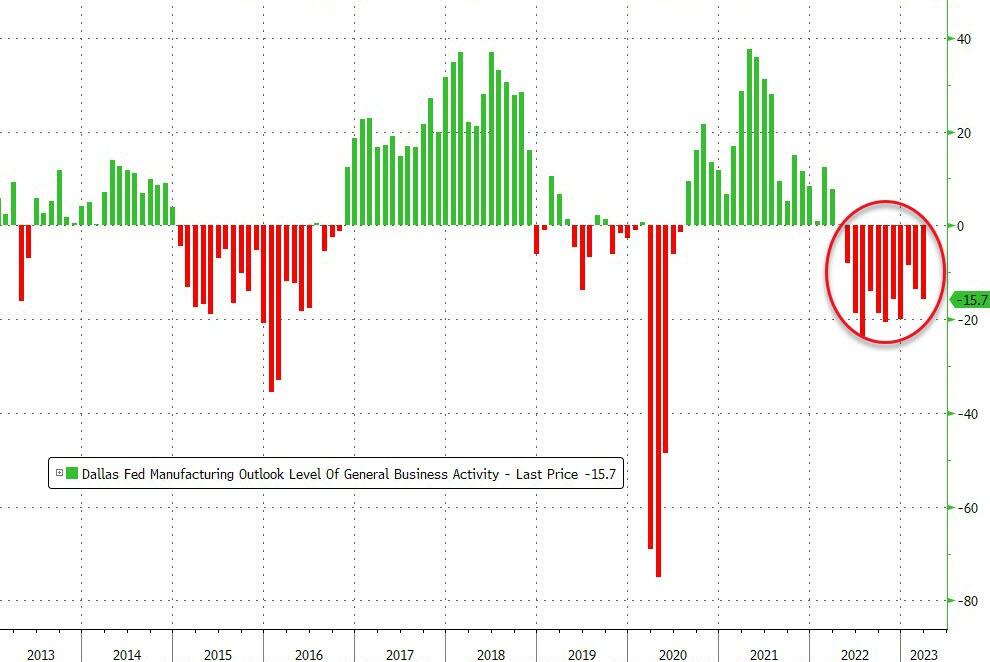
Never mind that the Fed’s gauge of financial stress has approached levels of concern, as ZH reported, but it seems that policymakers’ best hope will be that the current calm will prevail long enough to keep the economy from falling off a cliff.

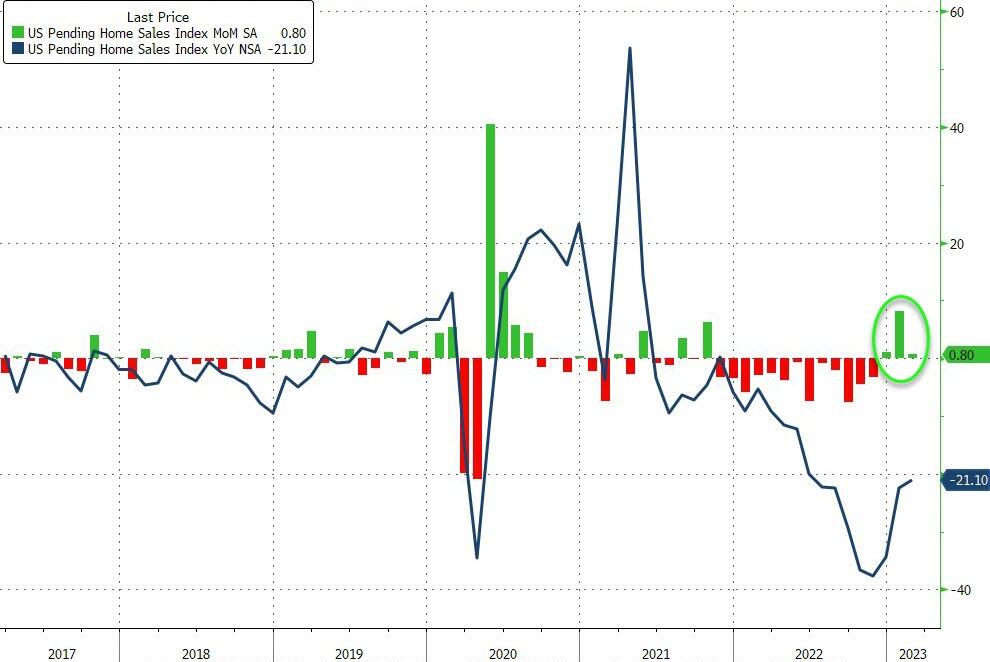
In economic news, we learned that the Pending Home sales rebound slowed in February after a huge 8.1% surge in January.  

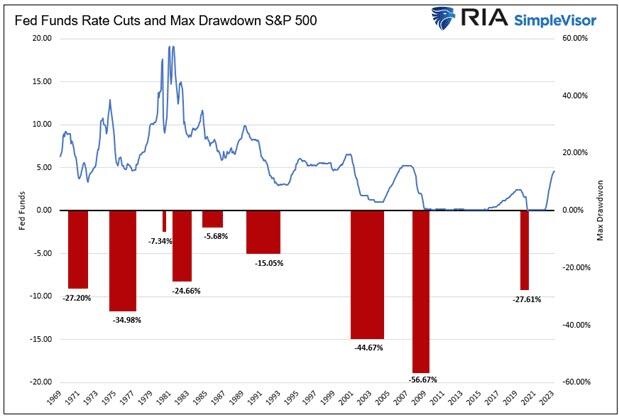
I enjoyed market analyst and charting guru Michael Lebowitz’ piece on clarifying that a Fed pivot (to lower rates) is not bullish, if history is any indicator. He states that since 1970, there have been nine instances in which the Fed significantly cut the Fed Funds rate. The average maximum drawdown from the start of each rate reduction period to the market trough was 27.25%, as his chart shows.

Makes me think of the old saying “be careful what you wish for,” something that traders should keep in mind rather than only focusing on the event, expecting that bullish times are here again.

The regional banking sector’s ETF KRE pumped, dumped, and pumped again, which is surely not a sign of certainty or directional clarity. A similar rollercoaster happened to the big banks with KBWB first tanking and then cranking.

The US Dollar limped sideways, while Gold slipped but stayed above its $1,950 level and within striking distance of again taking out its $2,000 resistance point.

With today’s ramp, our Domestic TTI climbed back above its long term trendline for the first time in 3 weeks. Please see section 3 below for details.

Read More
Fluctuating Below The Unchanged Line

Ulli Market Commentary Contact

[Chart courtesy of MarketWatch.com]

  1. Moving the markets

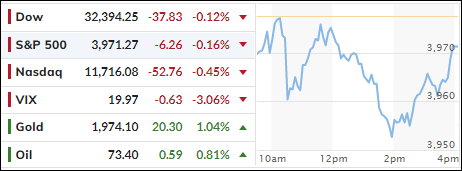
Just like yesterday, climbing bond yields kept a lid on bullish sentiment, as the major indexes bounced around their respective unchanged lines before sauntering into red territory, where they closed with minor losses. The S&P and Nasdaq erased yesterday’s gains and never saw “green” during this session.  

There was no apparent driver on deck to keep the bullish theme intact and—despite traders looking beyond the banking crisis yet recognizing that on one hand the economy still shows some resilient growth but on the other could easily be pushed into a recession—buyers remained conspicuously absent.   

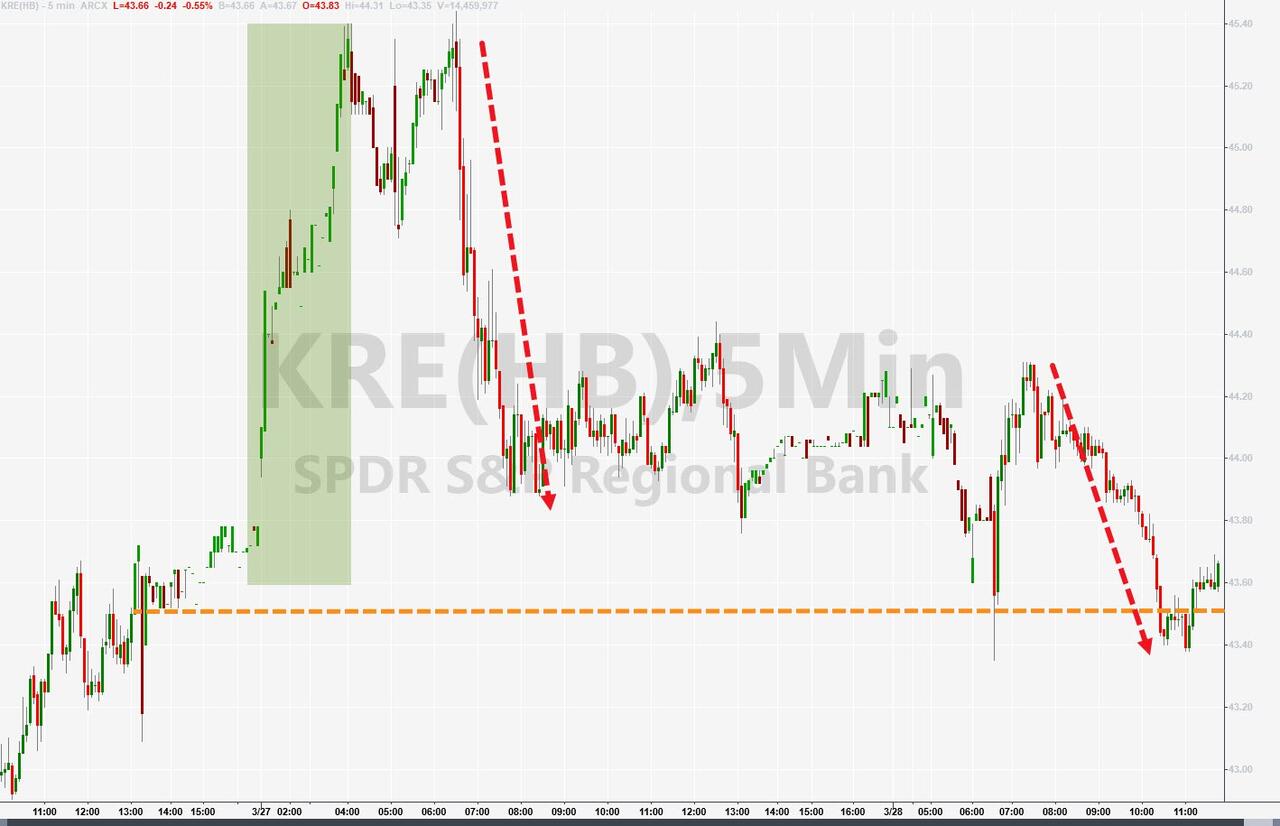
Regional banks took a dive, as hearings in Washington on bank failures offered nothing but more regulation, more laws, tighter credit, and no bailouts, as ZH reported. As a result, the regional banking index KRE dropped again, thereby wiping out yesterday’s rebound.

The US Dollar continued its 3-day down trend, which helped Gold to gain +1.06% on the day, as the precious metal found support at its $1,950 level.  

Read More
Grinding And Churning

Ulli Market Commentary Contact

[Chart courtesy of MarketWatch.com]

  1. Moving the markets

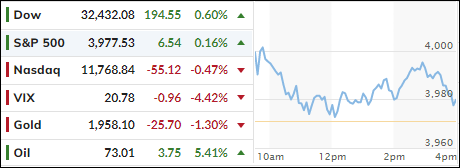
Apparently, traders found some encouragement from last week’s modest advances, as well as the fact that we made it through the weekend without another bank collapsing, so they pushed equities moderately higher, but the results were mixed, as the graph above shows.

Never mind that Deutsche Bank (DB) and other fellow European bank shares took a dive on Friday, this morning all was well, and European stocks set the tone for a positive US opening.

While this does not mean the banking crisis has been resolved, far from it, it simply has been put on the back burner for the time being. The dominant reason is that Wall Street is still convinced that the Fed is bluffing and a pause or pivot may be in the near future, as the economy points to stagflation.

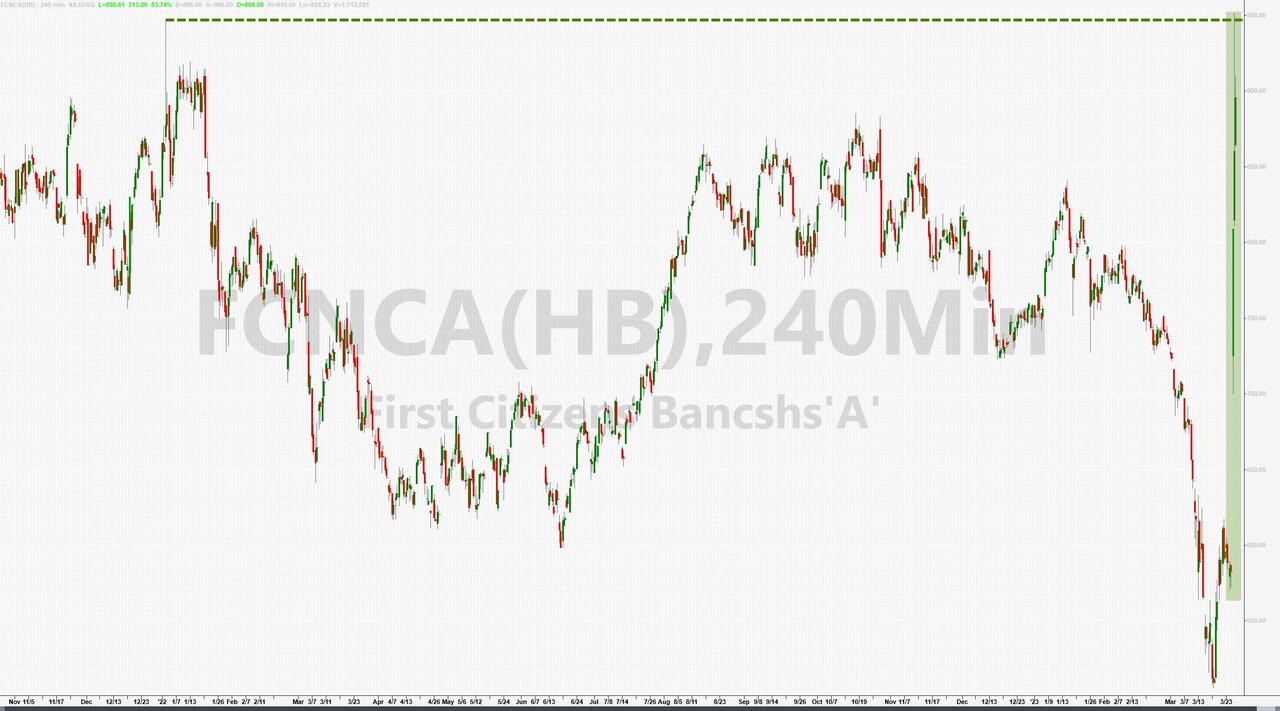
The reginal banking index ETF KRE managed to add 1.6%, while some of its components did much better, like First Citizens Bank, which soared over 50%. Helping this rebound was improved market sentiment based on irrational hope of policymakers getting a handle on these challenges. Yeah, right…

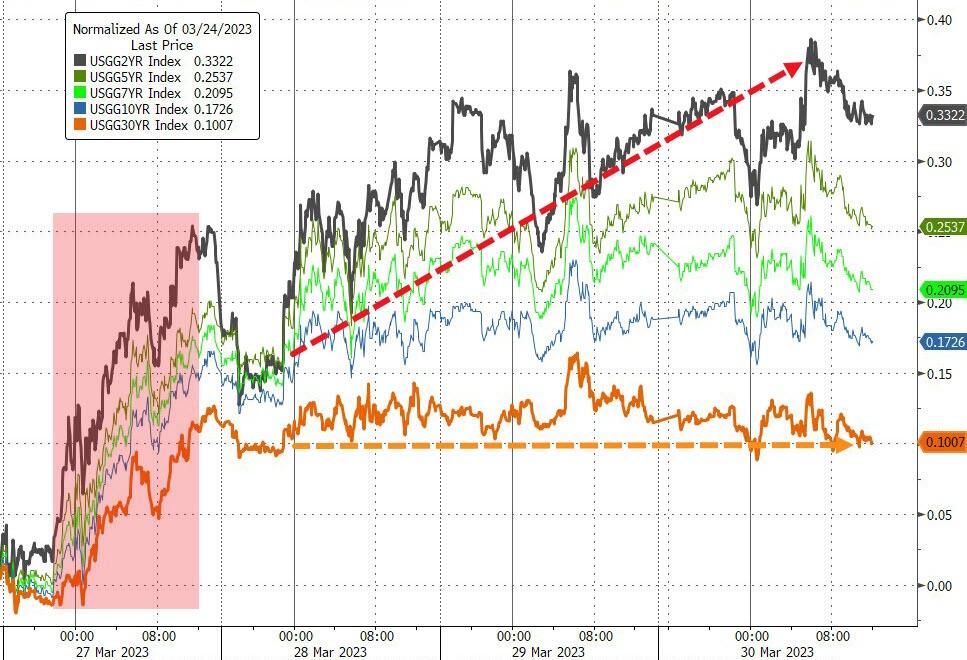
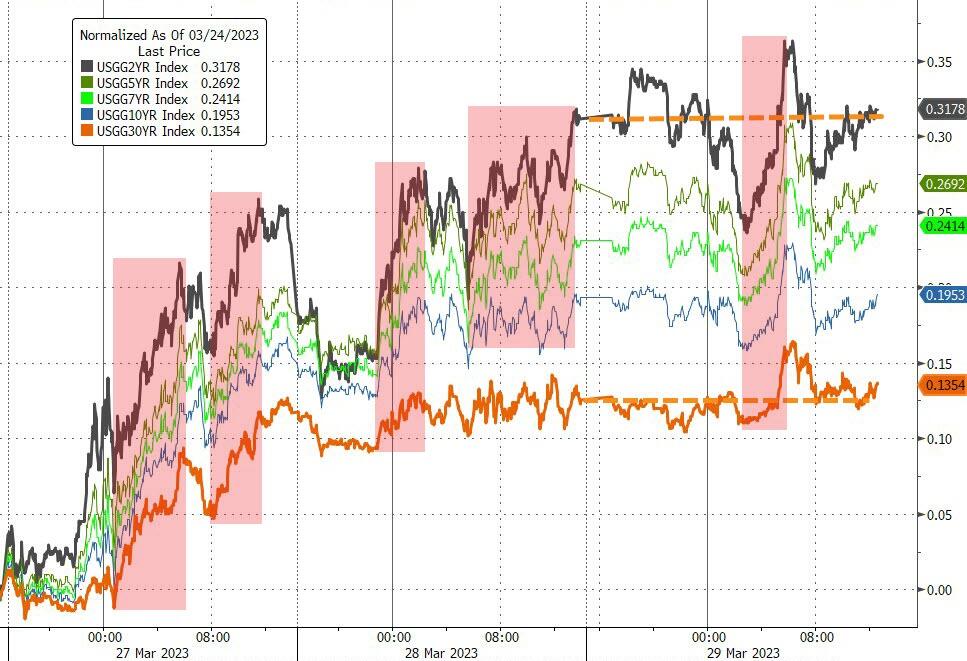
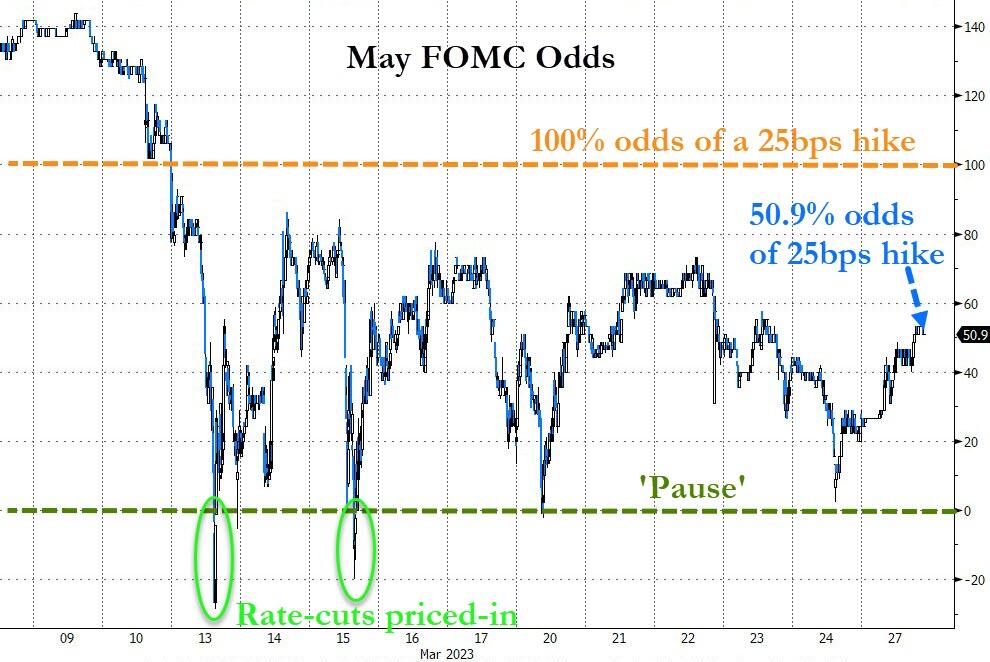
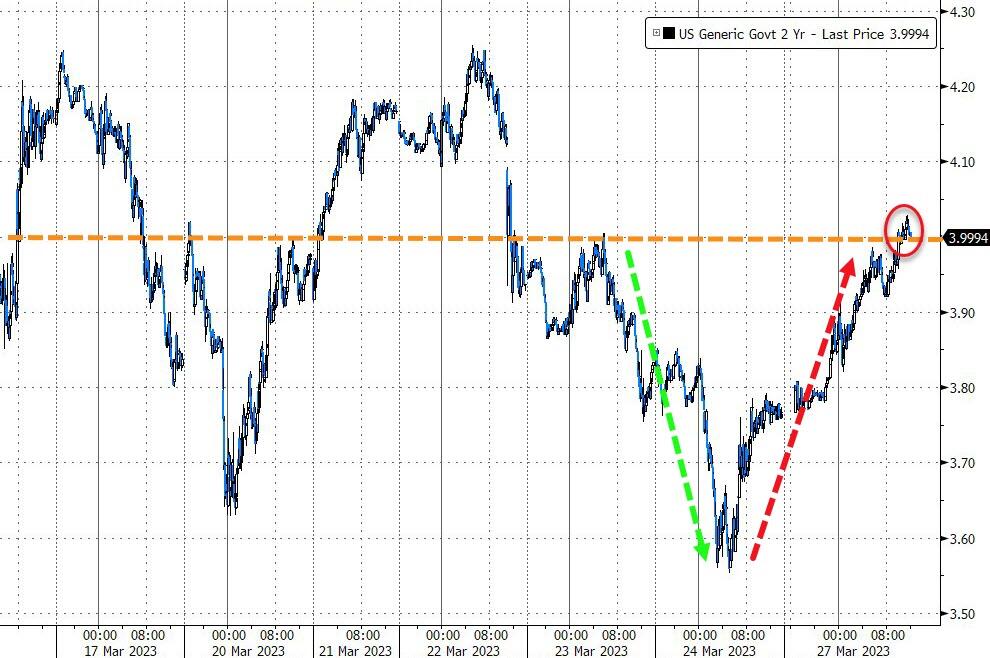
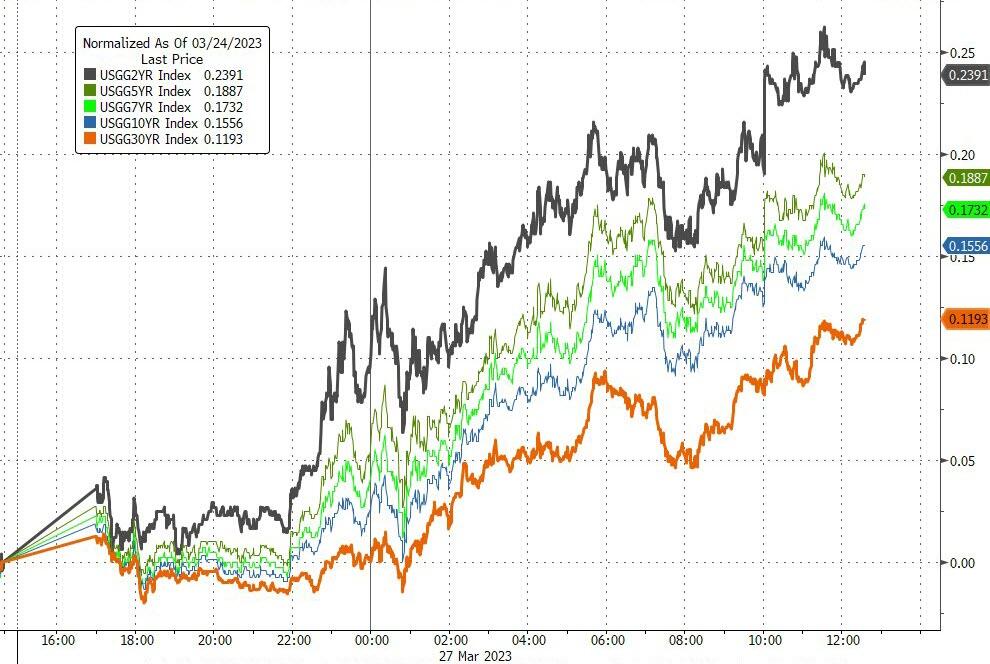
Traders conveniently overlooked the fact that bond yields surged, and rate hike expectations took on a hawkish tone, as ZH pointed out. The 2-year managed to recapture its 4% level, which it had surrendered 5 days ago.  

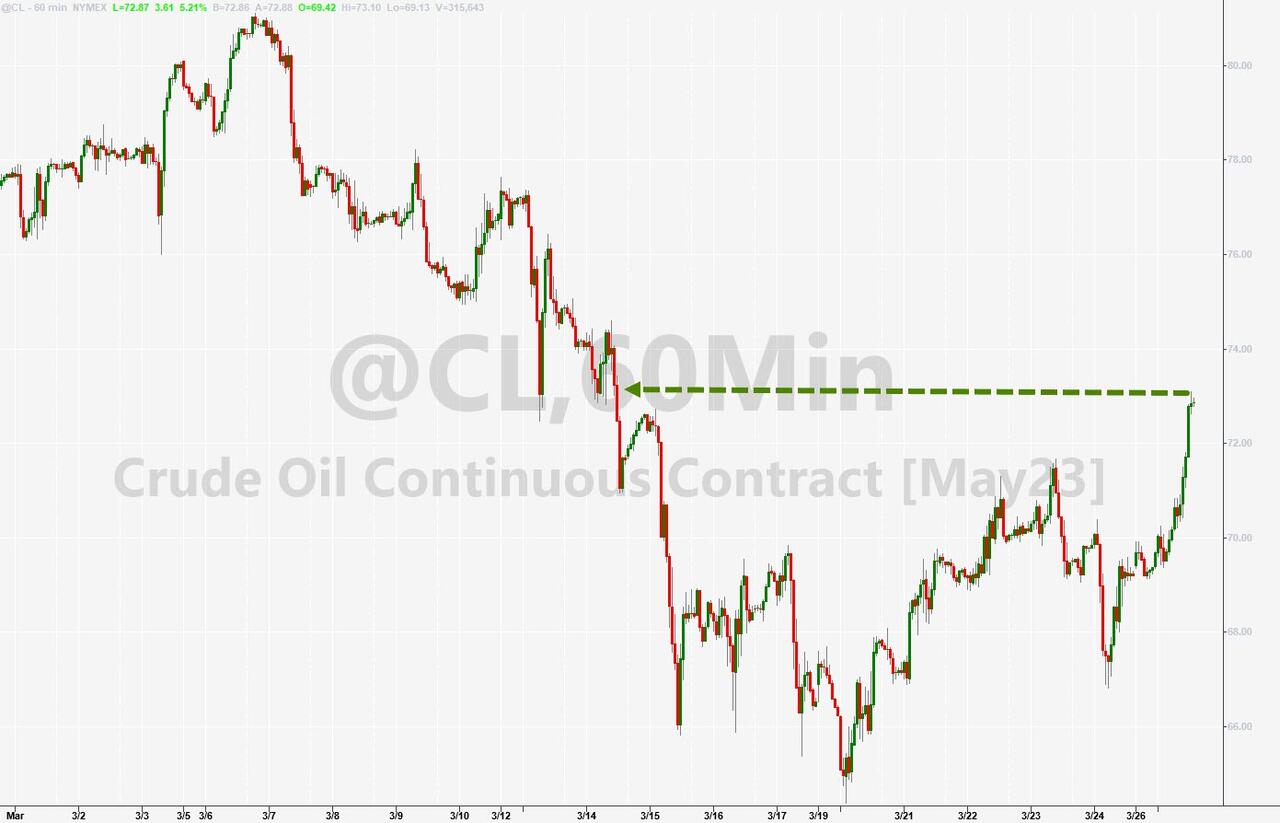
The US Dollar slid -0.26%, as did Gold, with its $2k level currently functioning as overhead resistance. Crude oil went on a rampage and added +5.40% for the session to close at $73.

Our Domestic Trend Tracking Index (TTI-section 3) has climbed again closer towards its long-term trend line. We are still in the neutral zone but will increase our equity holdings, should this dividing line between bullish and bearish territory be solidly broken to the upside.

Over the past two weeks, all attempts have been nothing but head fakes.  

Read More