Sunday Musings: The 10 Best Days Vs. The 10 Worst Days

Ulli Uncategorized Contact


Hat tip goes to reader David for providing the above chart, which was created by Pension Partners.

There are a few interesting observations about this data set:

• The 10 best days account for 50% of the buy and hold performance (roughly 0.2% of the days from 1993 to August 2010).

• Classic “Buy & Hold” nets $324,330.15

• Missing the 10 Best Days gives up more than 50% of the Buy & Hold performance: $156,354.12

• If you manage to avoid the 10 Worst Days, your portfolio more than doubles the Buy & Hold performance: $692,693.90

The lesson I take from this: It is great if you can avoid the major down days, but only if you can do so in a way that does not have you missing the major up days. If you manage to avoid all of the Worst days, but miss all of the Best days too, then your portfolio performance will be is nearly the same as straight Buy & Hold (but with additional taxes and commissions paid).

Now the reality is no one will consistently miss all the worst days — I’m the first guy to admit our 100% Cash call the day before the flash crash was dumb luck — but you can avoid being long for most of a secular bear market. If you can miss the longer downtrends, you end up way ahead. Not drops that last days or weeks, but the secular months and quarters in the red.

That might be more challenging approach to chart — but it’s worth exploring . . .

It has always been my belief that avoiding the downside is far more important for long-term portfolio performance than to participate in every uptick the market throws at you.

The above chart makes a good point in demonstrating that, unfortunately, only on a buy and hold basis. It would be interesting to see what the effect would be when used with the rules of trend tracking, where you automatically avoid the worst days in the market.

At the same time, however, some of the best days in terms of rebound rallies may very well happen while in bear market territory; so you would miss those as well.

Since it is impossible to foresee when the best days or the worst days are about to happen, this analysis is pretty useless as an investment method. Trend Tracking on the other hand offers a viable alternative.

Let’s look at our last domestic sell signal effective 6/23/08. The S&P; 500 stood at 1,318 and closed last Friday at 1,149. That means it still has to gain another 14.74% just to reach the breakeven point despite the sharp rallies off the March 09 lows.

I am sure that during the period we were out of the market (6/23/08 to 6/3/09) we saw some of the worst days and some of the very best ones. The key, however, was to be out altogether to avoid the market meltdown, which makes it unimportant as to whether we participated in the best recovery days or not.

A Forgotten Fund Gets Hot

Ulli Uncategorized Contact

Occasionally, I have posted about a no load mutual fund that should belong in every investor’s portfolio, even if your general preferences are the use of ETFs.

The WSJ reports in “Permanent Portfolio (PRPFX): How a Forgotten Fund got Hot in a Hurry:”

I’ve been following the ‘permanent portfolio’ theory on and off with one eye for a few years, and it’s actually been quite an interesting performer. Especially the past few years with the 2nd massive bear market in a decade in equities, combined with a multi decade bull in bonds (only accelerating of late), and the decade long surge in gold. It is championed by Harry Browne – a quick overview.

* The general idea of this approach is that there are four basic classes of investments investors should primarily concern themselves with: stocks, Treasury bonds, cash (Treasury bills), and precious metals. He did some analysis of past trends in those markets and discovered that a portfolio consisting of equal parts of each of those four types of investments was not terribly volatile and had a relatively consistent rate of return.

* Of course, such a portfolio would never do as well as one that was over-weighted toward whatever investment was going to go up in the next time period, but unfortunately that information is not available when you need to know it. This approach, on the other hand, does not require precognition, but just some simple mechanical adjustments whenever one of the portfolio segments gets out of balance with the others.

* The basic idea is that each of those investments does well under certain economic circumstances: stocks during “prosperity”, Treasury bonds during “depression”, Treasury bills during “tight money”, and precious metals during “inflation”. So whatever economic circumstances occur, your portfolio should not be too seriously affected, because whatever investments are depressed by the current circumstances, some of the other ones would counteract that.

There is a mutual fund that follows this style called (shockingly) Permanent Portfolio (PRPFX) and it’s turned into the latest hot money fund, with assets now surging close to $8B! The performance considering the lost decade in stocks has been stellar… [Feb 5, 2009: Mutual Funds Have Tough Decade] but obviously if we looked at it a decade ago when any mutual fund not chock full of tech stocks was considered a loser, it would have looked like a serious laggard!

Annualized returns:

3 years: 7.8%
5 years: 9.3%
10 years: 10.5%

The Wall Street journal has a story on this tortoise that beat the hares. A quite amazing story – in August of this year the fund received more inflows than it did in its first 25 years combined!

There is more information contained in the above link, so be sure to click through if this fund is of interest to you.

We have had holdings in PRPFX for quite some time and, during the past buy cycle (since 6/3/09), it was the only fund/ETF that never reacted poorly to market pullbacks and consequently never caused a whip-saw signal.

This fund lends itself perfectly to trend tracking but the name is a bit of a misnomer. While indeed it held up better than most during the 2008 massacre, you would have been better off selling it as per our trend tracking exit strategy. Nevertheless, it comes as close as I have ever found a fund to be “permanent.”

Prior to the above story, I had just finished by own back testing to see how PRPFX might have performed during the “lost decade” (12/31/1999 to 12/31/2009), during which the S&P; 500 and just about any other fund showed negative returns.

Here is the testing methodology I used:

1. Buy PRPFX on 12/31/1999
2. Hold it until the 7% trailing sell stop takes you out of the market
3. Re-invest as soon as the price has risen again by 3% above the price you were stopped out of
4. If you get stopped out again, use the same reinvestment process

Using this simplified approach, PRPFX would have gained (including dividends) +125.18% for the “lost” decade. As comparison, the S&P; 500 (as represented by SPY lost 10.32% (including dividends).

Here’s the important part. Because of PRPFX’s lack of volatility, you only would have been stopped out “four times” in 10 years. While this does not represent true trend tracking, it nevertheless demonstrates that the tortoise can beat the hare.

I tested a variation of the above by allocating 50% to PRPFX and 50% to a bond fund (VBMFX) and applied the same principles over the same period. This combination returned a total of +93.88%. While PRPFX again had 4 buy/sell signals, the bond fund had none.

Again, this is merely meant to be a demonstration and not any guarantee that similar performances can be repeated in the future. However, it clearly shows that you don’t have to be in the hottest fund or latest ETF to outperform the S&P; 500 or just about any other fund.

The key to this success was clearly the fact the major downturns were avoided, which to my way of thinking is the number one portfolio wrecking ball. Moderate upside along with bear market avoidance will give you better odds at long-term success.

I will continue with my back testing efforts using all past trend tracking buy/sell cycles and will share the results with you once I have them.

Disclosure: Holdings in above funds

No Load Fund/ETF Tracker updated through 9/23/2010

Ulli Uncategorized Contact

My latest No Load Fund/ETF Tracker has been posted at:

http://www.successful-investment.com/newsletter-archive.php

It was a roller coaster ride with Friday’s strong up day more than making up for the mid-week losses.

Our Trend Tracking Index (TTI) for domestic funds/ETFs held above its trend line (red) by +5.27% (last week +3.74%) and remains in bullish mode.


The international index broke back above its long-term trend line by +5.57% (last week +4.21%). A new Buy signal was triggered effective 9/7/10. If you decided to participate, be sure to use my recommended sell stop discipline.

[Click on charts to enlarge]
For more details, and the latest market commentary, as well as the updated No Load Fund/ETF Tracker StatSheet, please see the above link.

Taking A Breather

Ulli Uncategorized Contact


If you consider gold an asset to be held during times of economic uncertainty, you would be correct as the metal continued its ascent toward the $1,300 level during yesterday’s session.

Stocks drifted and gold’s rise was a reaction to the Fed’s announcement Tuesday that they were ready to do whatever it took to support the economy. As I posted yesterday, that announcement pushed interest rates and the dollar lower. Confusion still reigns as to what event may trigger the Fed’s move into lending an assist.

Disappointing news on home prices kept the markets meandering with a downside bias. More economic reports are on the agenda today with existing home sales and jobless claims taking center stage. After the close, heavyweight Nike will present its quarterly earnings report.

I think that from here on forward any economic reports will be scrutinized even more to see if on any weakness the Fed can be prompted to step in to attempt to right the ship.

Of course, that event by itself would be a clear sign that things are not well in economic wonderland, which may have some dire consequences on market direction. Unless, of course, you believe that the Fed has indeed the power to avoid a slip into another recession.

Fed Speak

Ulli Uncategorized Contact


The markets slipped slightly during the early trading hours yesterday with all eyes feasted on the outcome of the Fed meeting on interest rates.

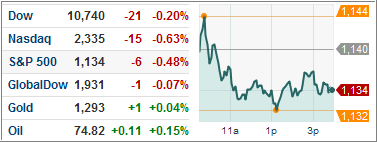
Leaving rates unchanged was pretty much a given, but the accompanying statement was the big unknown. After the release, the markets shot up, as the chart (courtesy of marketwatch.com) above shows, then dropped just as sharply, rebounded and faded into the close.

The Fed made it clear that it worries about the slowness of the recovery. They further cited a “substantial resource slack” with high unemployment and modest income gains, but reiterated that they were “prepared to provide additional accommodation if needed to support the economic recovery.”

Some economists expect the Fed to make that next move at its November meeting, which would provide them with more additional data. The Fed further conceded that economic recovery continues to slow, although there are signs of stabilization.

The immediate beneficiaries of this announcement were gold, due to uncertainty, and bonds, due to lower interest rates. The dollar fell along with oil.

In the end, it was a statement with no earth shattering news and certainly not encouraging when it comes to economic prospects in general.

It makes me wonder if Monday’s rally was a blow-off day, to be followed by a trend reversal. Only time will tell, but I believe that the September rally has been way overdone and the markets, as they sometimes tend to do, have gotten way ahead of underlying realities.

Breakout

Ulli Uncategorized Contact

After repeatedly banging their heads against the S&P; 500’s 1,130 resistance level, the bulls finally broke through this proverbial glass ceiling yesterday with a bang.

It wasn’t even nip and tuck; it was a clear break out of the trading range, with the major indexes surging to their highest level since May. It was surprising to see the market move higher with this much vengeance the day before the Federal Reserve meeting on interest rates, where usually subdued trading is the theme of the day.

Supporting upward momentum were a number of things with one being Lennar homes, which surprised with better than expected earnings offsetting a weak report on home building conditions.

The other good news was that the recession, which began in December 07, was now officially declared to have ended in June 09, according to the National Bureau of Economics (NBER) that dates these kinds of events.

As a consequence, the much talked about potential double-dip recession is now no longer alive, since any new economic slide will be considered a new recession. I am so glad to hear that we have institutions that clarify those types of things for the rest of us…

All major indexes are now trading above their respective 200-day moving averages by about 2%. The S&P; had been riding the range between 1,010 and 1,130 since the end of May before yesterday’s breakout.

We’re continuing to conservatively participate in this rally knowing that Wall Street is capable of climbing a wall of worry; a quick reversal could occur at the drop of a hat if economic assumptions do not turn out as well as anticipated.

Chart courtesy of MarketWatch.com