A Word About Dividend ETFs

Ulli Uncategorized Contact


Dividend ETFs are an important component in income investors’ portfolios. With the need to generate reliable cash flow in today’s zero-interest-rate-environment comes some complacency in that it is assumed that dividend producing ETFs provide a better buffer against sharp market downturns.

I had this conversation with several readers recently, and it is simply an incorrect assumption. Take a look at the above 5-year chart above (courtesy of YahooFinance) comparing the S&P; 500 (SPY) to the widely held dividend ETFs DVY and DTN.

If you follow the crash of 2008 into early 2009, when the market lows were made, you’ll notice that DVY and DTN showed worse performances than the S&P;—by quite a margin.

What that tells you is that dividend paying ETFs are not exempt from bear markets. Consequently, their trends need to be tracked (and stop losses implemented) just like any other equity fund/ETF, if you want to avoid seeing your portfolio get a serious haircut.

Disclosure: Holdings in DVY

Sunday Musings: Long Term Investment Opportunities

Ulli Uncategorized Contact

In various past posts, I have mentioned that it is my belief that, economically speaking, we’re heading down a similar path as Japan did over the past 20 years.

Nothing was learned from their burst real estate bubble, and the same policy mistakes (bailing out failed banks, senseless stimulus packages, etc) have been made and are continuously being implemented.

I hope I am wrong, but if I am not, how will an investor deal with a similar scenario and be able to grow his portfolio?

Business Insider featured an excellent chart by Doug Short with the title “Check Out All Of The Huge Rallies Japan Has Seen on Its way Down The Tubes:”


[Double click to enlarge]

A picture is worth a thousand words, and this one is no different.

Notice the stunning market drops of the Nikkei 225 and the subsequent mind boggling recoveries. In the end, after 20 years of zigzagging, you would have ended up on the losing side of the ledger had you simply bought and hold your investments.

This time period shows 6 bear market drops sufficient in size to wipe out all bullish periods and then some. The only way to survive this type of environment is to avoid the bulk of the down market whenever possible. Trend Tracking along with the disciplined use of sell stops will certainly be a better choice to accomplish that goal than mindless buying and holding.

We already have gotten a similar taste of the above as the past decade in the U.S. was a lost one with the S&P; 500 having ended up to the downside. I am not being negative here, but I’m merely trying to point out that bear markets will continue to be with us from time to time, and that they have the awesome power to wipe out your previous investment efforts.

No one can tell what the future will hold, or whether a Japan type scenario will play out here in the U.S., but it is wise to be prepared for these types of very real possibilities as opposed to simply having no plan of action at all.

Reader Q+A: M-Index Rankings

Ulli Uncategorized Contact


Reader Frank had the following question:

You say that you sort the stat sheets by the M-index. For funds that have the same M-index are they truly in descending momentum sequence?

For example, there may be 10 or 15 funds with an M-index of 4. Does the 1st #4 fund have a higher momentum than the 2nd or are they just listed randomly within the ranking? Am I better off choosing a fund listed higher within a given ranking?

Let’s say there are 10 ETFs all ranked with an M-Index of 4. That means they have equal weighting, but they are randomly listed within the ranking.

You now need a tiebreaker to decide which one maybe appropriate for you. While there are several approaches, I focus on only two other numbers:

1. The DD% column: It tells me by how much a fund has come off its recent high. The number 0.00% means that it has just made a new high and is in tune with current market momentum.

2. The 4wk column: That too shows more recent strength as opposed to longer term momentum, which is represented in the M-Index itself.

For example, take a look at the chart above (listing of Top 100 funds as of 9/9/10). There are 3 funds listed, which have an M-Index of “6.” Based on the DD% column, DEF would be my choice since it has just made a new high, while the other 2 have come off their highs considerably.

Despite their higher 4wk momentum numbers, my choice would still be DEF. Assume for a moment that all 3 had DD% numbers of 0.00%; then my selection would be FKASX, since it has the highest 4wk momentum number.

Again, as I have posted before on several occasions, if you are selecting ETFs, be sure to use only those with high daily average volume figures due to lower bid/ask spreads and superior liquidity.

Disclosure: No holdings

No Load Fund/ETF Tracker updated through 9/16/2010

Ulli Uncategorized Contact

My latest No Load Fund/ETF Tracker has been posted at:

http://www.successful-investment.com/newsletter-archive.php

Slow and steady was the theme of the week, as the S&P; 500 knocked against overhead resistance.

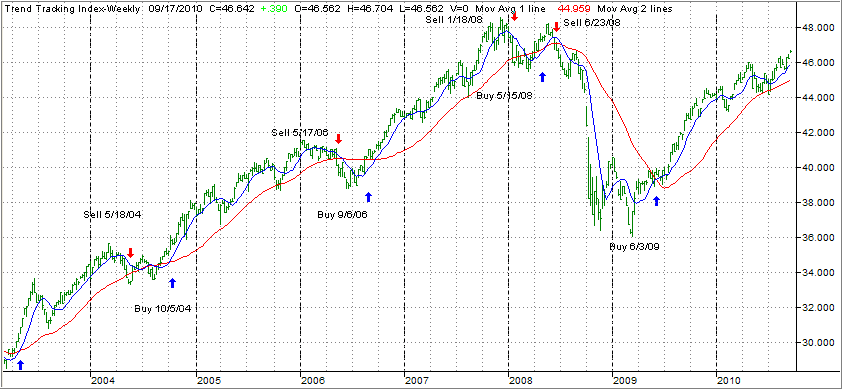
Our Trend Tracking Index (TTI) for domestic funds/ETFs held above its trend line (red) by +3.74% (last week +3.03%) and remains in bullish mode.


The international index broke back above its long-term trend line by +4.21% (last week +2.76%). A new Buy signal was triggered effective 9/7/10. If you decided to participate, be sure to use my recommended sell stop discipline.

[Click on charts to enlarge]
For more details, and the latest market commentary, as well as the updated No Load Fund/ETF Tracker StatSheet, please see the above link.

Bumping Against Resistance

Ulli Uncategorized Contact


So far, overhead resistance, pegged to be the 1,130 level of the S&P; 500, held twice yesterday, as the index backed off, but still closed within striking distance.

It seems to me that the rally from the lows of the trading range appears to be getting a little tired as the market may have gotten way ahead of itself. Evidence of more economic growth is nonexistent, but is the most important factor in sustaining this rally.

Yesterday’s weaker than expected growth in industrial production was largely ignored as was the announcement that the Japanese government sold the yen in an attempt to push it lower against the dollar. History has shown that those types of interventions can have the desired effect, but only on a temporary basis. Long term, all past currency interventions have failed.

Today, the market will face important earnings reports. Among others, FedEx is the most watched as it often signals the direction the economy may be headed. Additionally, initial jobless claims will be reported, which can always be a market moving event.

Try not to get too sidetracked by day to day fluctuations and keep the big picture in mind.

While we’ve bounced nicely of the bottom of the trading range, we have now reached the top level. To my way of thinking, smoke and mirrors will not be enough to push this market decisively higher.

Real supportive economic evidence will be (eventually) required to justify these lofty levels. In the absence of real facts, we could find ourselves moving back down to the lower end of the range in a hurry. Always be aware that markets move down a lot faster than they move up.

Gold Closes At A Record

Ulli Uncategorized Contact


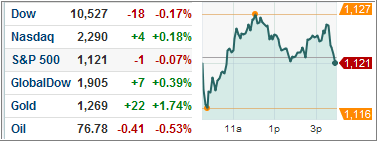
While the S&P; 500 slipped yesterday, after 4 days of gains, gold rallied and closed at a record high. Speculation has it that the Fed will purchase some $1 trillion in bonds to support the economy. At the same time, the dollar fell, which helped silver and commodities and pushed interest rates lower.

The major indexes, with the exception of the Nasdaq, slipped slightly as overhead resistance remained. The pullback was minor, and I would not be surprised to see another attack at the 1,130 level of the S&P; 500.

The Fed’s purchase of $1 trillion in treasuries is widely regarded as a play to improve economic stability in the financial markets while, at the same time, be a boost to GDP by as much as 0.4%. Whether this is just simply ivory tower theory or will actually work as planned has yet to be seen.

Retails sales climbed for the second straight month, which was interpreted as reassuring since economists actually had expected a decline. Some stimulus via bigger back-to-school discounts, tax-free holidays and extended jobless benefits may have lent support to these climbing numbers.

It makes me wonder if anything can possibly be sold these days without prodding or the use of special incentives.

Chart courtesy of marketwatch.com