
- Moving the markets
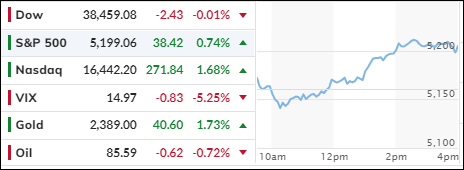
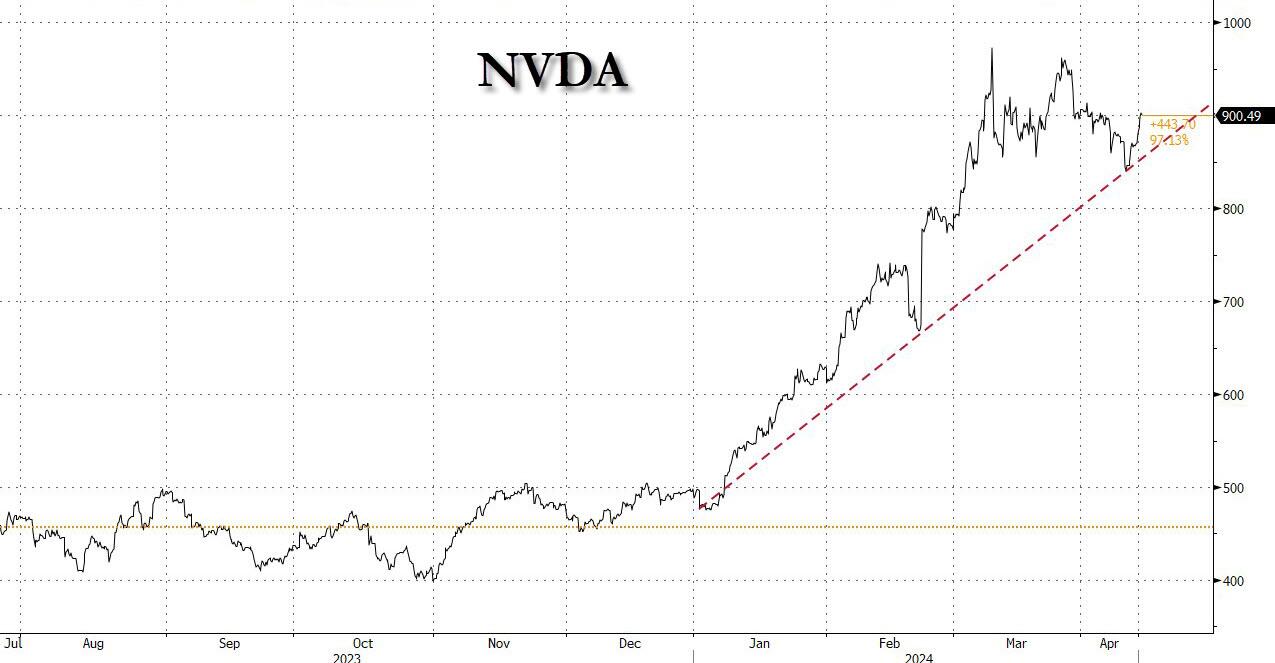
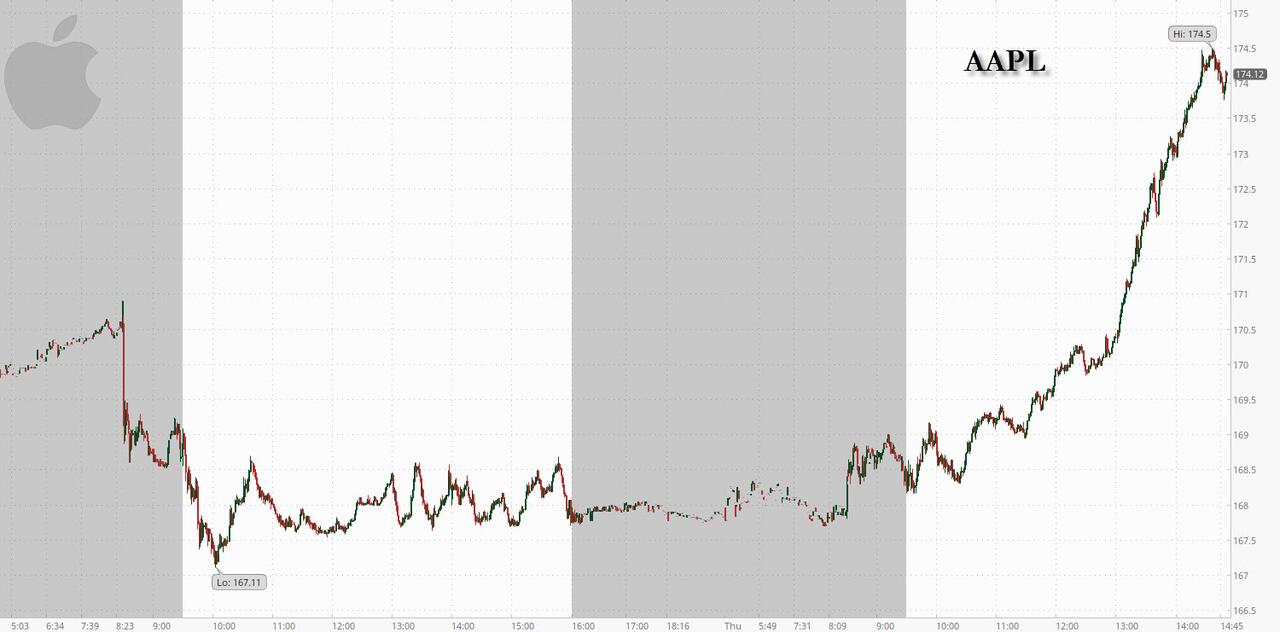
Today’s stock market witnessed a remarkable turnaround, with technology stocks leading the charge. The earlier concerns about ongoing inflation were overshadowed as tech giants like Nvidia soared nearly 4%, while other prominent players such as Amazon and Alphabet each advanced over 2%. Amazon’s shares reached unprecedented heights, and Apple enjoyed its most significant gain of the year with a 3% increase.
The Producer Price Index (PPI) for March reported a modest rise of 0.2%, falling short of the 0.3% predicted by economists, which eased some of the tension following Wednesday’s sell-off triggered by an unexpected surge in consumer goods and service prices. The Core CPI, excluding food and energy, also rose by 0.2%, aligning with expectations.
Despite this, New York Fed President John Williams’ remarks today suggested no immediate policy shifts, a stance that may dishearten traders looking for more aggressive action.
In the wake of a higher-than-anticipated Consumer Price Index (CPI) for March revealed on Wednesday and Federal Reserve meeting minutes indicating ongoing concerns about reaching the central bank’s 2% inflation target, it appears traders are adjusting their outlook. The realization is setting in that taming inflation may be a more formidable challenge than previously thought.
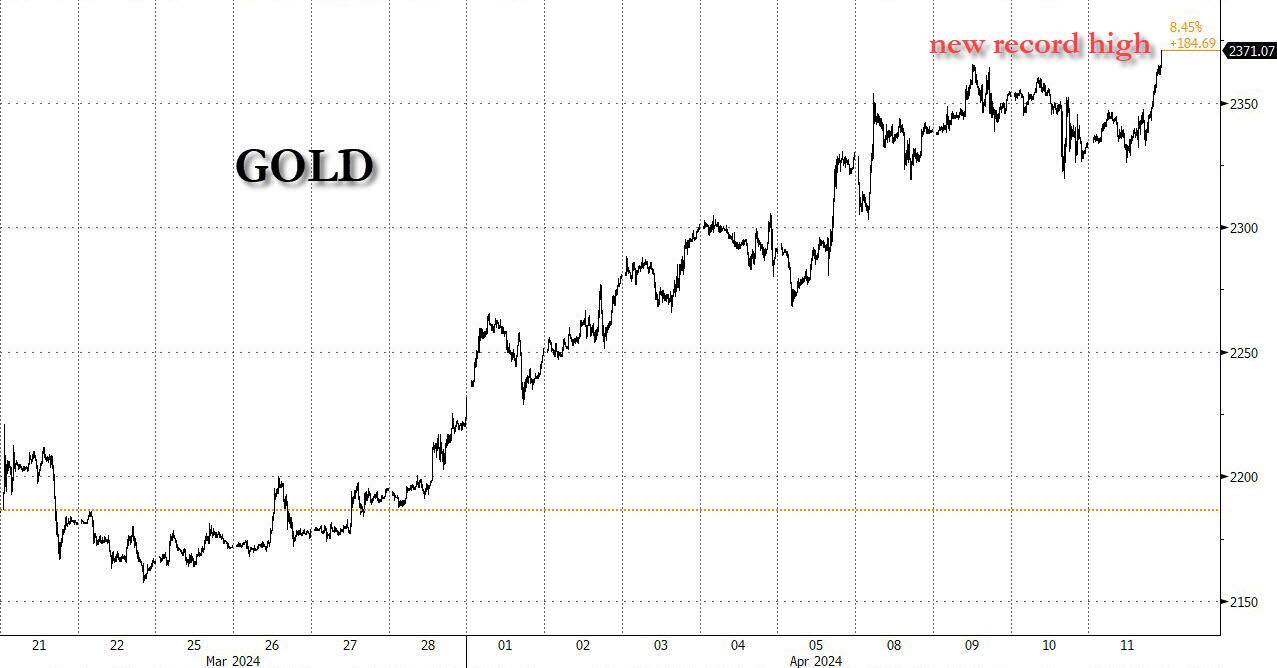
The buying frenzy wasn’t limited to the ‘Magnificent Seven’; gold, the recent favorite among investors, also experienced a surge, hitting a new all-time high of over $2,370.
As we close another tumultuous trading session, the financial community turns its attention to the upcoming earnings season. With major banks poised to disclose their first-quarter results tomorrow, one can’t help but wonder:
Will the big banks’ earnings reflect the resilience seen in today’s market comeback?
2. Current “Buy” Cycles (effective 11/21/2023)
Our Trend Tracking Indexes (TTIs) have both crossed their trend lines with enough strength to trigger new “Buy” signals. That means, Tuesday, 11/21/2023, was the official date for these signals.
If you want to follow our strategy, you should first decide how much you want to invest based on your risk tolerance (percentage of allocation). Then, you should check my Thursday StatSheet and Saturday’s “ETFs on the Cutline” report for suitable ETFs to buy.
3. Trend Tracking Indexes (TTIs)
The stock market began on a low note but experienced a significant recovery, particularly in the technology sector. This upswing helped the S&P 500 and Nasdaq to overcome earlier losses and finish in positive territory.
The rally was supported by a Producer Price Index (PPI) report that indicated lower inflation than anticipated.
Although our TTIs decreased slightly, they did not change our overall optimistic outlook on the market’s direction.
This is how we closed 4/11/2024:
Domestic TTI: +8.72% above its M/A (prior close +8.80%)—Buy signal effective 11/21/2023.
International TTI: +8.54% above its M/A (prior close +8.66%)—Buy signal effective 11/21/2023.
All linked charts above are courtesy of Bloomberg via ZeroHedge.
———————————————————-
WOULD YOU LIKE TO HAVE YOUR INVESTMENTS PROFESSIONALLY MANAGED?
Do you have the time to follow our investment plans yourself? If you are a busy professional who would like to have his portfolio managed using our methodology, please contact me directly to get more details.
—————————————————————-
Contact Ulli