
ETF Tracker StatSheet
You can view the latest version here.
WARSH PICK CALMS FED FEARS – STOCKS DIP, METALS PULL BACK
- Moving the market
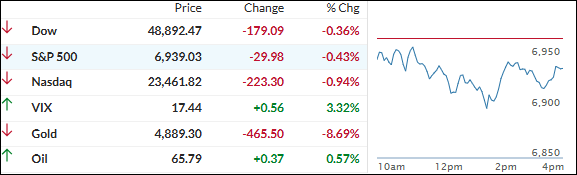
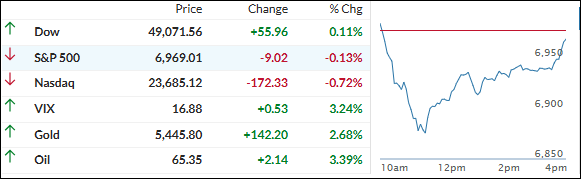
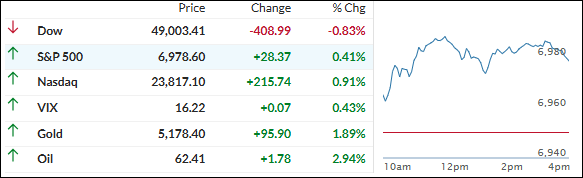
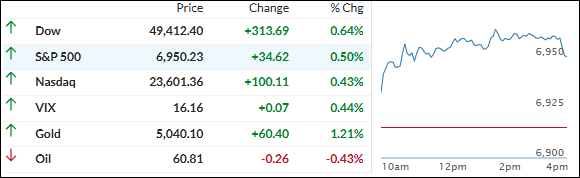
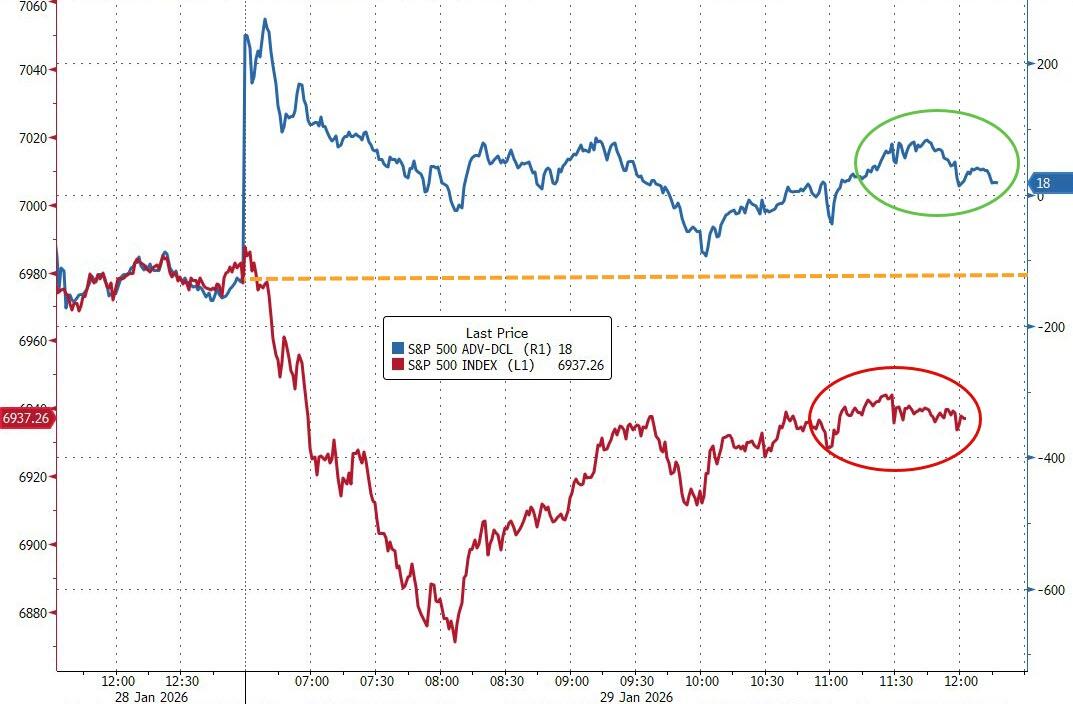
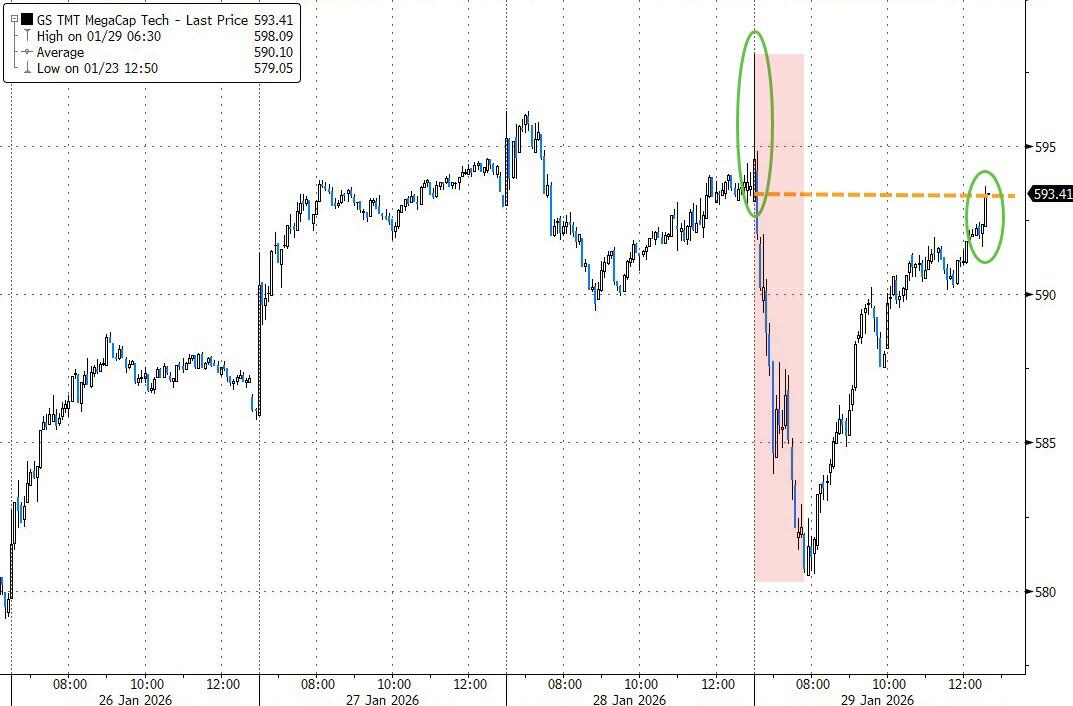
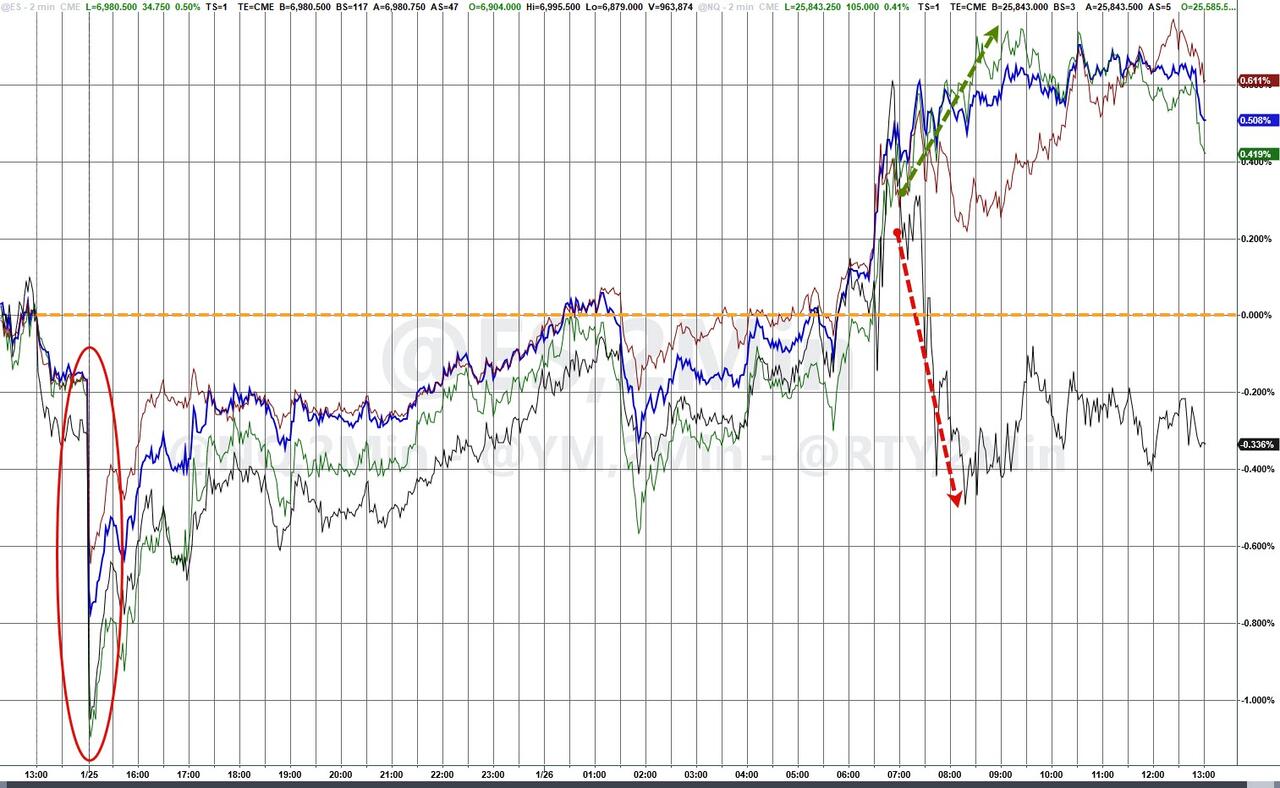
The major indexes headed lower pretty much all day, with tech shares staying in a funk.
Traders were largely okay with President Trump’s pick of Kevin Warsh to lead the Federal Reserve—his experience as a former Fed governor and occasional hawkish stance on inflation eased some worries about Fed independence.
Markets see him as someone who might push for lower rates short-term (what Trump wants) but won’t just rubber-stamp every White House wish, preserving some credibility for policy.
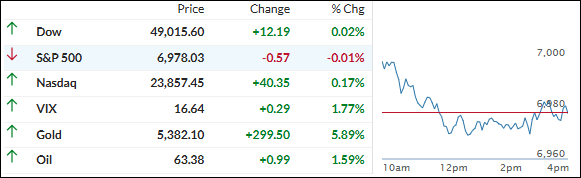
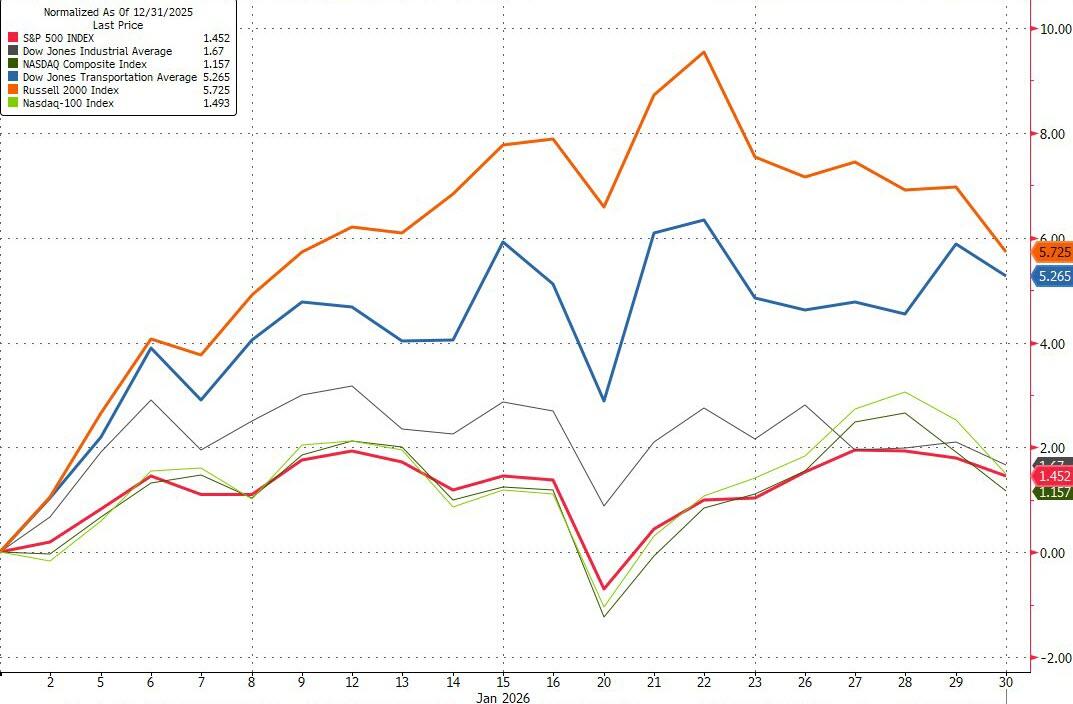
That said, stocks couldn’t shake the weakness. The S&P 500, Dow, and Nasdaq are still on track for a positive January—each up more than 1% for the month so far.
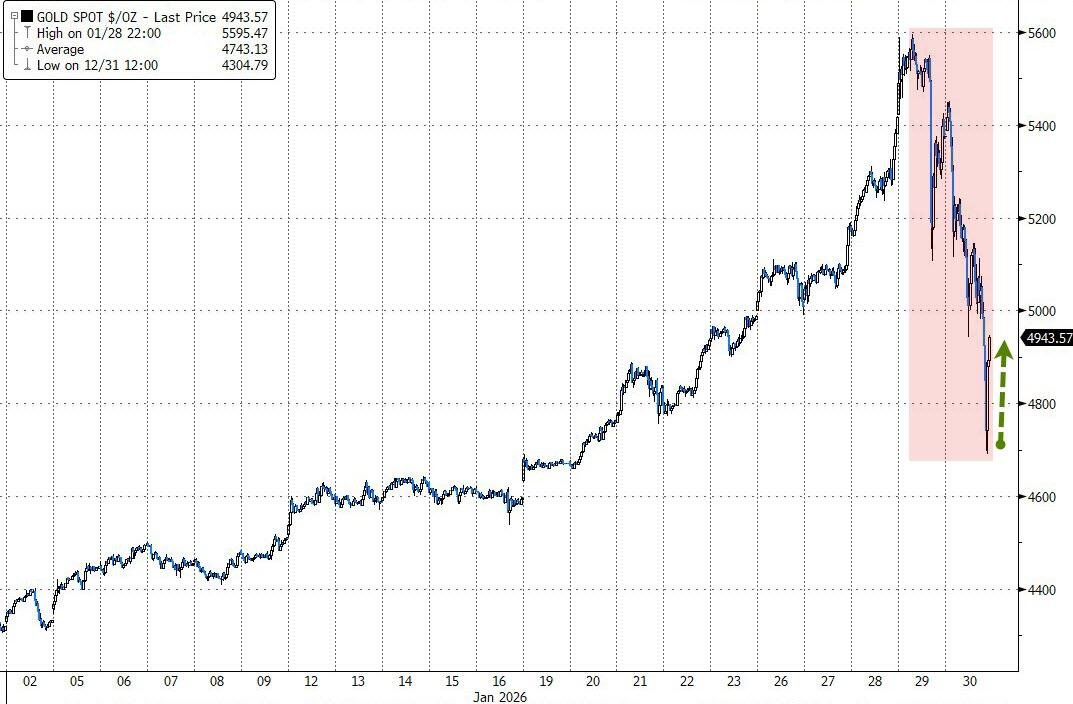
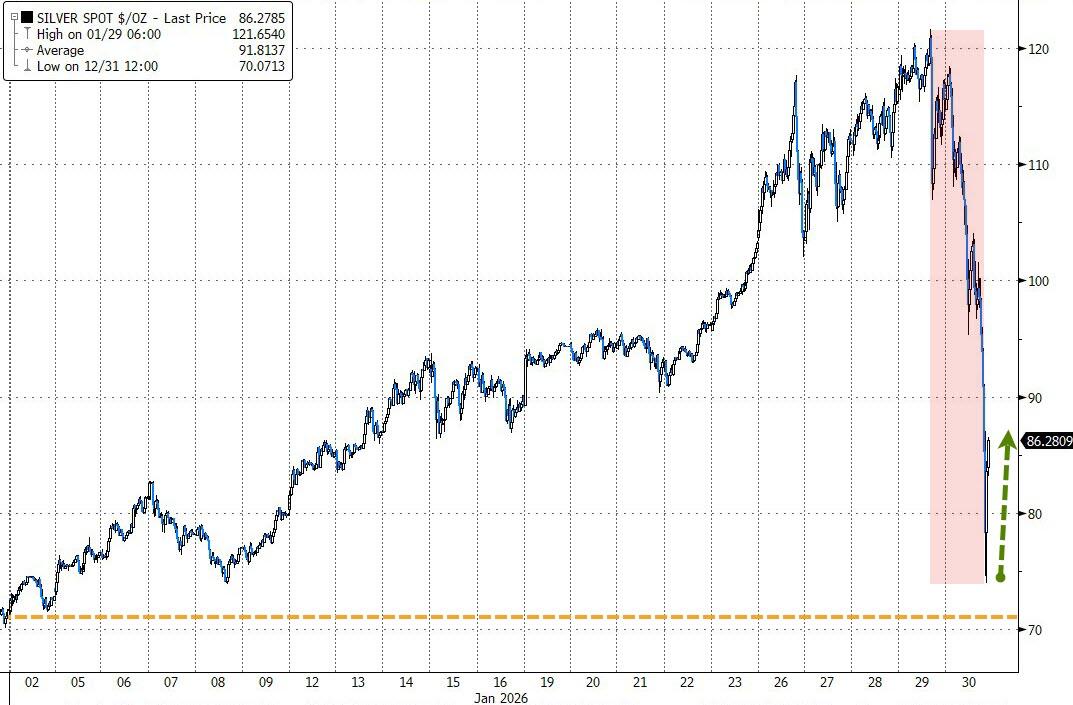
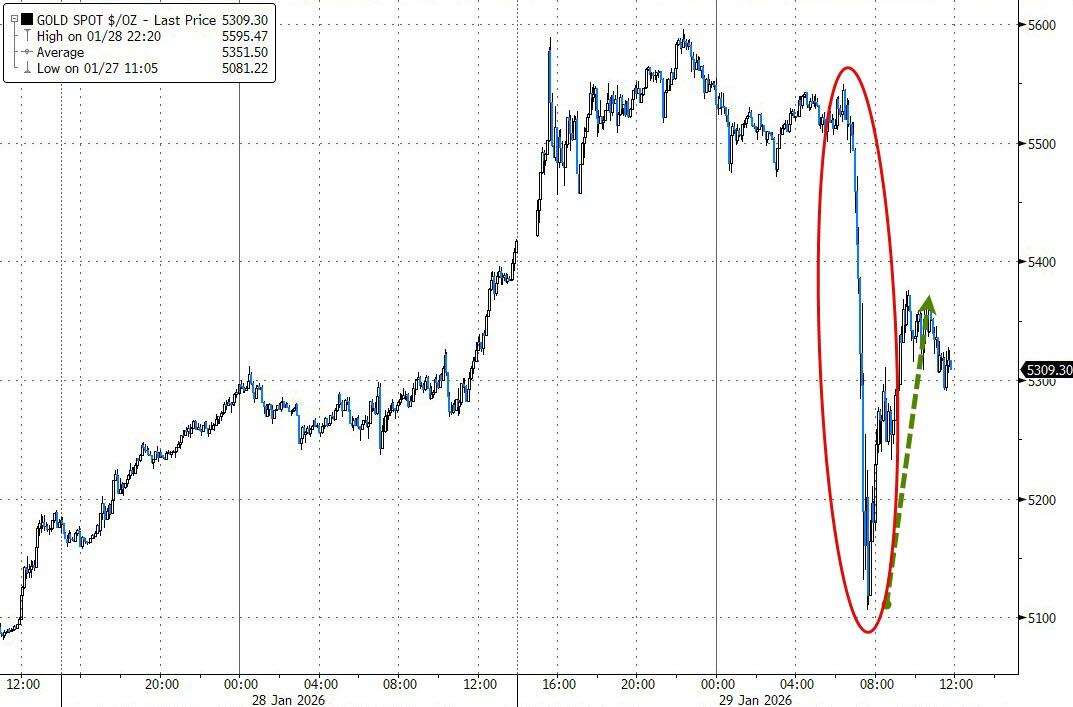
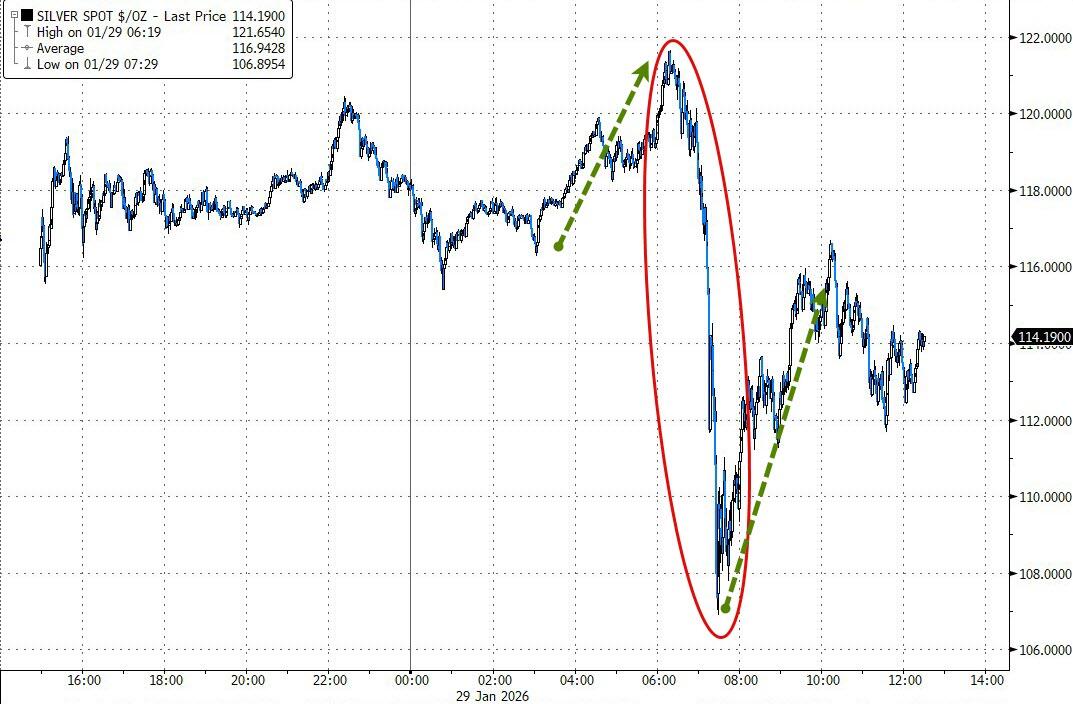
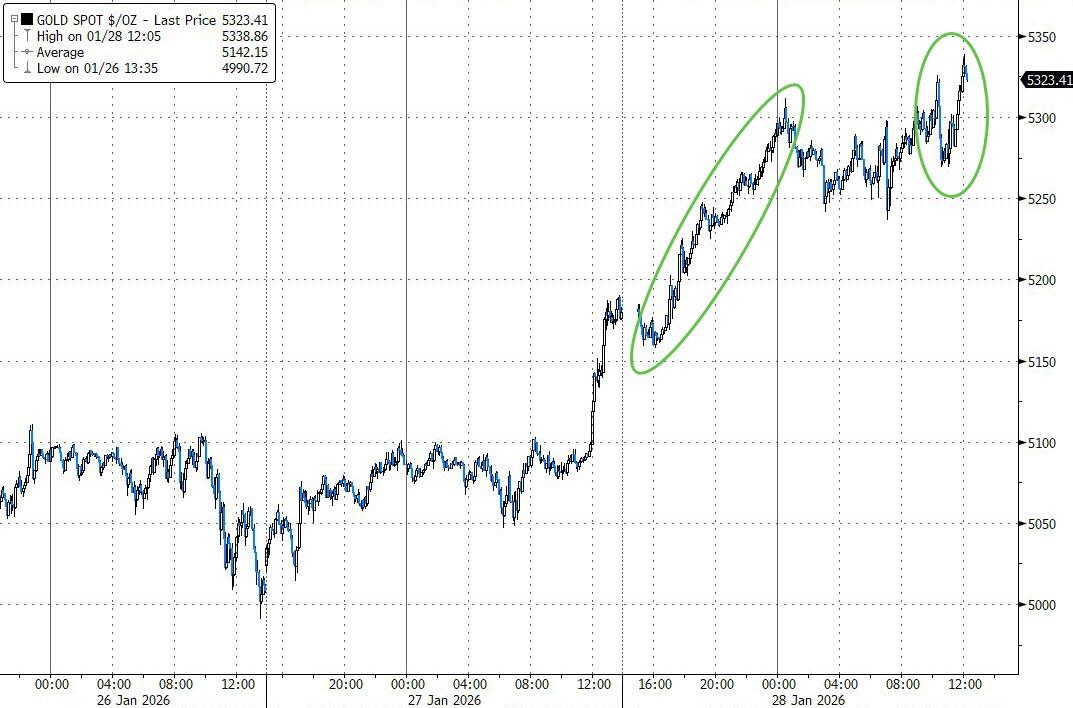
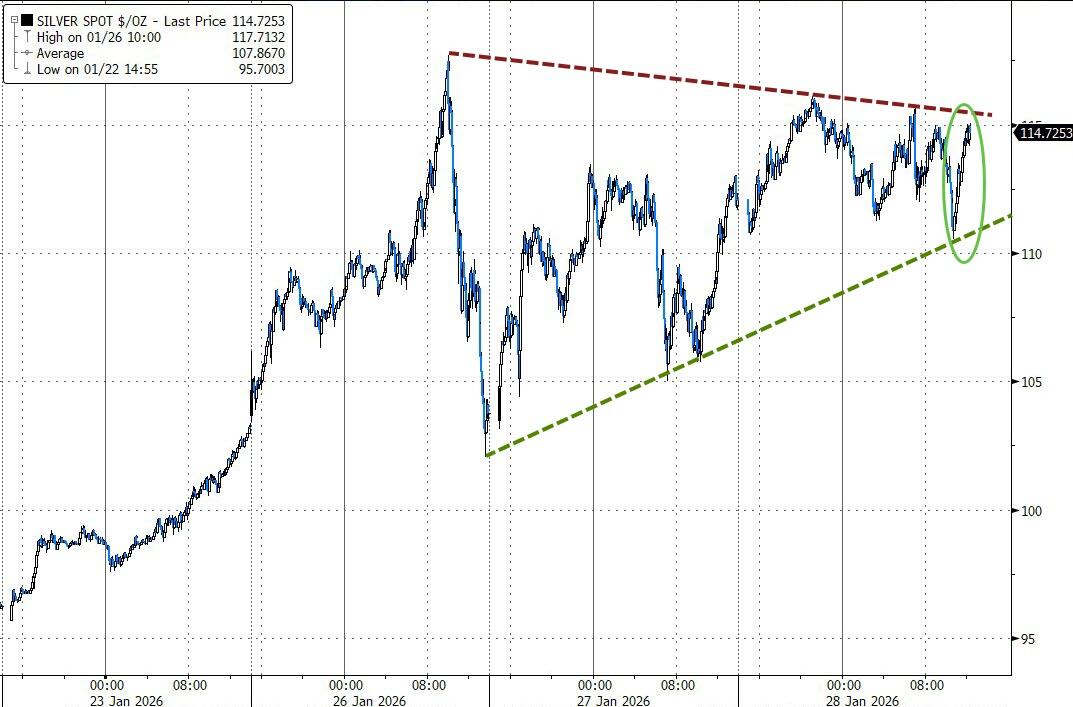
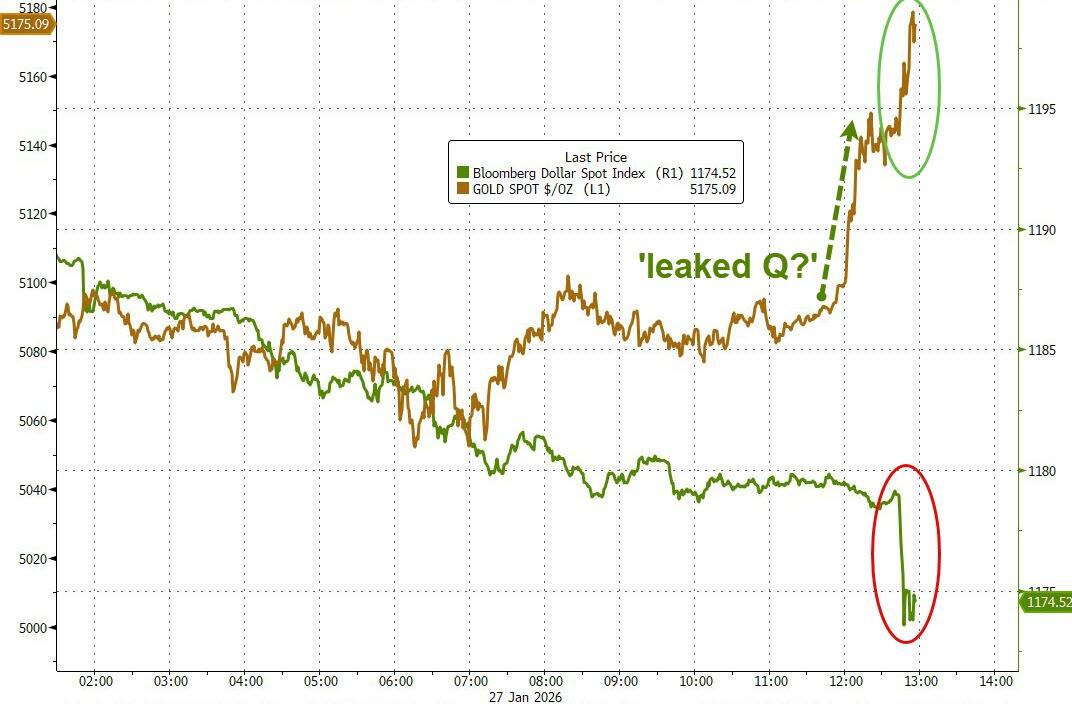
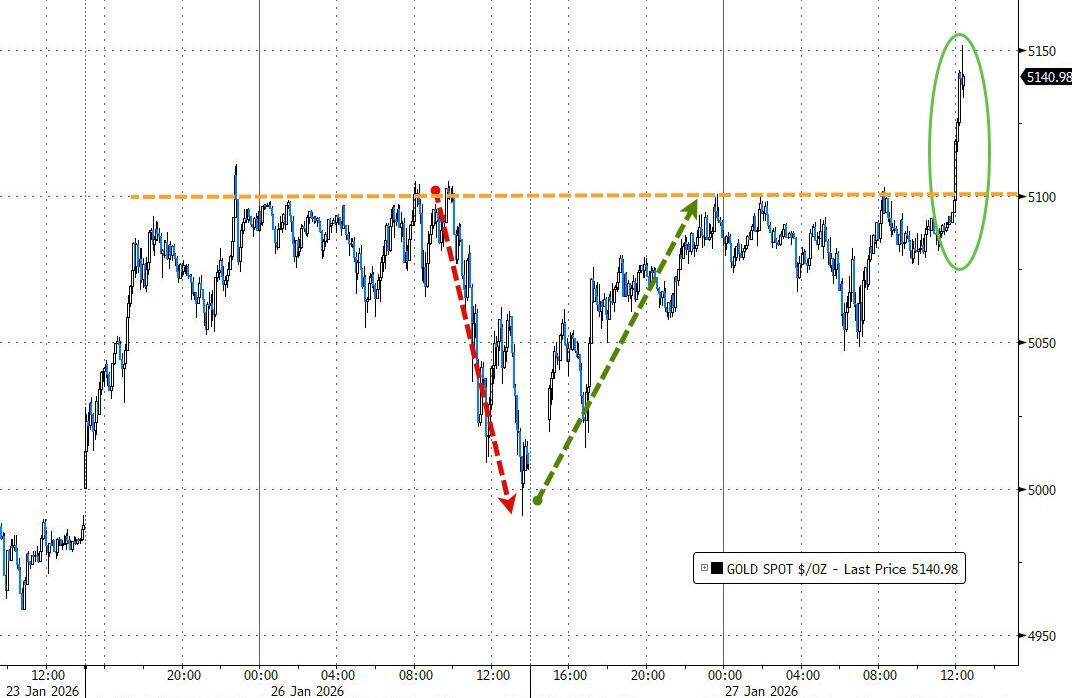
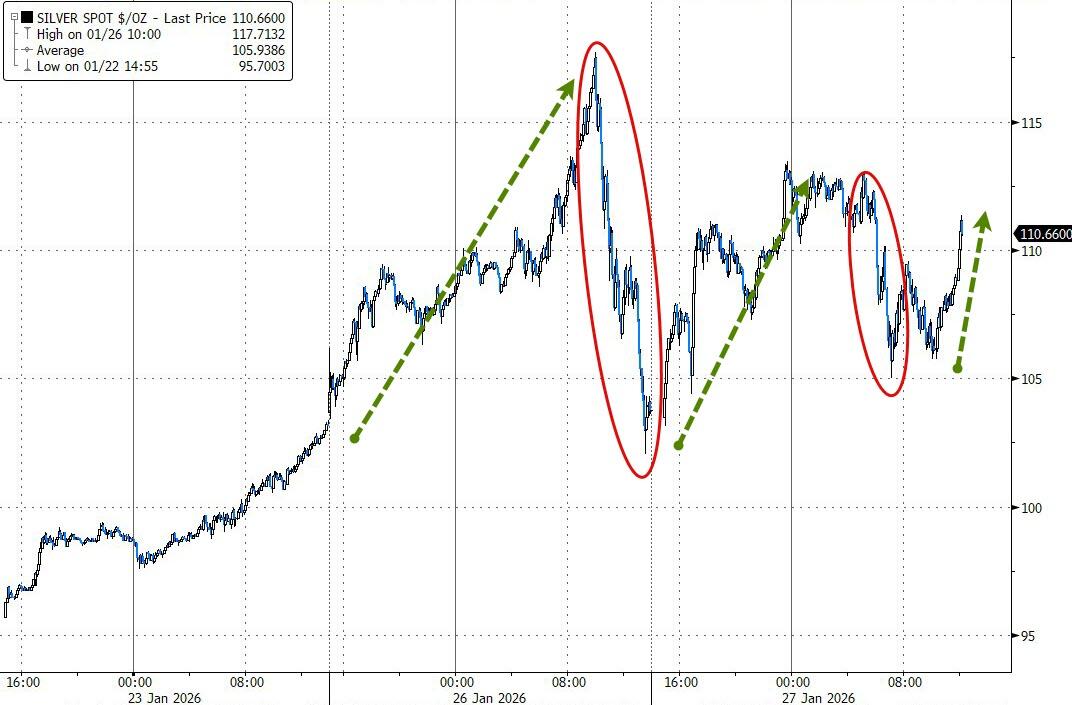
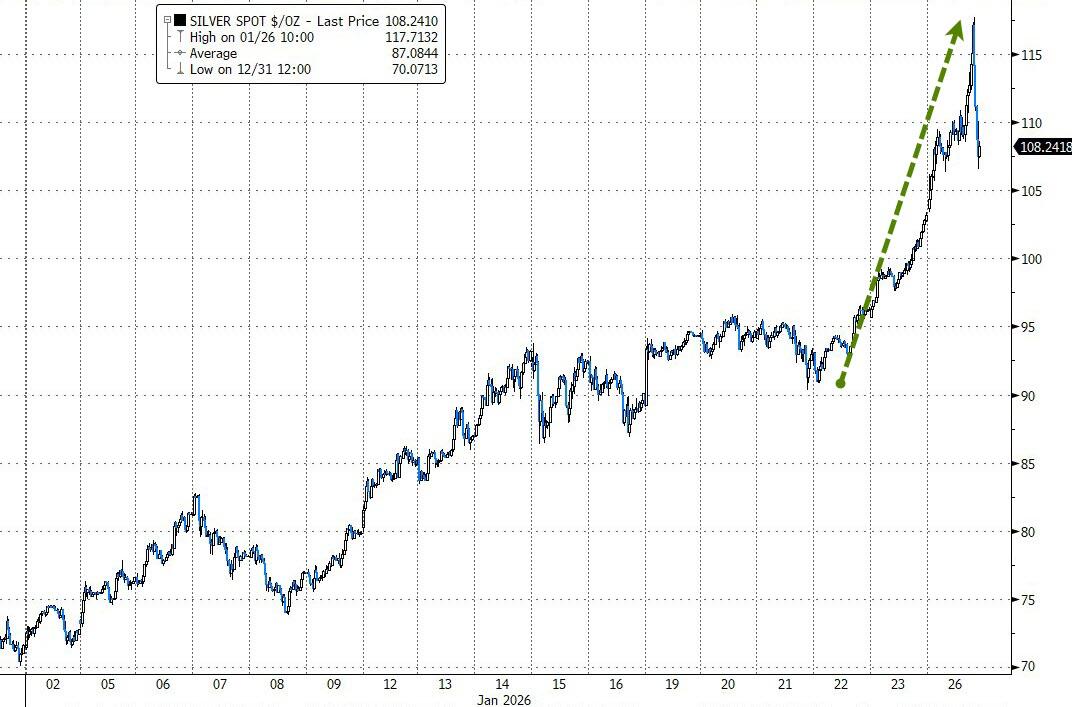
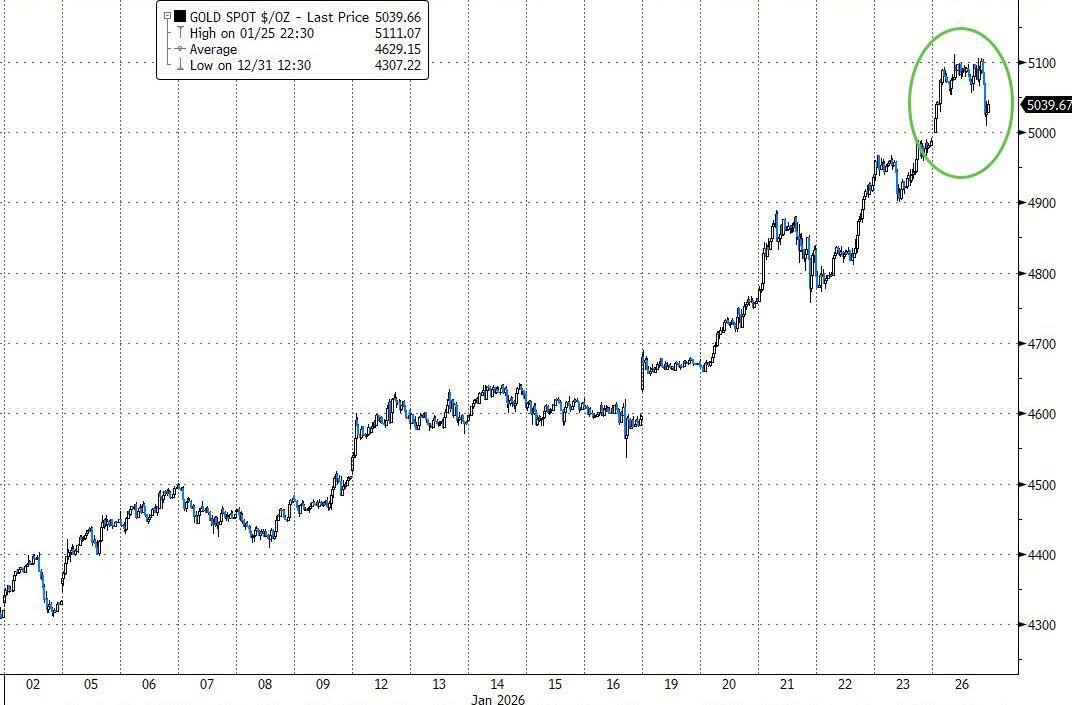
Gold spot prices fell 16% from yesterday’s highs, silver plunged 39%, signaling comfort with Warsh’s more hawkish lean. Even after today’s sell-off, gold and silver remain way higher for the month (+12% and +14%) and for the past year (+72% and +164%).
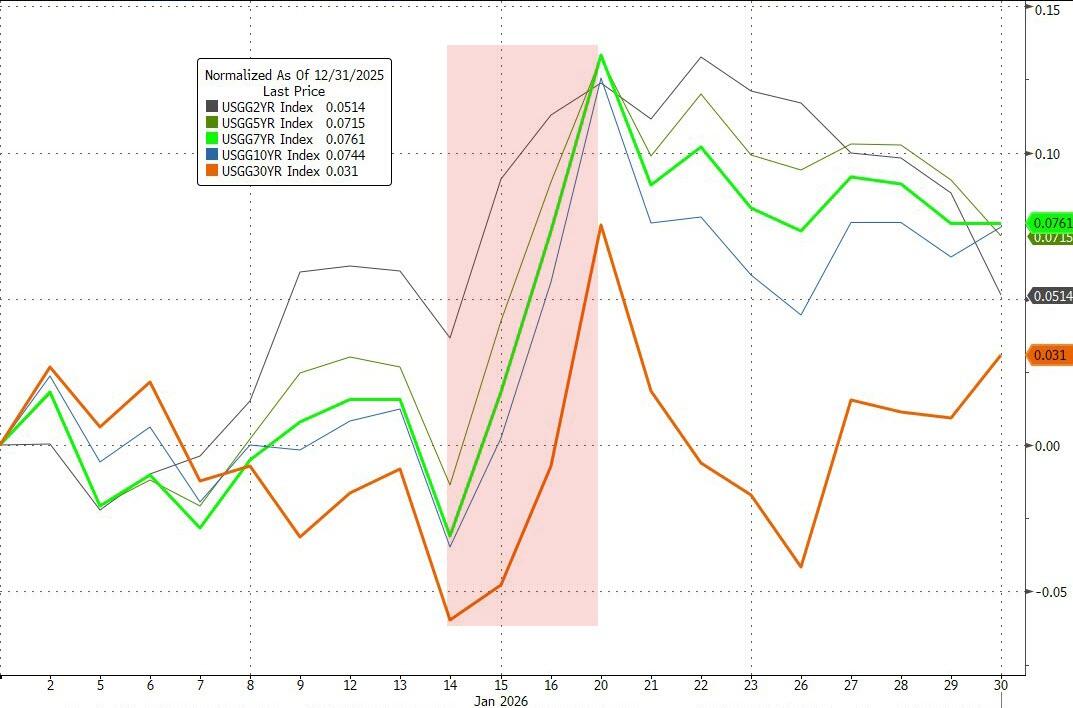
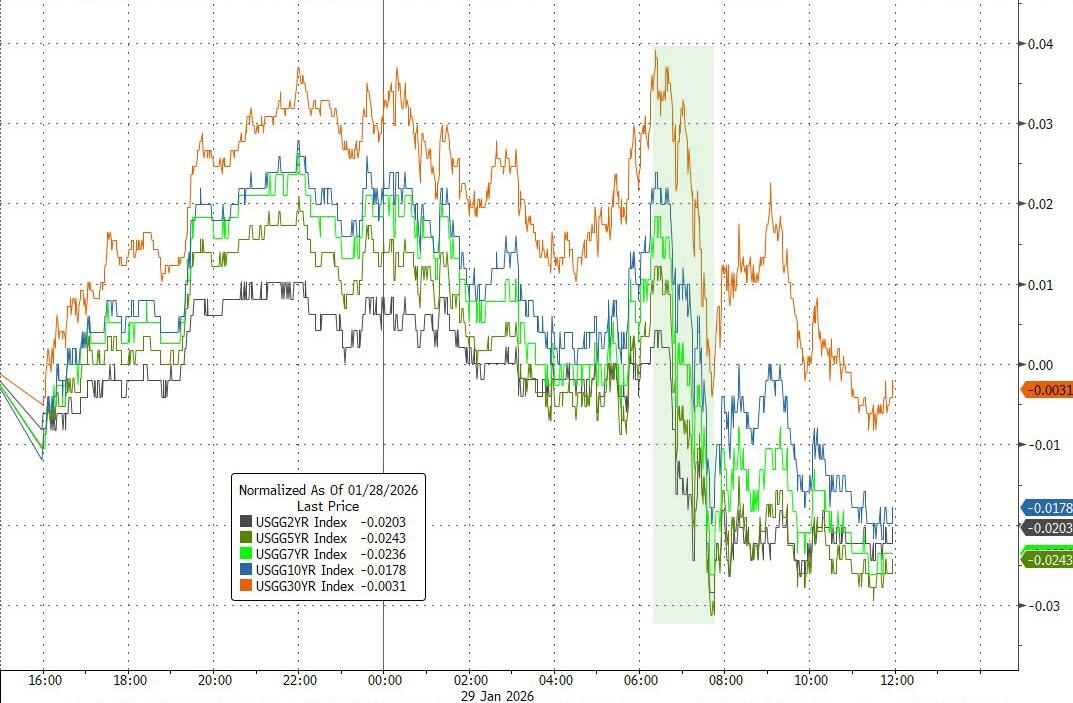
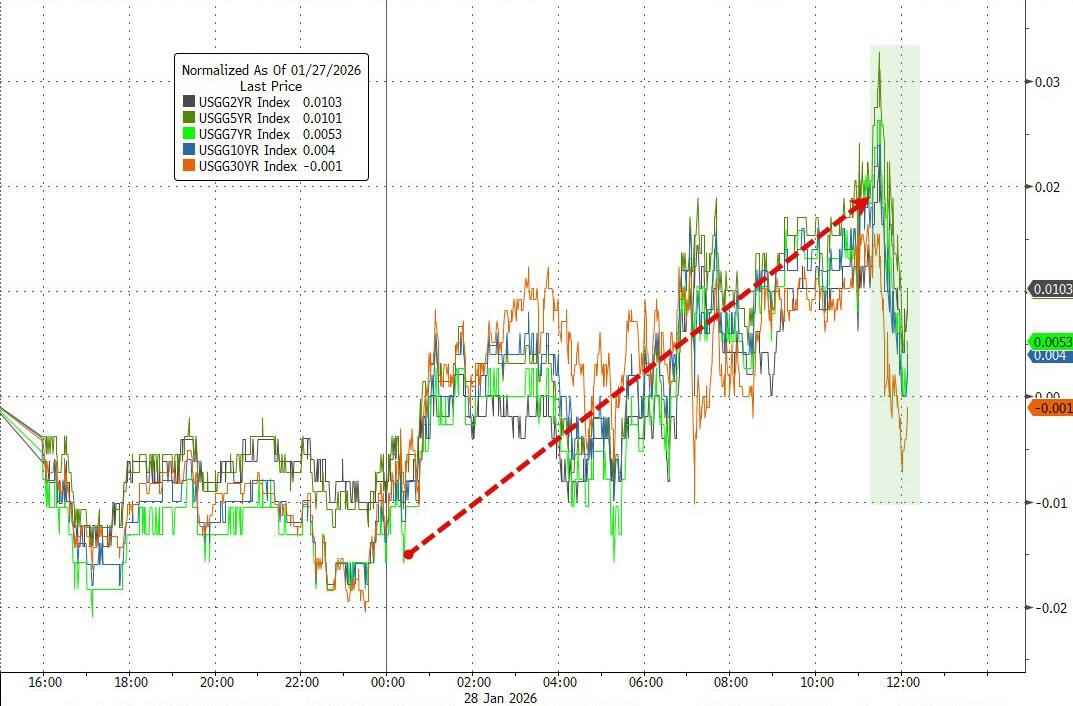
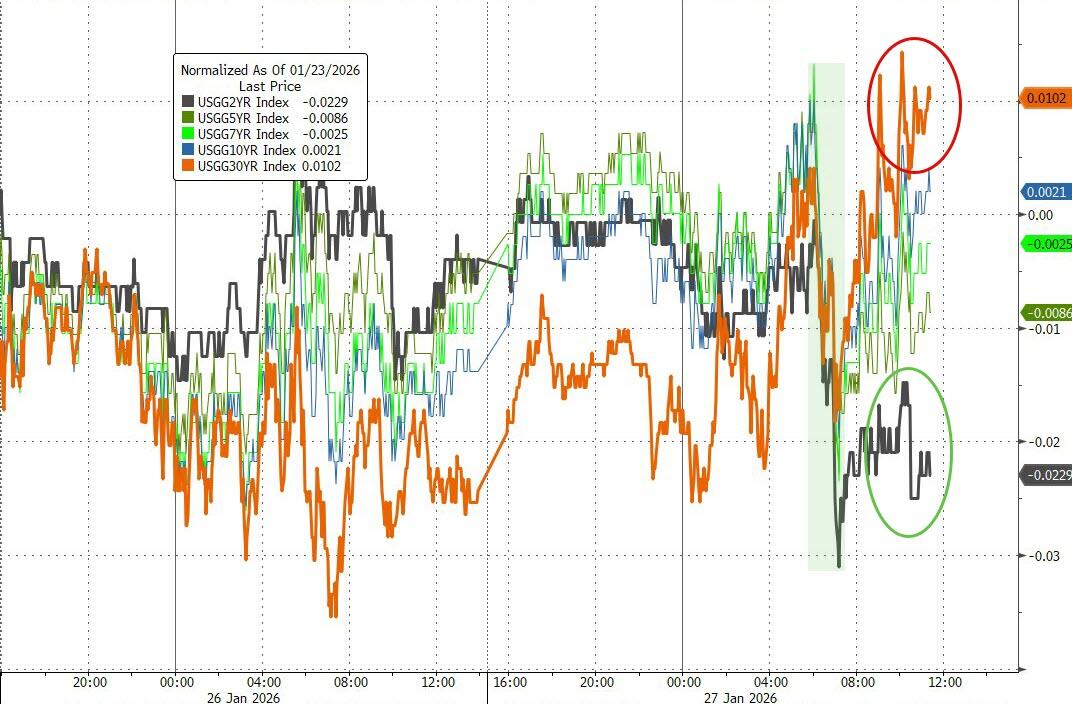
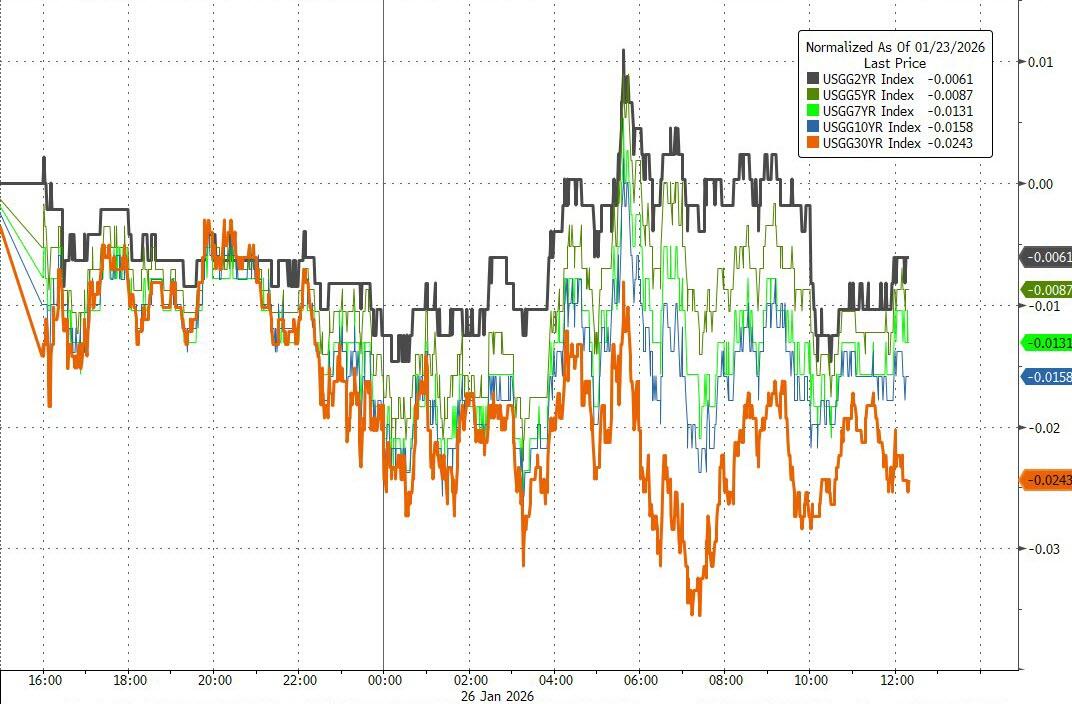
Bond yields ticked higher after hotter-than-expected December core producer price index data (up 0.7% vs. the expected 0.3%). Apple inched lower despite beating Q1 earnings and revenue (helped by strong iPhone sales), while SanDisk popped 22% on upbeat guidance.
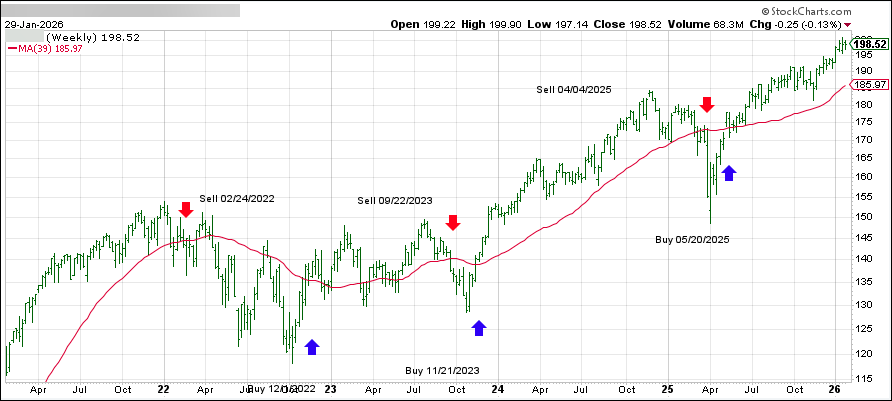
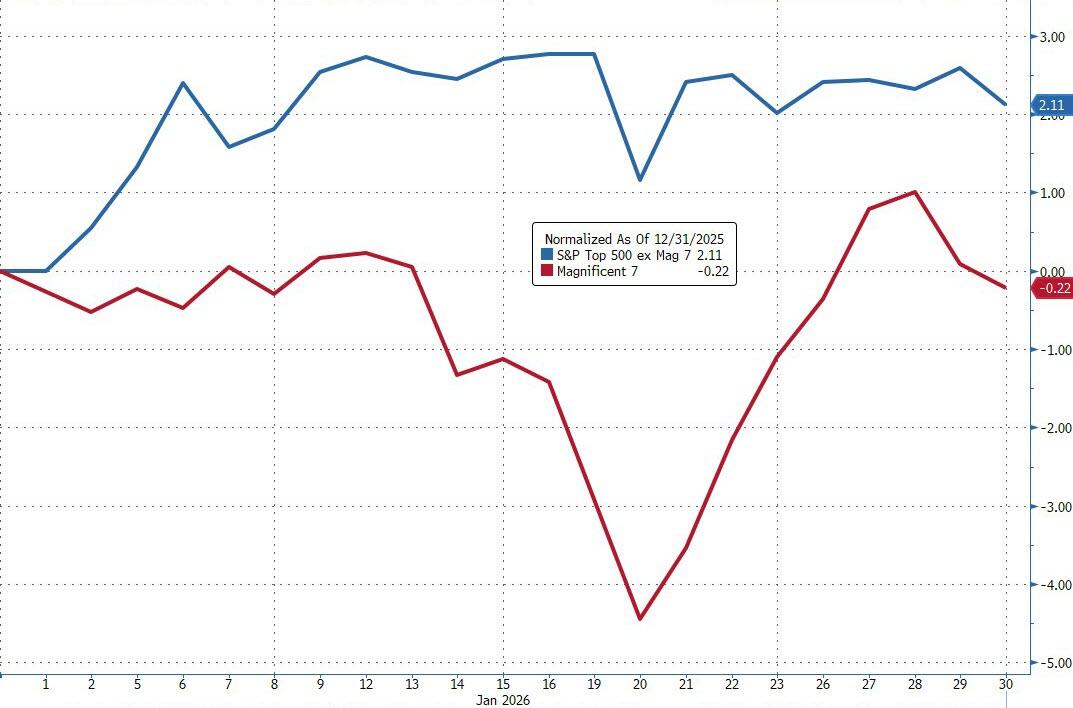
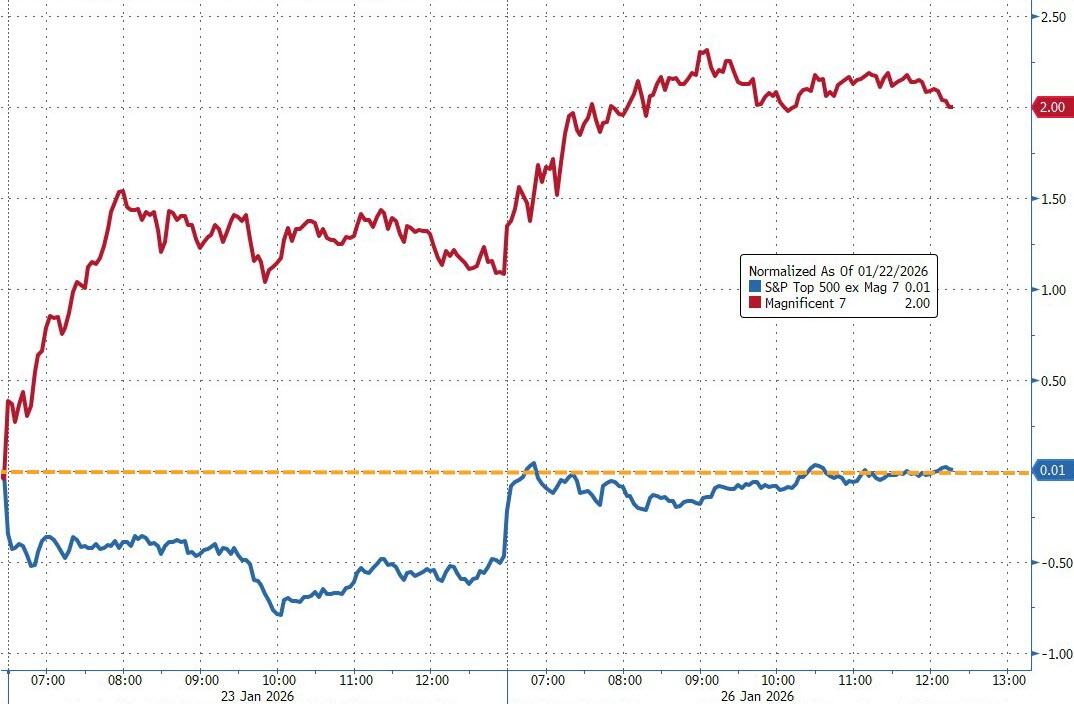
Equity markets were volatile this week but finished January higher overall—small caps led, Nasdaq lagged, and the Mag 7 basket ended the month in the red.
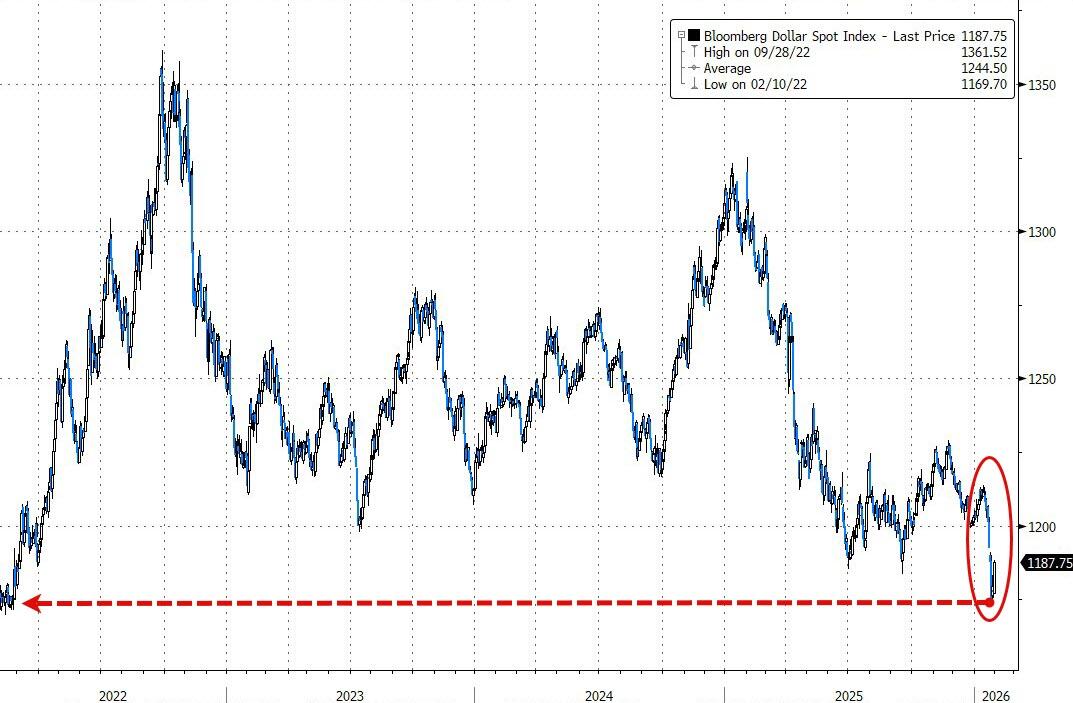
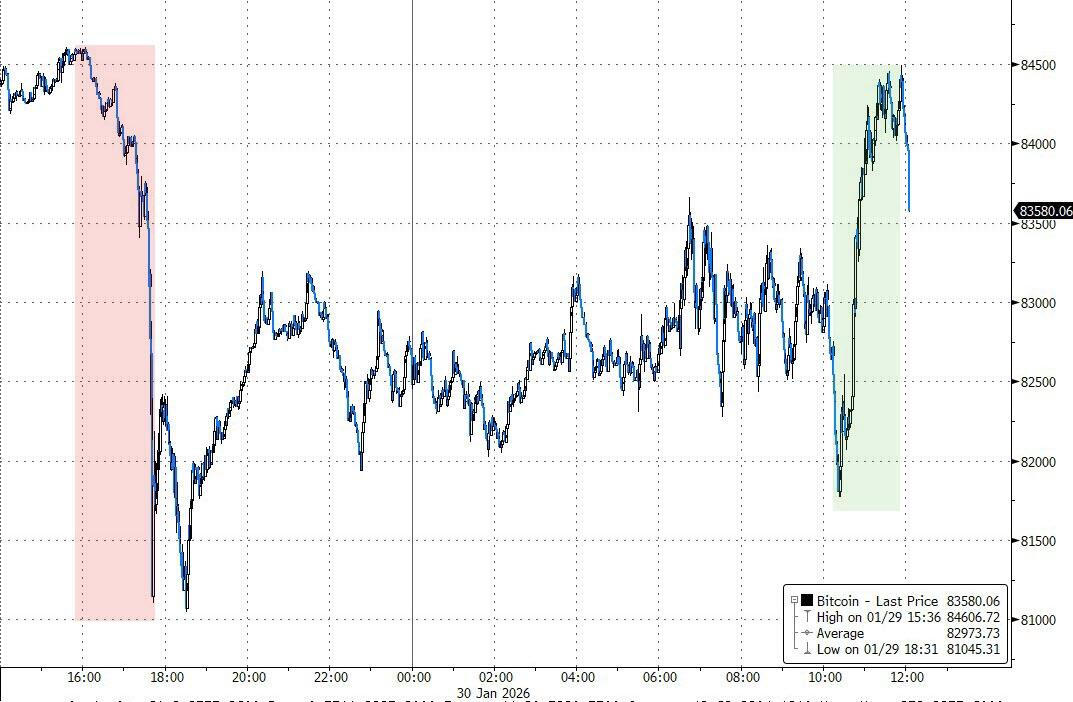
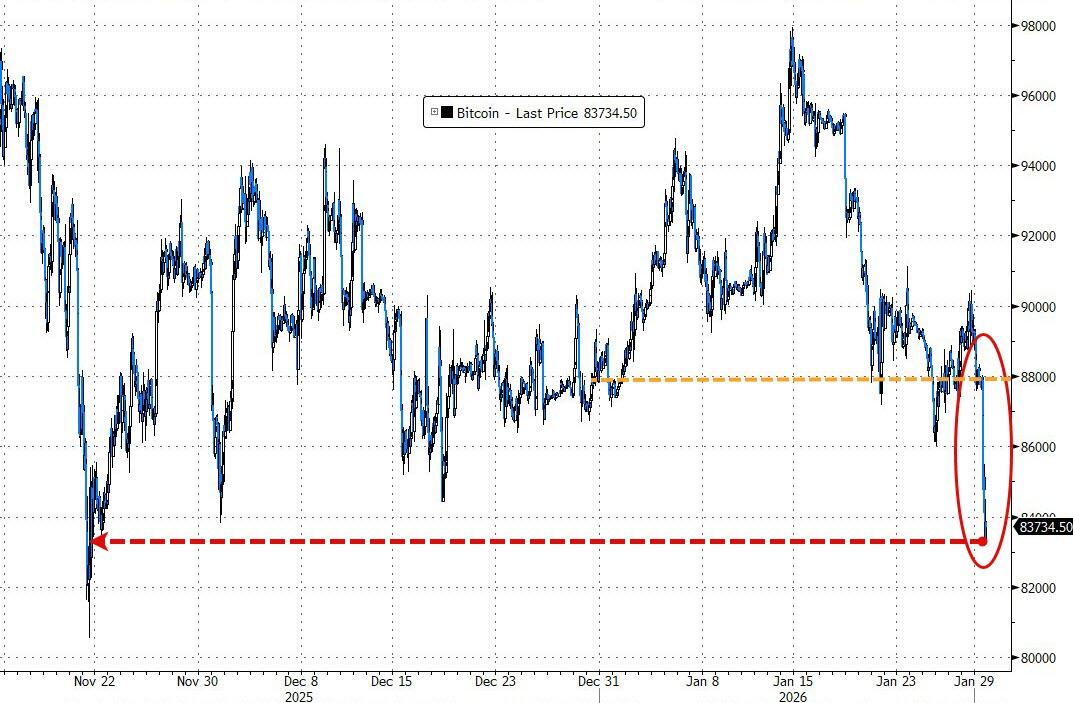
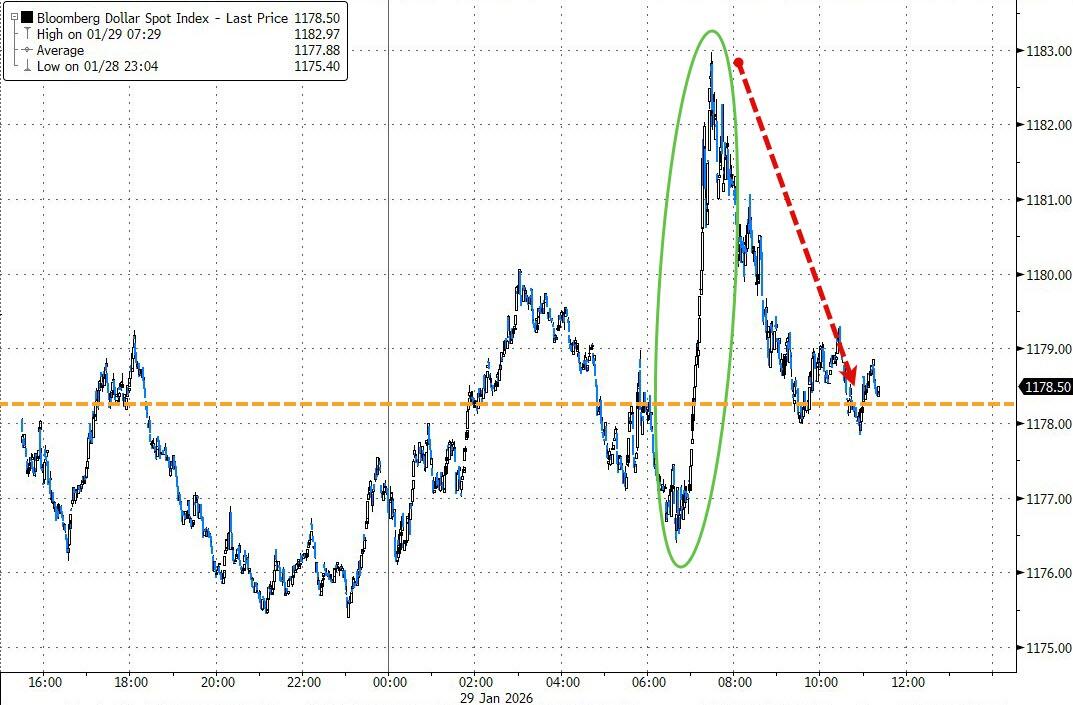
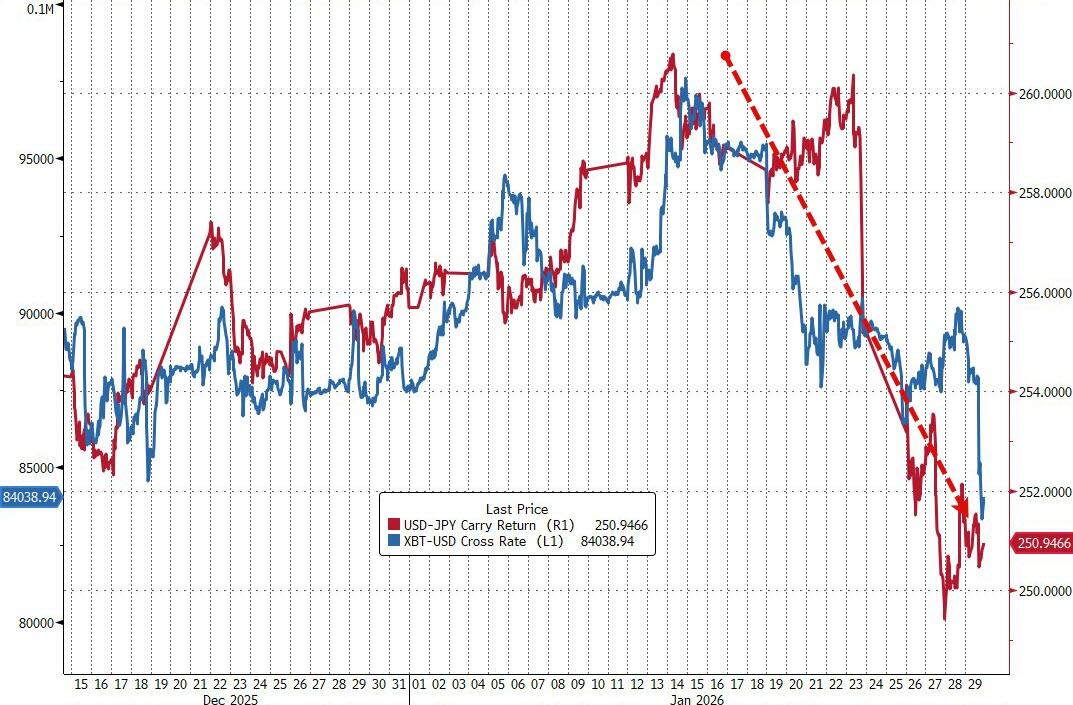
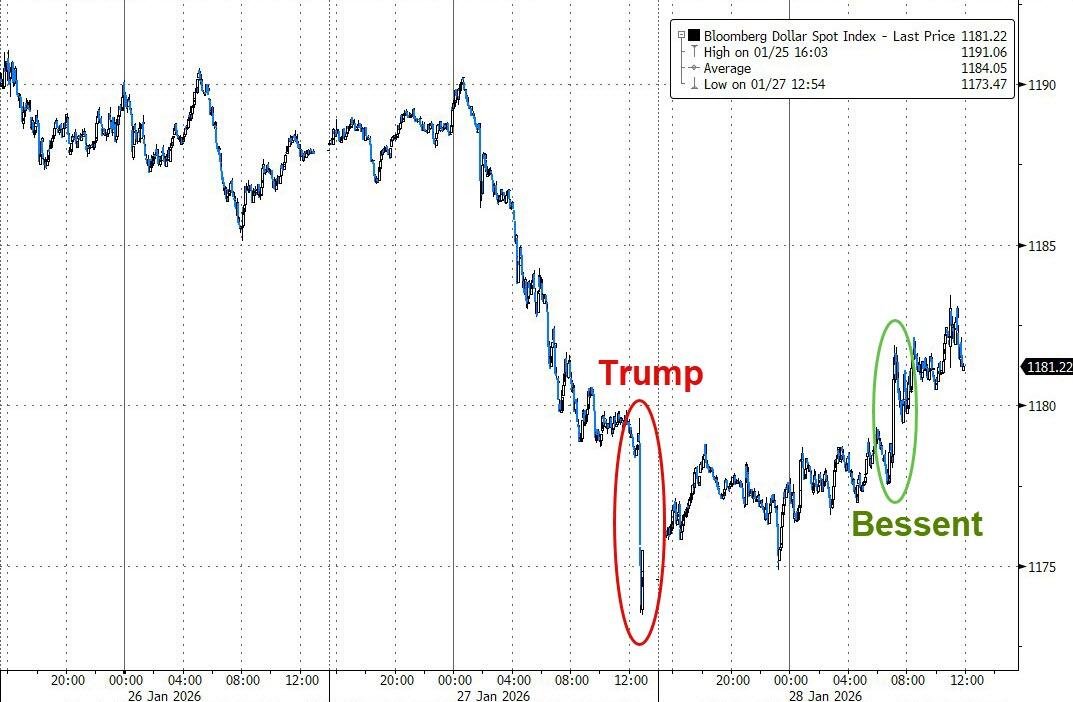
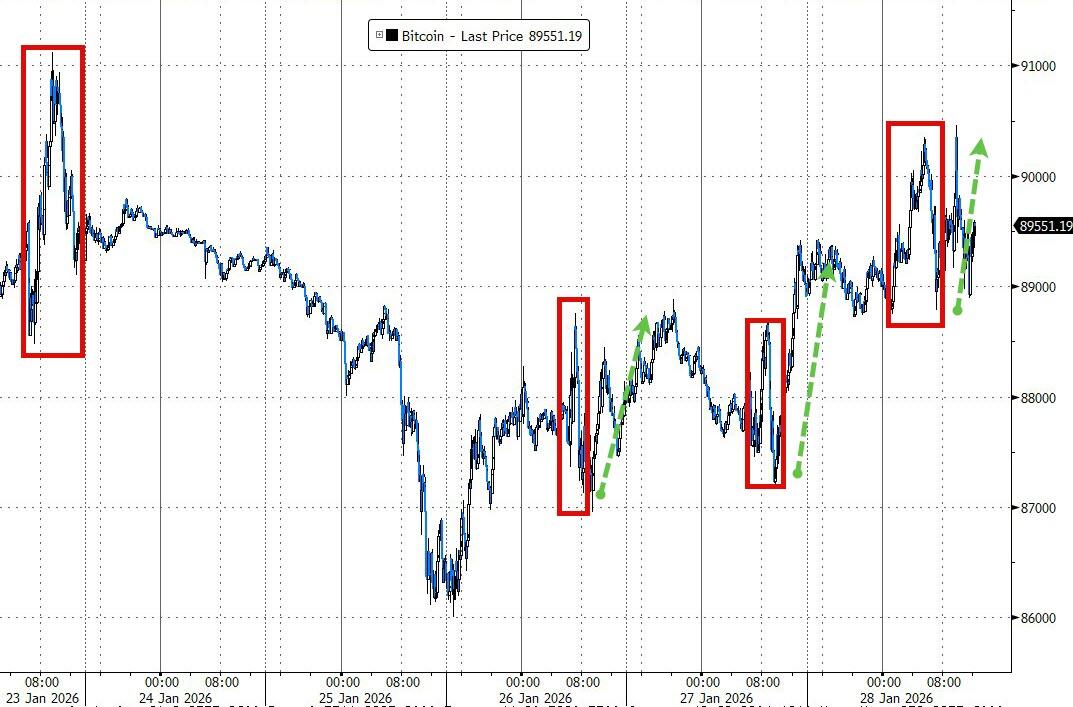
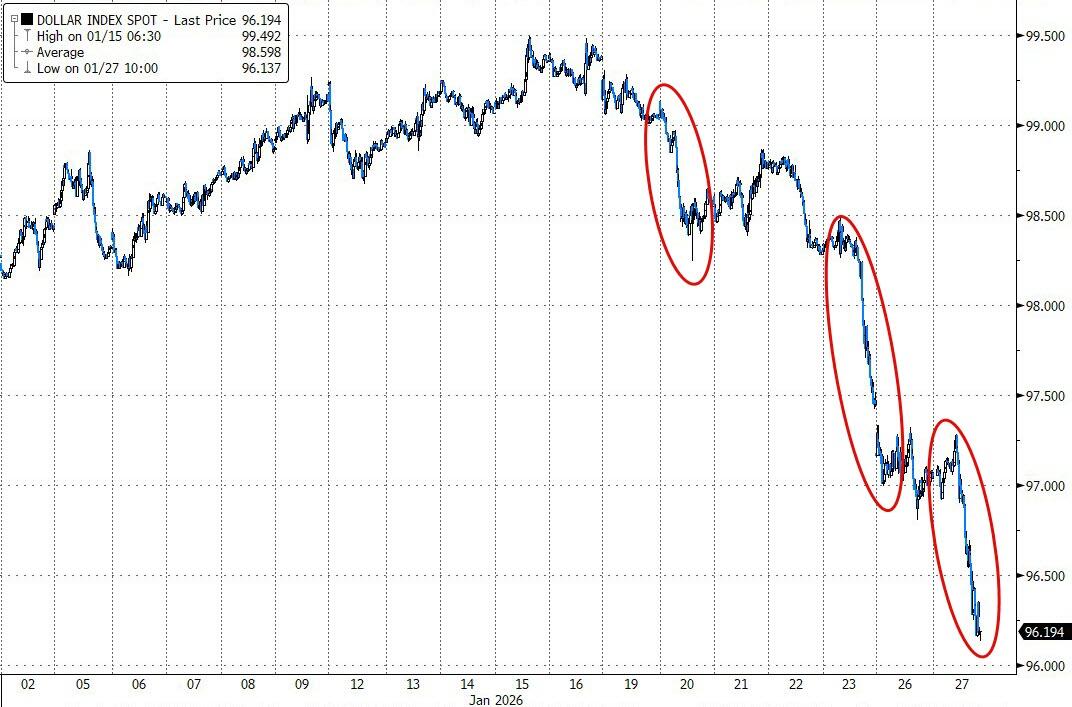
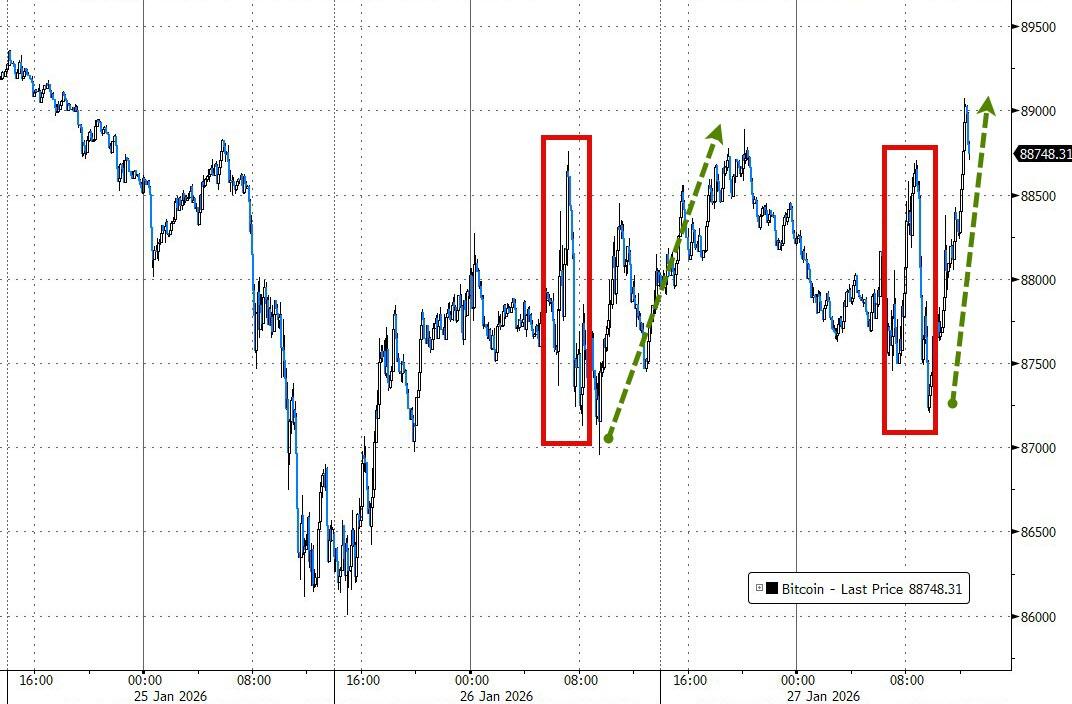
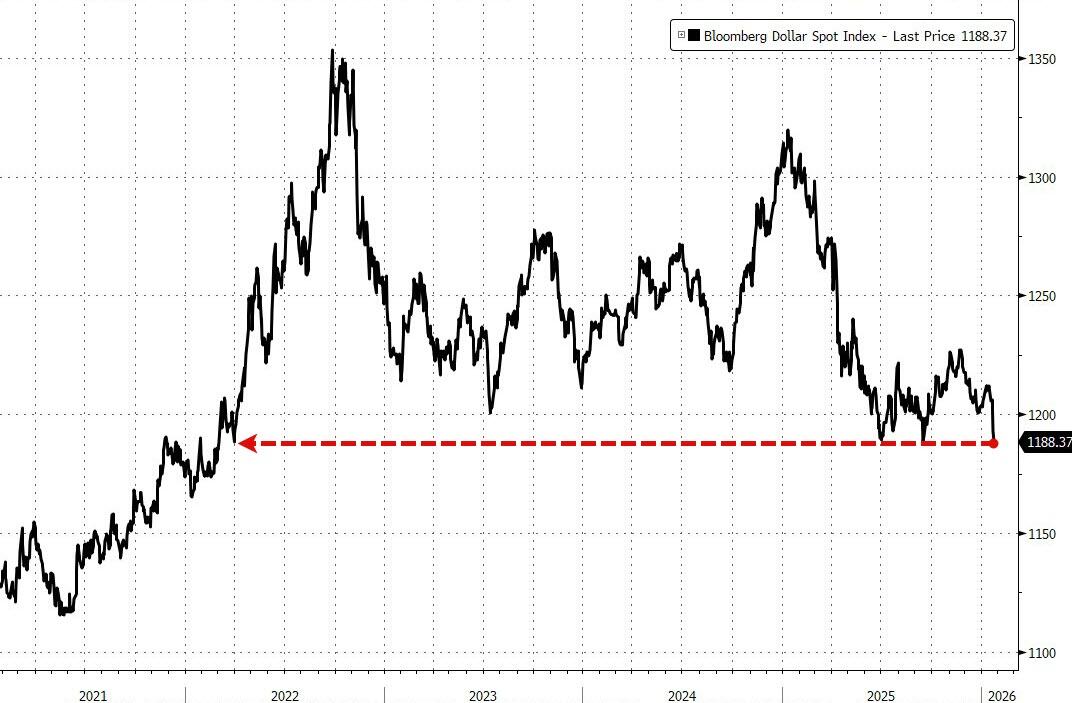
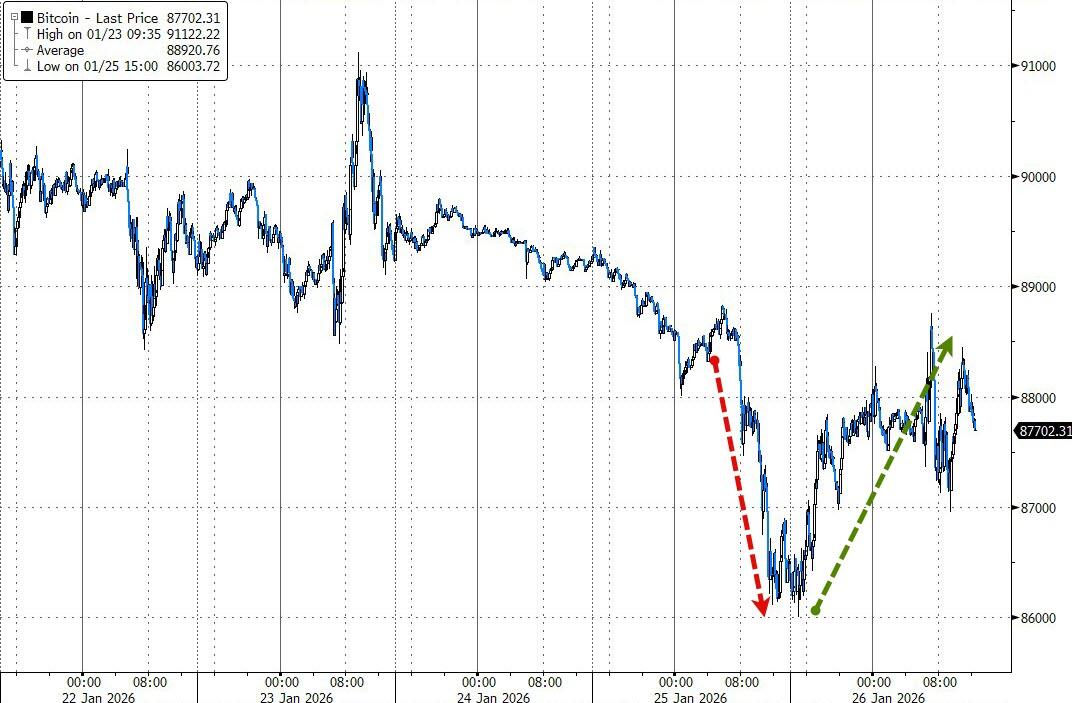
The dollar got dumped for the third straight month, while Bitcoin rode its usual rollercoaster—tanked early but erased the losses by the close.
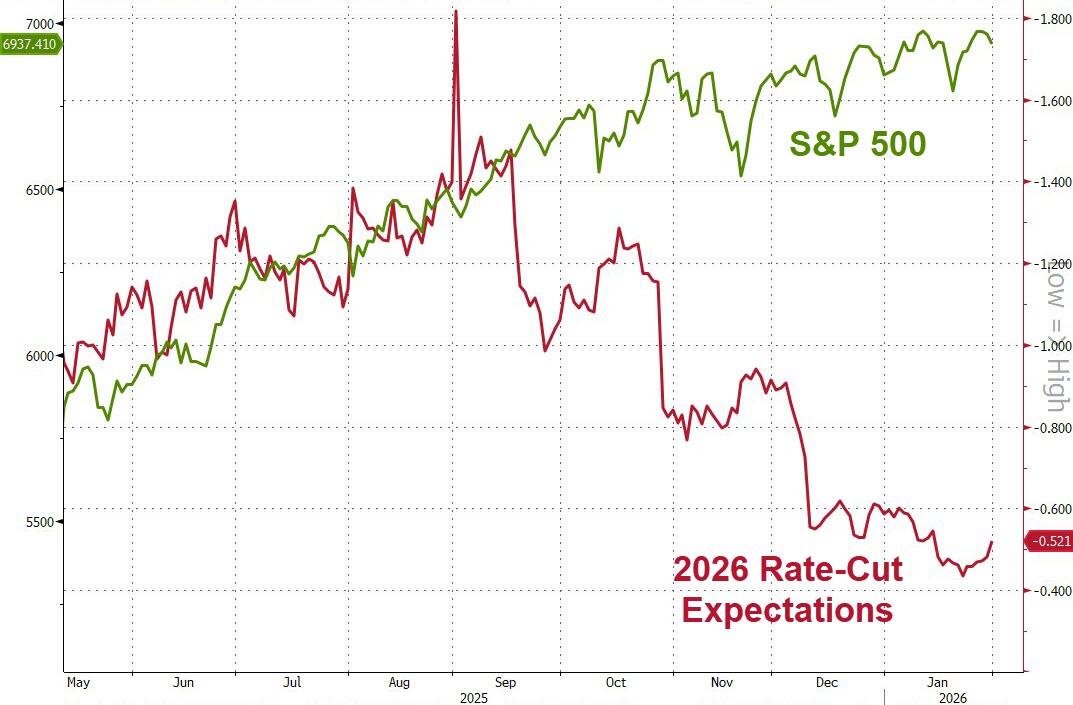
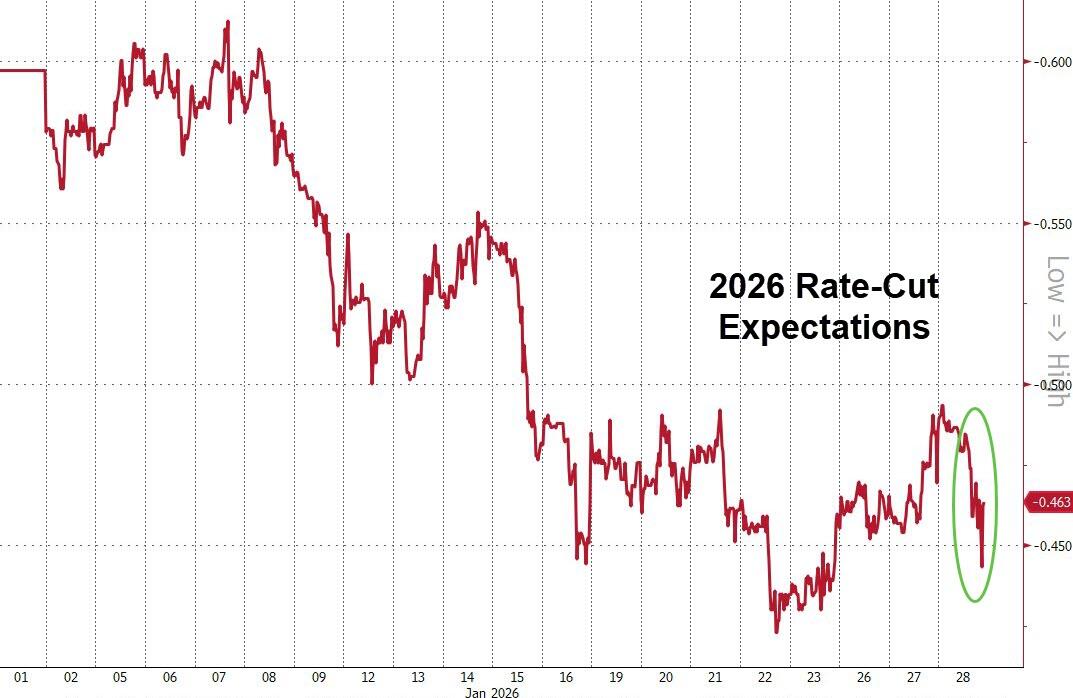
Risk and volatility are always around the corner. Right now, the big disconnect between stocks at record highs and the huge gap to rate-cut expectations could pull the punchbowl away if the Fed stays cautious.
Read More