
- Moving the markets
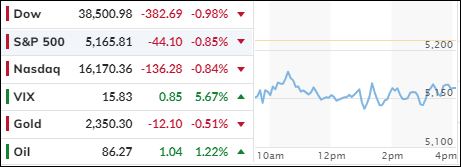
Today’s market revealed a downturn in the major indexes following the release of March’s inflation data, which exceeded expectations and may delay anticipated interest rate cuts by the Federal Reserve.
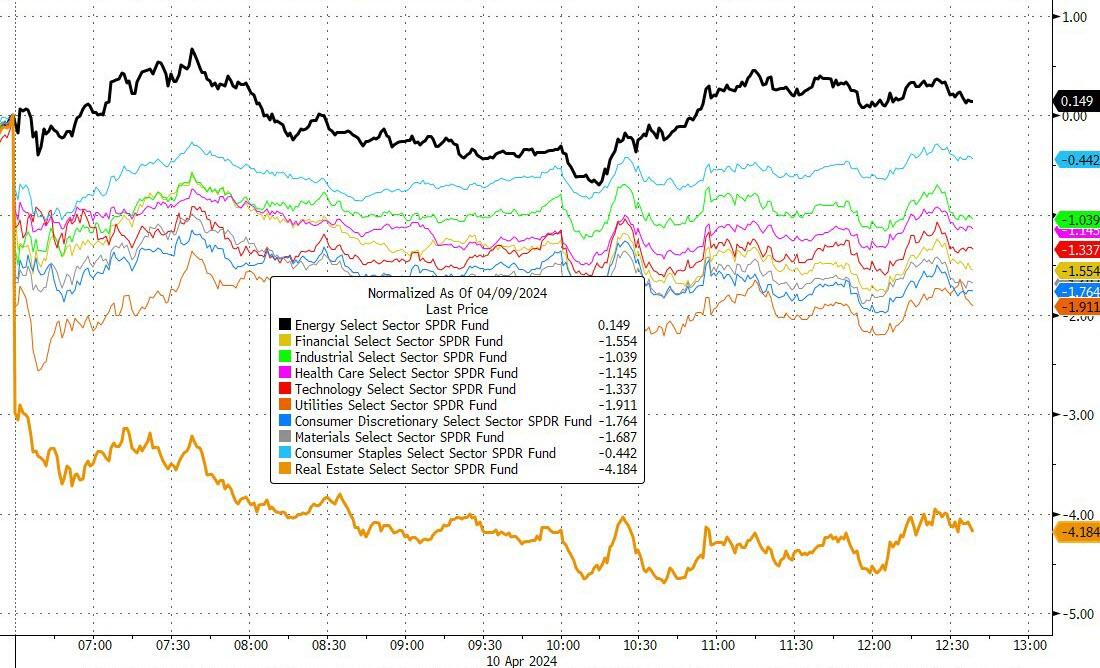
Energy was the only sector not to decline, with real estate experiencing over a 4% drop, the most significant loss of the day. After a strong start to the year, the S&P 500’s performance was flat in April, awaiting this inflation report.
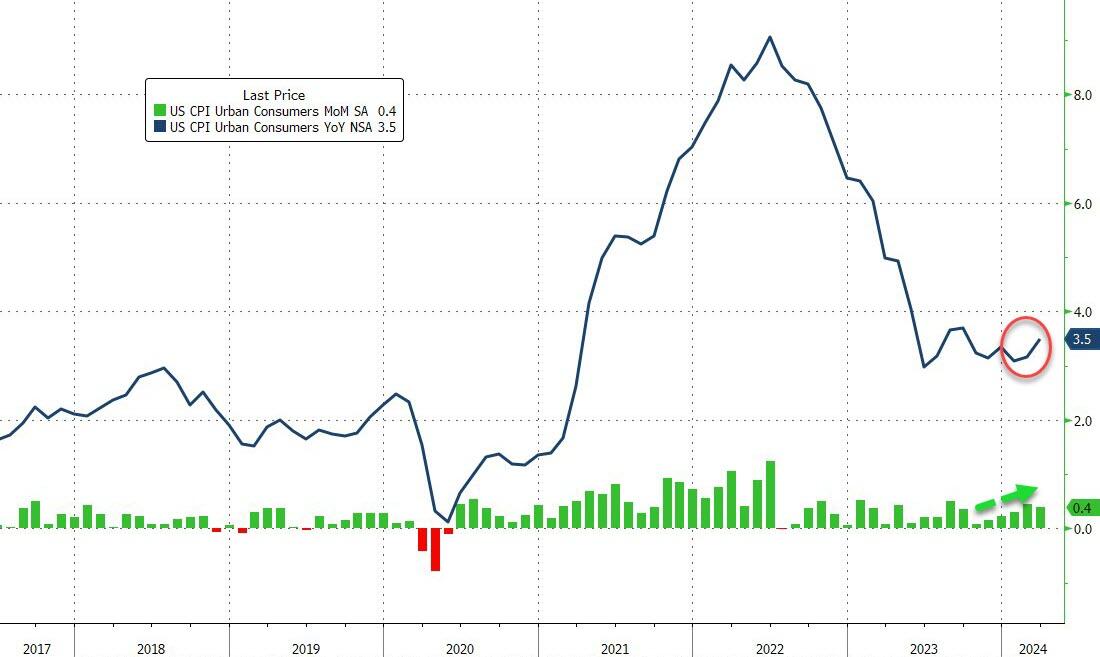
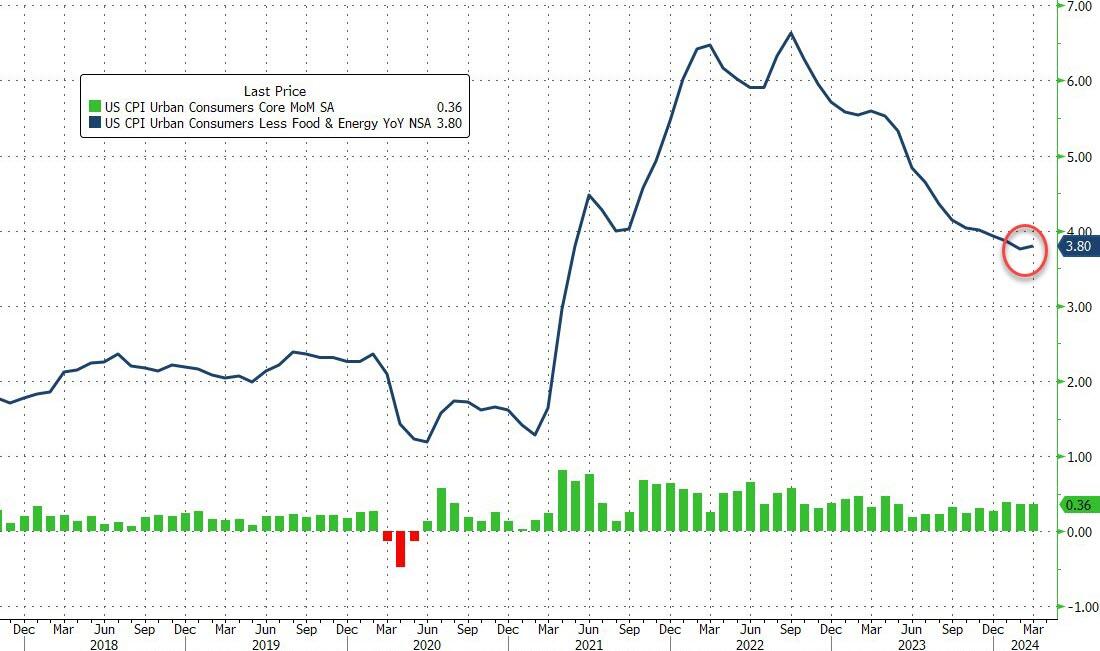
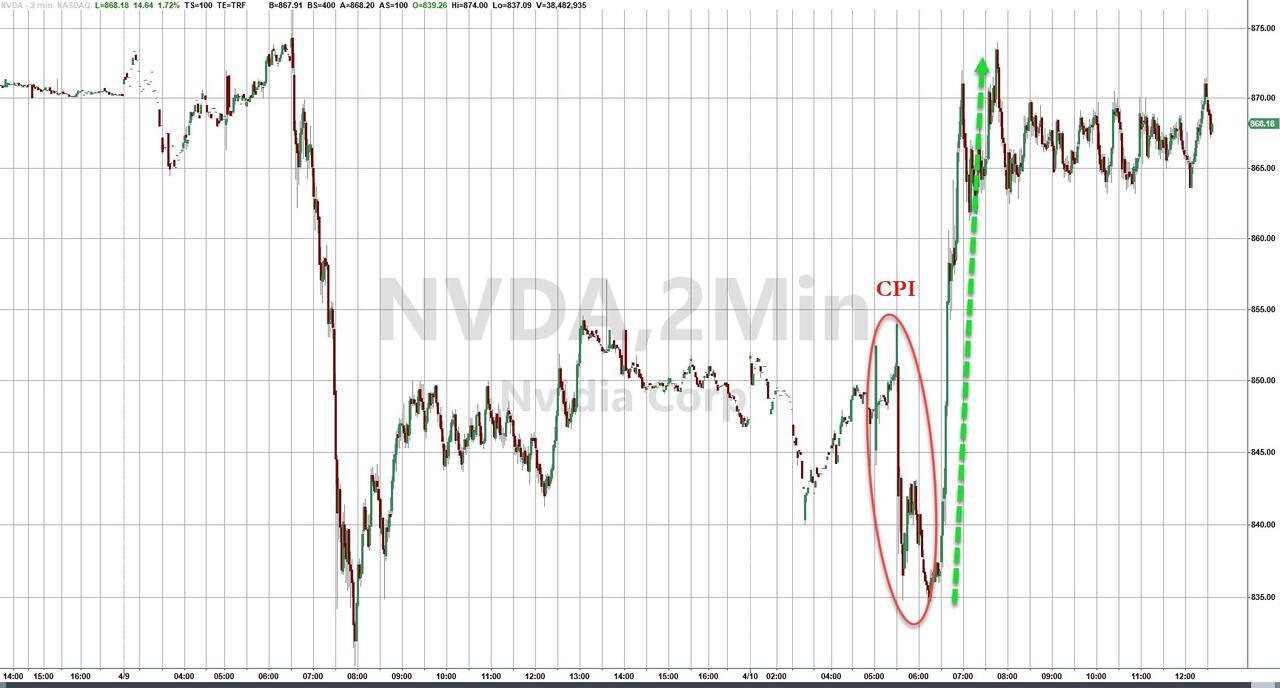
The Consumer Price Index (CPI) for March showed a 0.4% monthly increase and a 3.5% rise from the previous year, surpassing the predicted 0.3% and 3.4% increases. The core CPI, excluding food and energy, grew by 0.4% monthly and 3.8% annually, also above the 0.3% and 3.7% forecasts. In April, the CPI’s annual increase rate was 3.2% for all items.
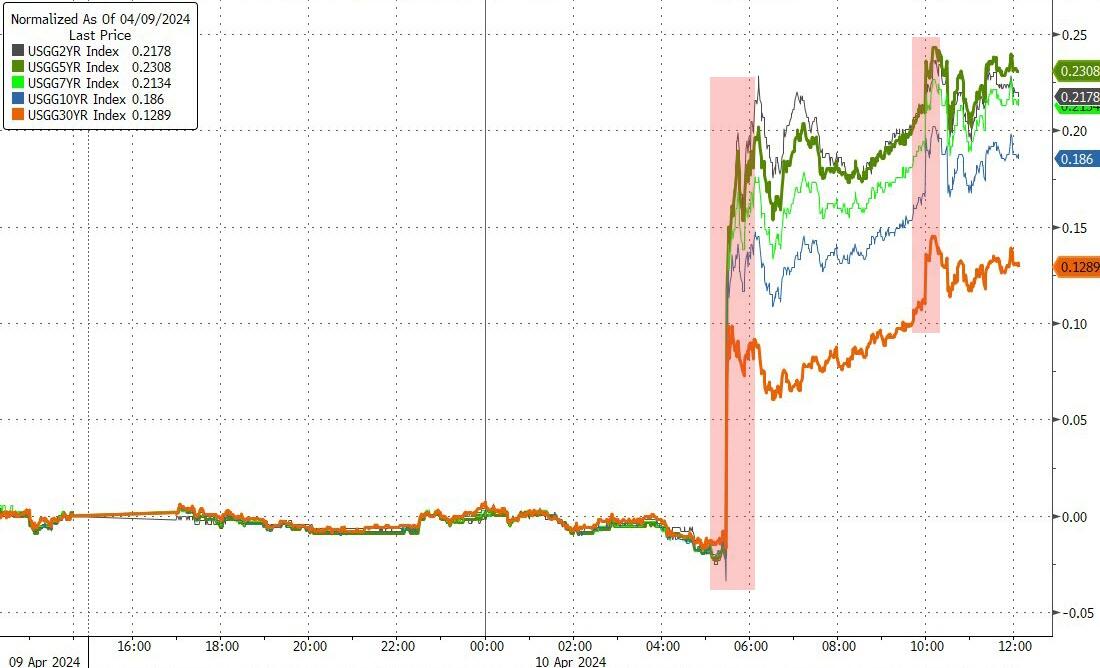
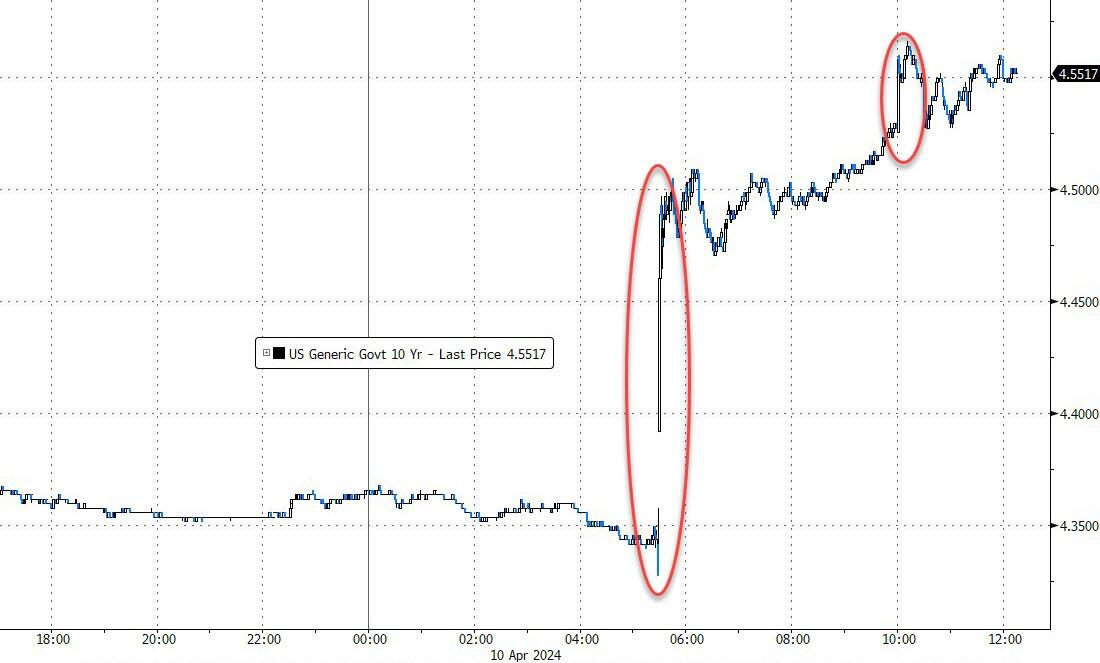
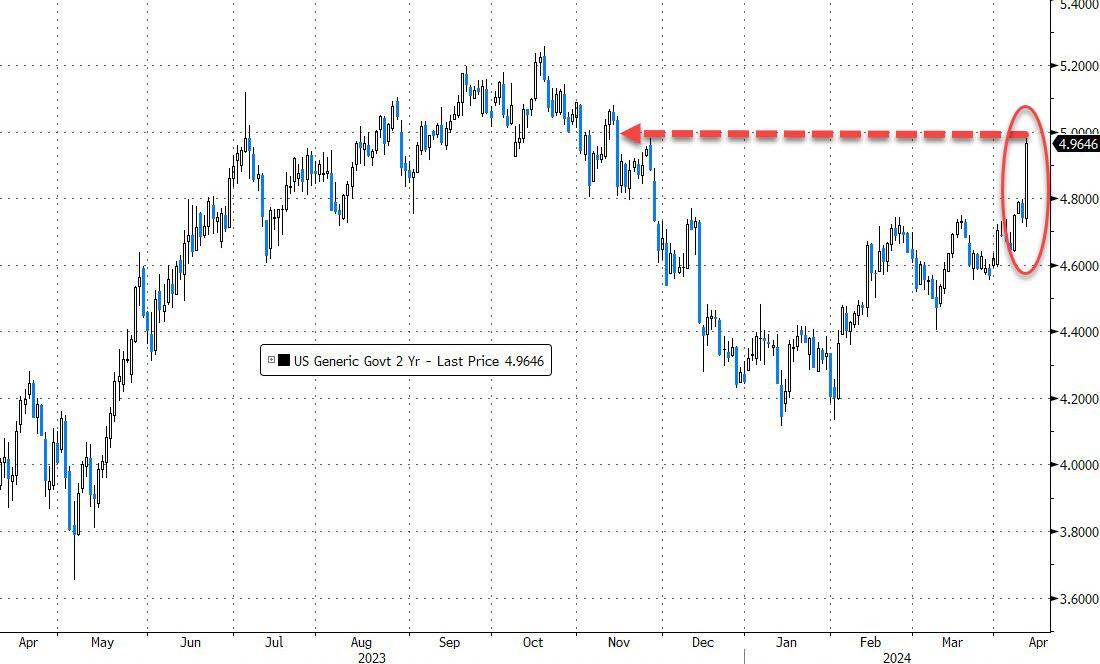
Bond yields rose sharply, with the 10-year Treasury yield climbing above 4.55%, indicating a reacceleration of the March CPI from the previous month and challenging the Federal Reserve’s goal for a 2% inflation rate. The 2-year Treasury yield reached nearly 5%.
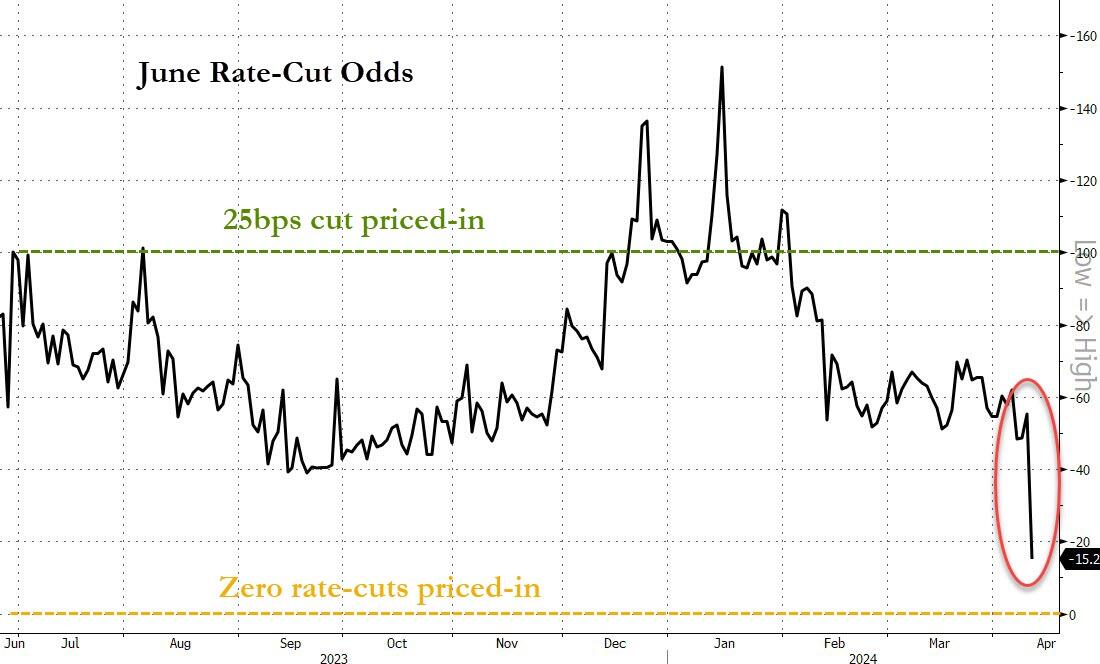
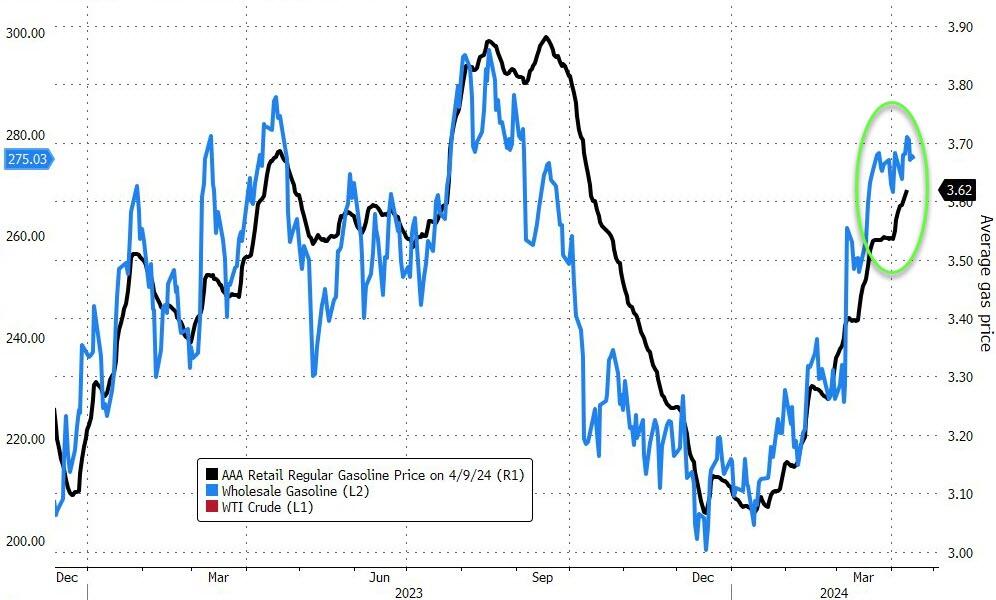
The current CPI report confirms a shift from disinflation to persistent inflation, a perspective I’ve long maintained. The probability of the Federal Reserve easing rates this year has diminished, with only a 20% chance of a rate cut in June. The most evident sign of ongoing inflation for many is at the gas pump.
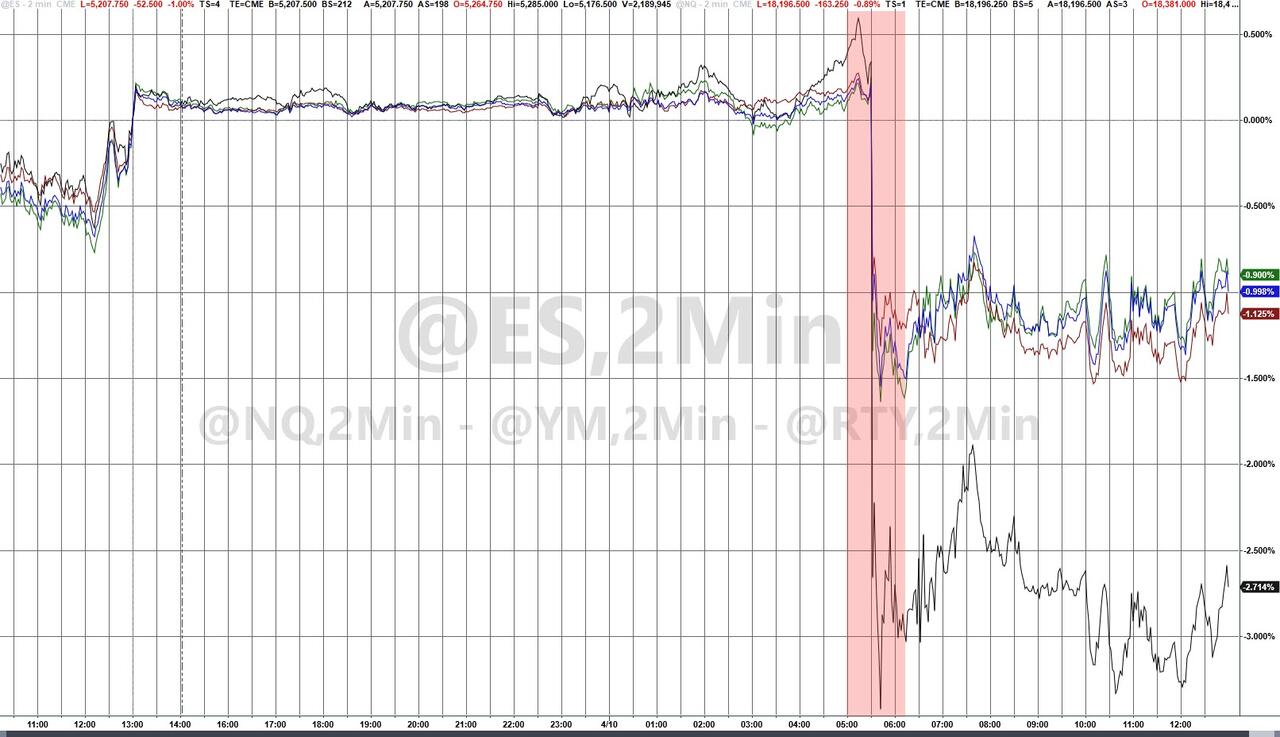
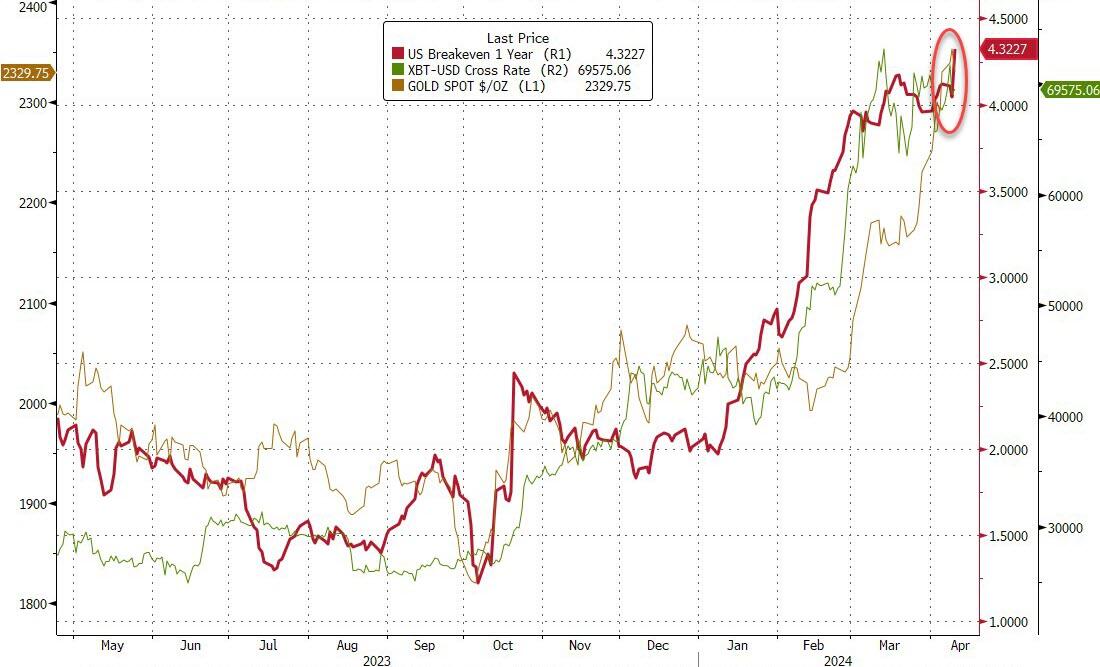
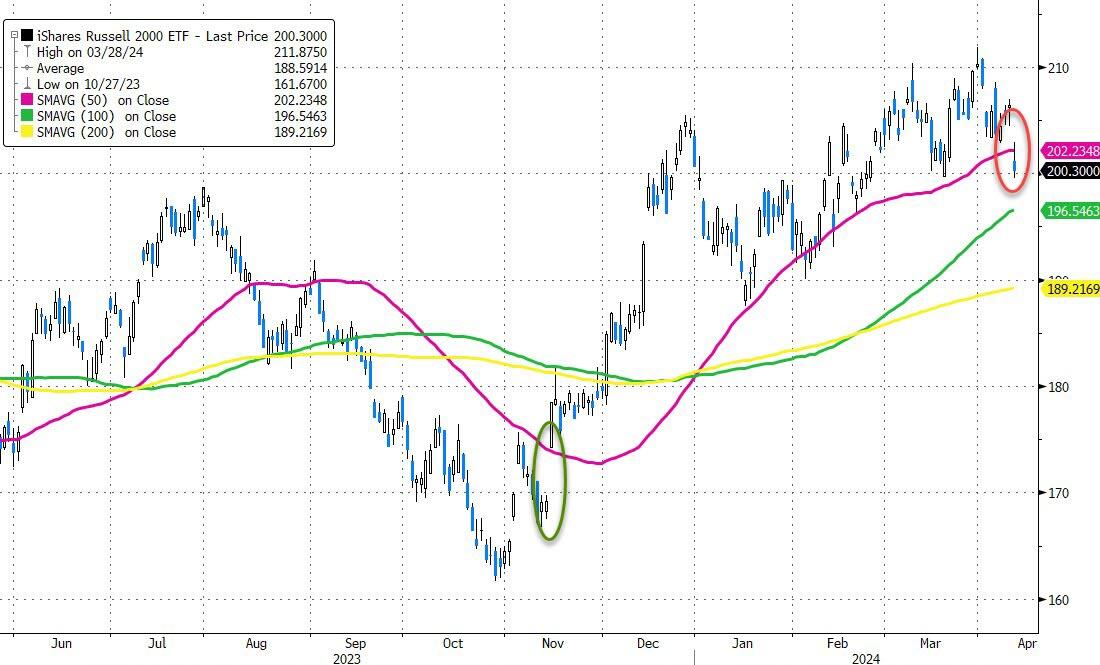
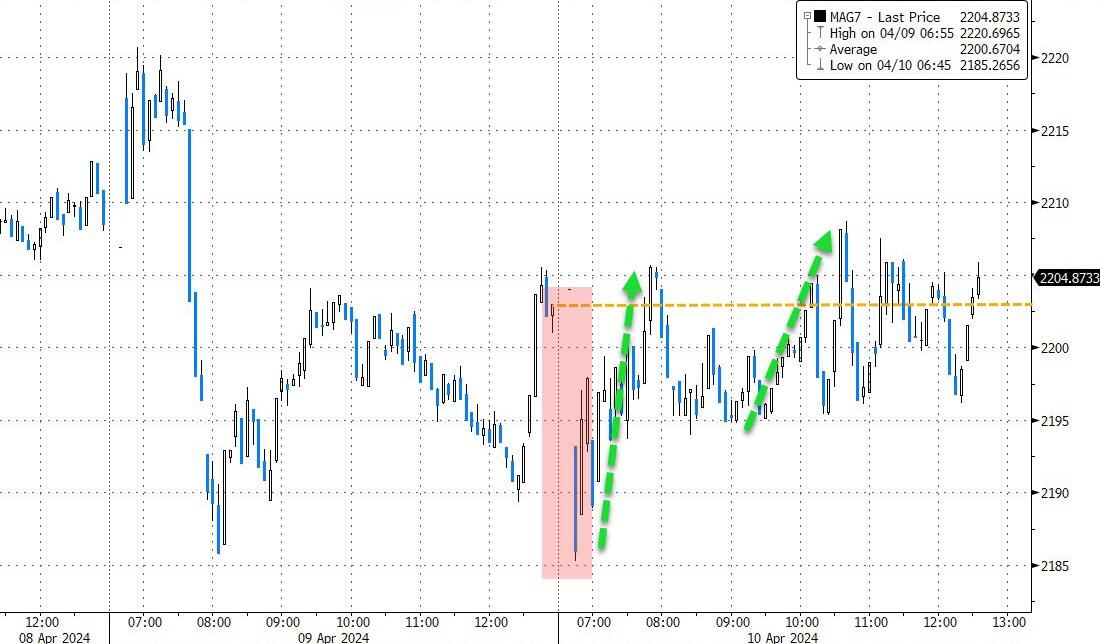
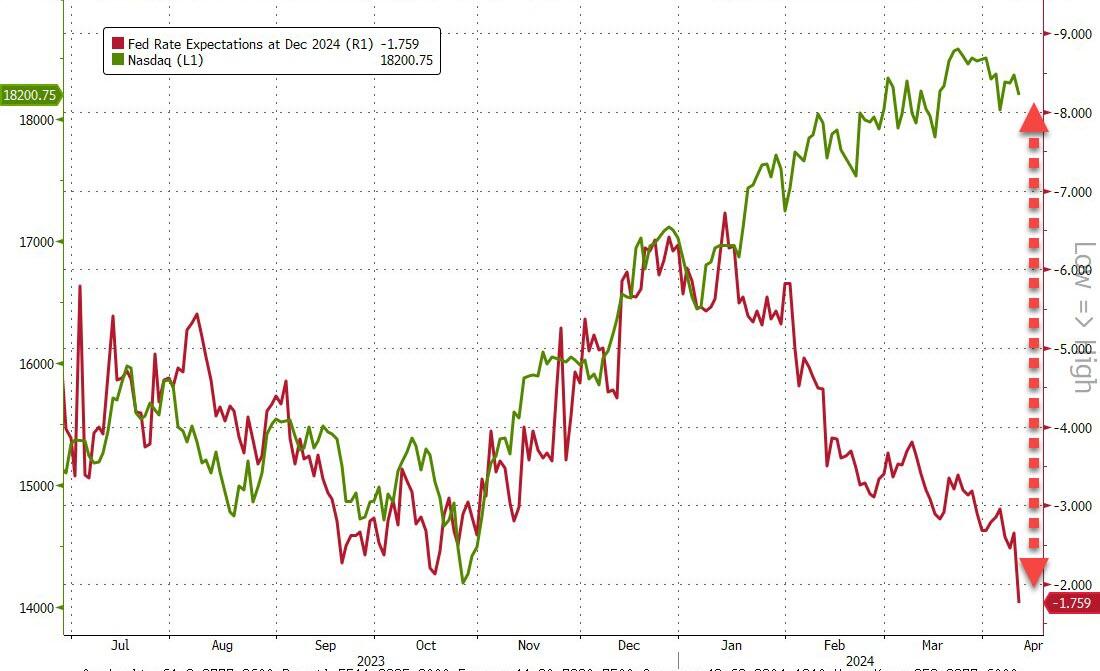
Inflation expectations have hit a new peak, the highest since June 2022. Small Caps suffered the most, falling below their 50-day moving average for the first time since November, while the MAG7 stocks remained stable despite initial losses.
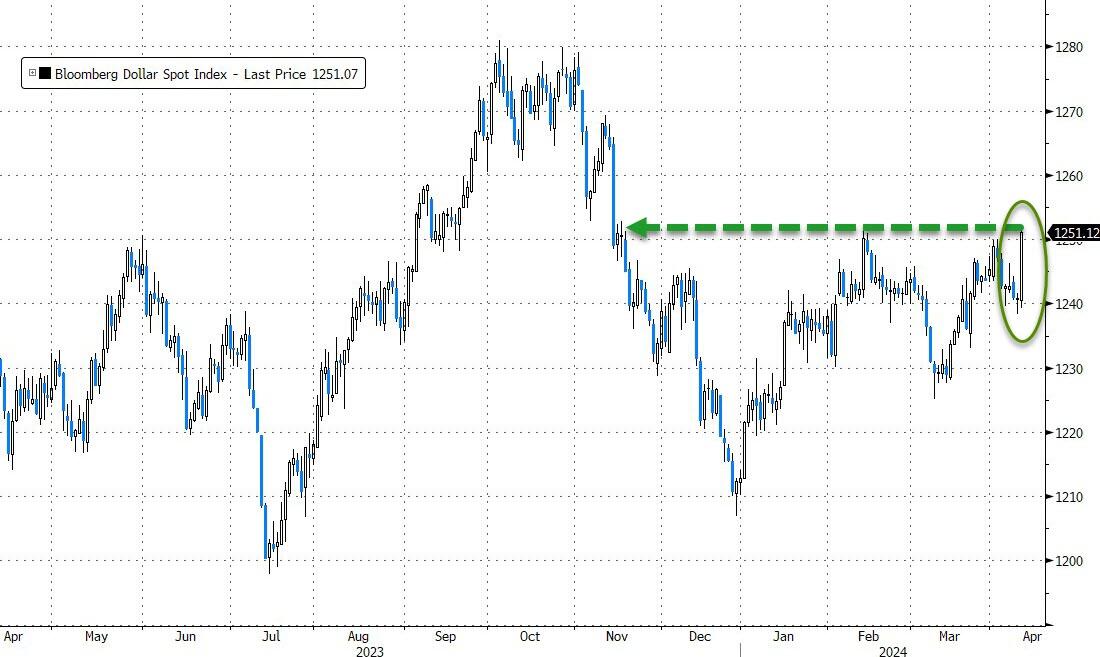
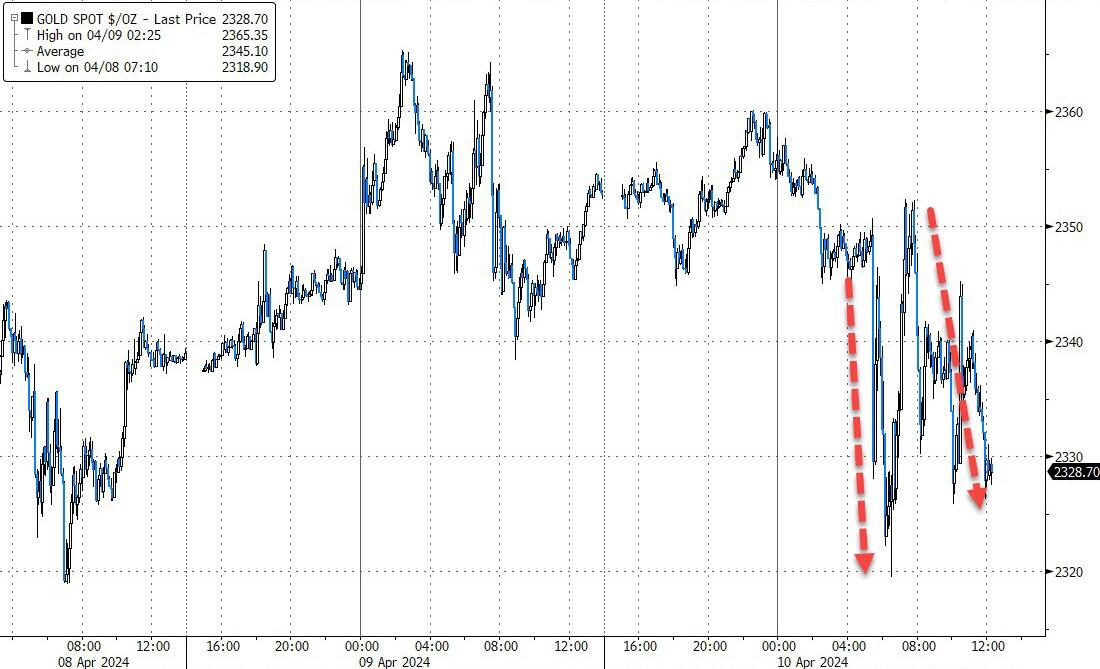
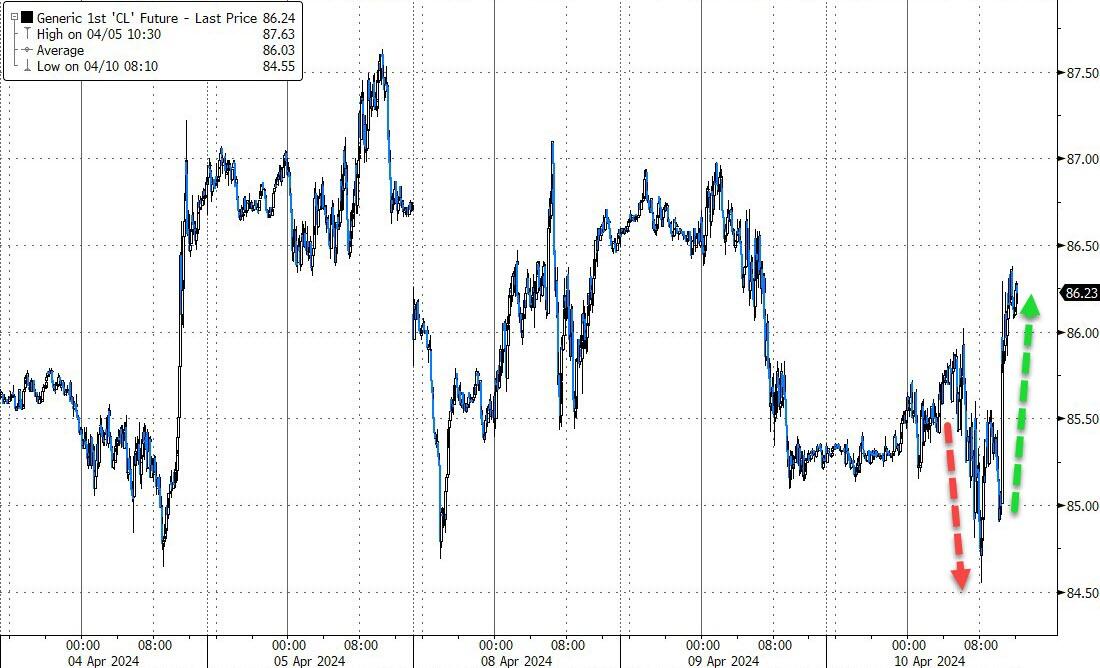
Nvidia and Bitcoin emerged as alternative safety trades for this session. The dollar’s value increased, gold retreated from its continuous upward trend, and oil prices rose due to heightened geopolitical tensions, adding to the strain of higher gas prices.
As the market grapples with these challenges, one wonders how long it can endure the pressure of rising bond yields.
When will the market reach its tipping point?
2. Current “Buy” Cycles (effective 11/21/2023)
Our Trend Tracking Indexes (TTIs) have both crossed their trend lines with enough strength to trigger new “Buy” signals. That means, Tuesday, 11/21/2023, was the official date for these signals.
If you want to follow our strategy, you should first decide how much you want to invest based on your risk tolerance (percentage of allocation). Then, you should check my Thursday StatSheet and Saturday’s “ETFs on the Cutline” report for suitable ETFs to buy.
3. Trend Tracking Indexes (TTIs)
The Consumer Price Index (CPI) results were unexpectedly high, causing a steep decline in the major stock indexes. Despite this, they managed to close above their lowest points of the session. Gold also experienced a downturn, while Bitcoin’s value stayed consistent.
Our TTIs similarly moved downward, yet they continue to signal a “Buy” recommendation, maintaining positions above their trend lines.
This is how we closed 4/10/2024:
Domestic TTI: +8.80% above its M/A (prior close +10.68%)—Buy signal effective 11/21/2023.
International TTI: +8.66% above its M/A (prior close +9.72%)—Buy signal effective 11/21/2023.
All linked charts above are courtesy of Bloomberg via ZeroHedge.
———————————————————-
WOULD YOU LIKE TO HAVE YOUR INVESTMENTS PROFESSIONALLY MANAGED?
Do you have the time to follow our investment plans yourself? If you are a busy professional who would like to have his portfolio managed using our methodology, please contact me directly to get more details.
—————————————————————-
Contact Ulli