
- Moving the markets
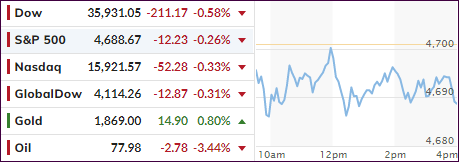
The bulls took a breather today and lost a tug-of-war pitting a continuation of strong earnings against persistent inflation anxieties. At least for this day, the dip buyers were conspicuously absent causing the major indexes to give back some of their recent gains.
For the week, the Nasdaq has been sprinting ahead with the Dow and S&P lagging, as supply chain issues and labor shortages remain on traders’ minds, which seems to affect the bullish theme but only on a temporary basis.
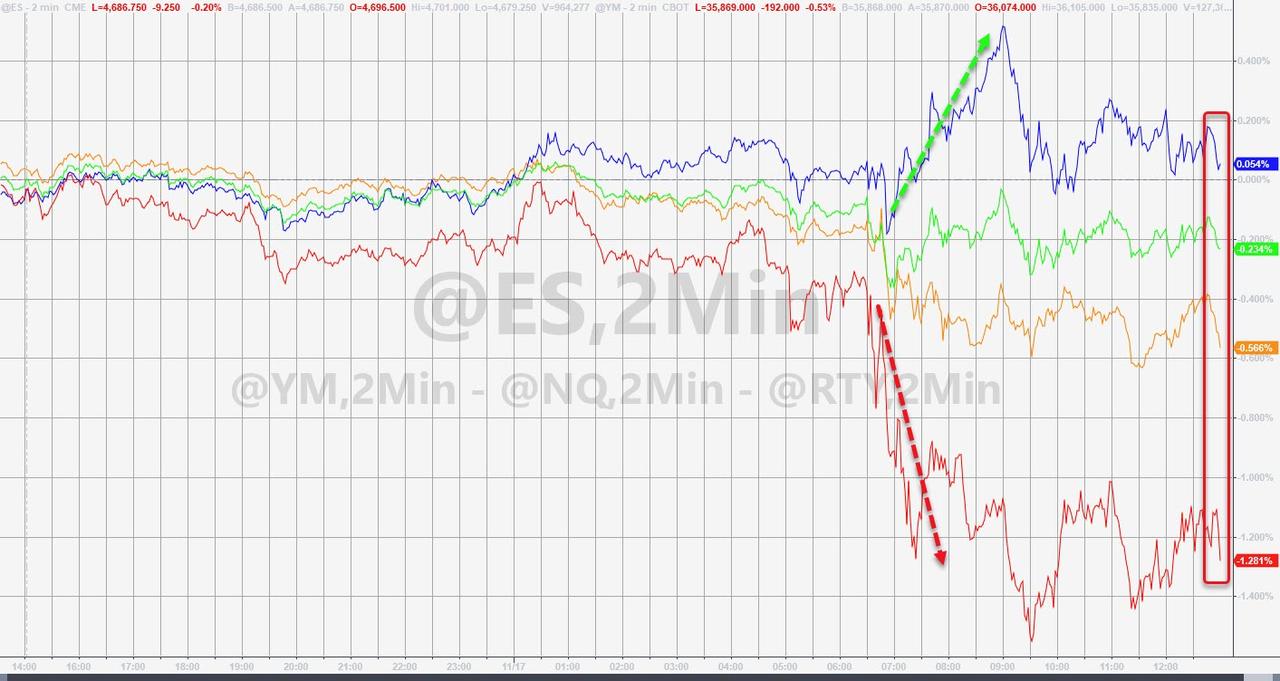
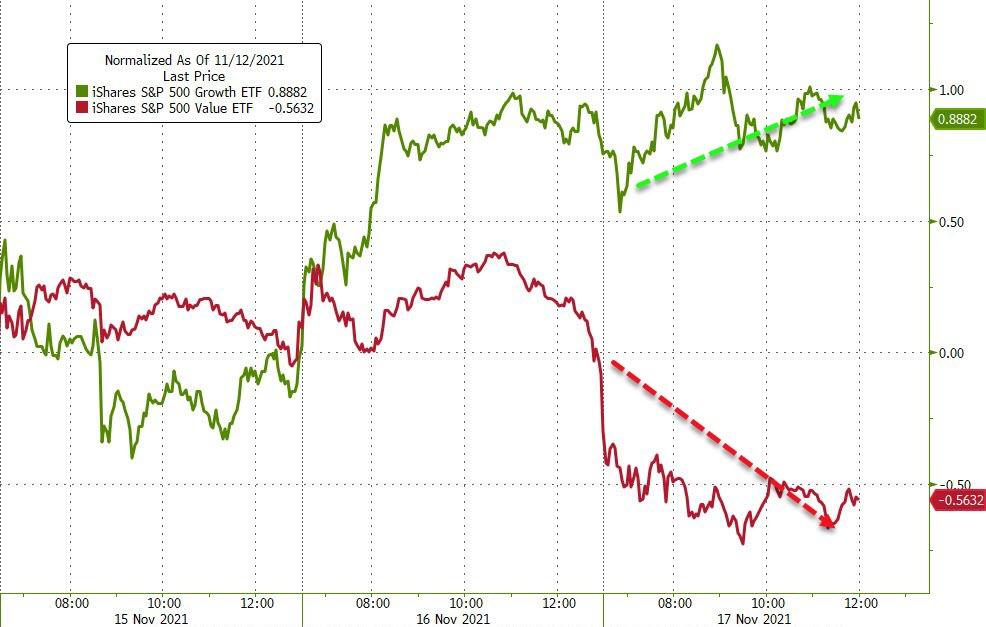
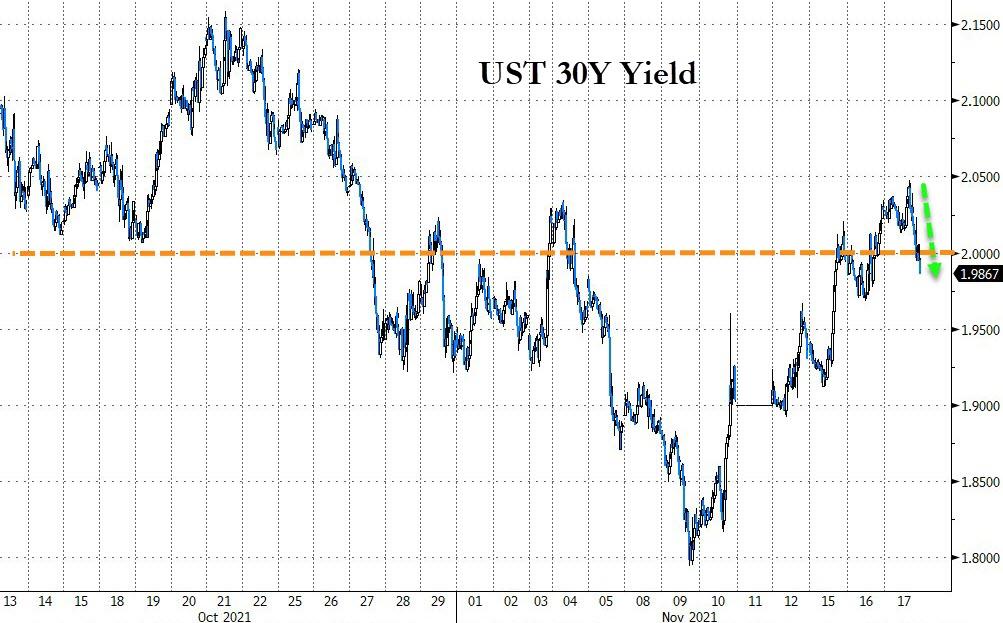
SmallCaps got spanked, and “Value” followed suit by getting hit hard relative to “Growth.” In a way, bond yields saved the day by retreating with the 30-year dropping below the 2% level, a retracement similar to the US Dollar, which corrected a scant 0.12%.
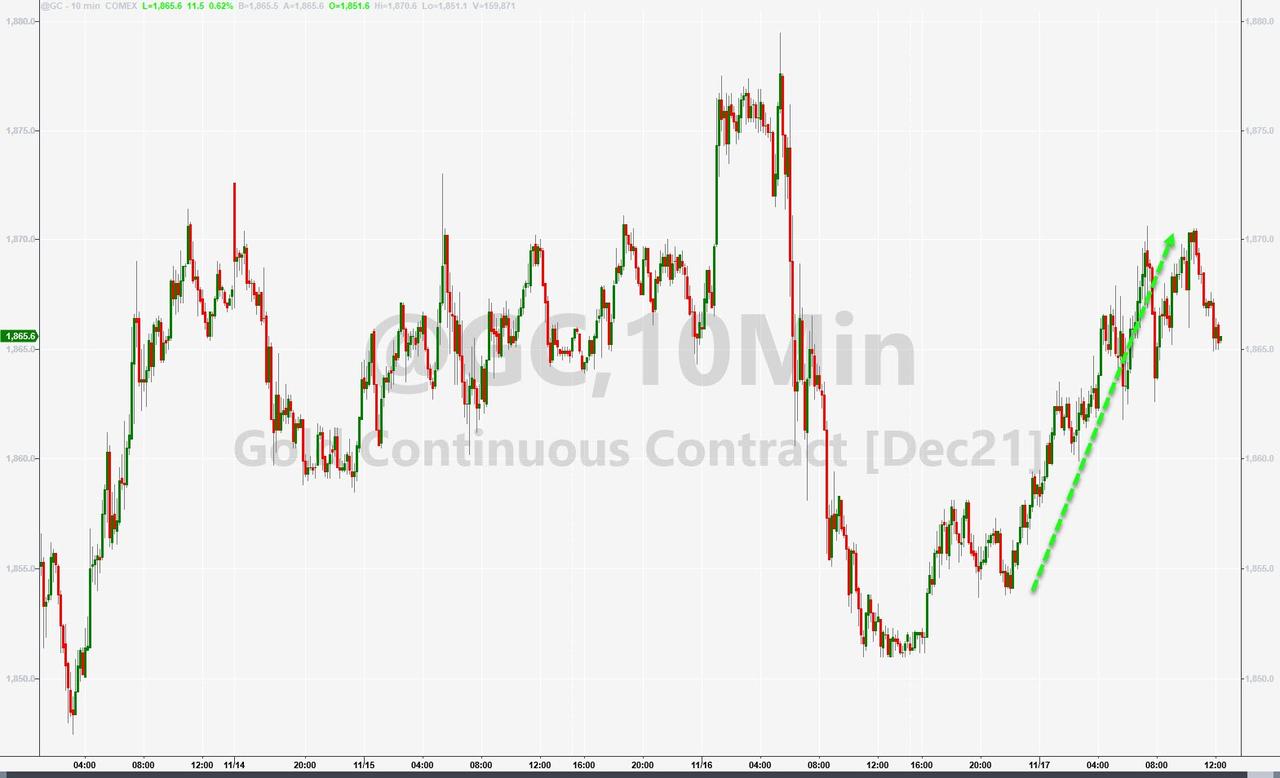
Gold, while pulling back into the close, continued its ascent towards the $1,900 level by gaining 0.80% and was one of the few ‘green’ closes we saw today.
I will be out tomorrow but will return on Friday to write that day’s market commentary.
2. ETFs in the Spotlight
In case you missed the announcement and description of this section, you can read it here again.
It features some of the 10 broadly diversified domestic and sector ETFs from my HighVolume list as posted every Saturday. Furthermore, they are screened for the lowest MaxDD% number meaning they have been showing better resistance to temporary sell offs than all others over the past year.
The below table simply demonstrates the magnitude with which these ETFs are fluctuating above or below their respective individual trend lines (%+/-M/A). A break below, represented by a negative number, shows weakness, while a break above, represented by a positive percentage, shows strength.
For hundreds of ETF choices, be sure to reference Thursday’s StatSheet.
For this current domestic “Buy” cycle, here’s how some our candidates have fared:
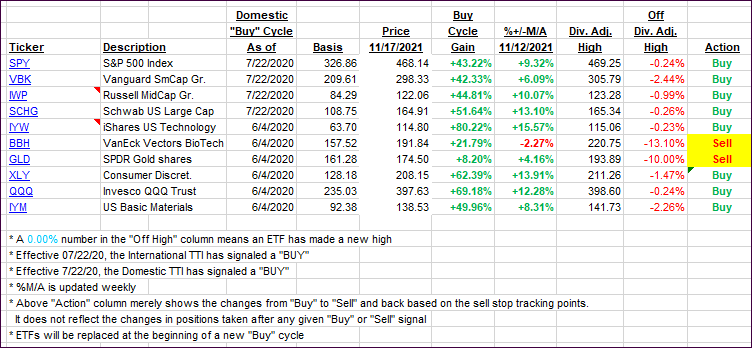
Click image to enlarge.
Again, the %+/-M/A column above shows the position of the various ETFs in relation to their respective long-term trend lines, while the trailing sell stops are being tracked in the “Off High” column. The “Action” column will signal a “Sell” once the -8% point has been taken out in the “Off High” column. For more volatile sector ETFs, the trigger point is -10%.
3. Trend Tracking Indexes (TTIs)
Our TTIs slipped, as the bulls handed the baton to the bears—at least for this session.
This is how we closed 11/17/2021:
Domestic TTI: +7.80% above its M/A (prior close +8.38%)—Buy signal effective 07/22/2020.
International TTI: +3.34% above its M/A (prior close +3.59%)—Buy signal effective 07/22/2020.
Disclosure: I am obliged to inform you that I, as well as my advisory clients, own some of the ETFs listed in the above table. Furthermore, they do not represent a specific investment recommendation for you, they merely show which ETFs from the universe I track are falling within the specified guidelines.
All linked charts above are courtesy of Bloomberg via ZeroHedge.
Contact Ulli