
- Moving the markets
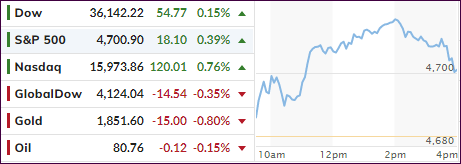
An initial bounce caused by strong October retail sales, as well as better-than-expected earnings report cards from Home Depot and Walmart, ran into some resistance mid-day, but the major indexes still managed to eke out a gain.
Leading the pack was the Nasdaq with a solid 0.76% advance, while the Dow lagged and barely stayed in the green. Traders took the above data as a sign that consumers are still in spending mode, however, their motivation may have been to buy now to avoid higher prices later.
The latest retail data showed that consumers increased their spending, as sales jumped 1.7%, a considerable increase from the prior month’s meager 0.8%. Online sales took top billing with an increase of 10.2% YoY, even though the CPI surged 6.2% YoY.
Despite the recent rut in the averages, MarketWatch noted that the Dow sits away from his record by 1.4%, while the S&P and Nasdaq hover within 1% of theirs.
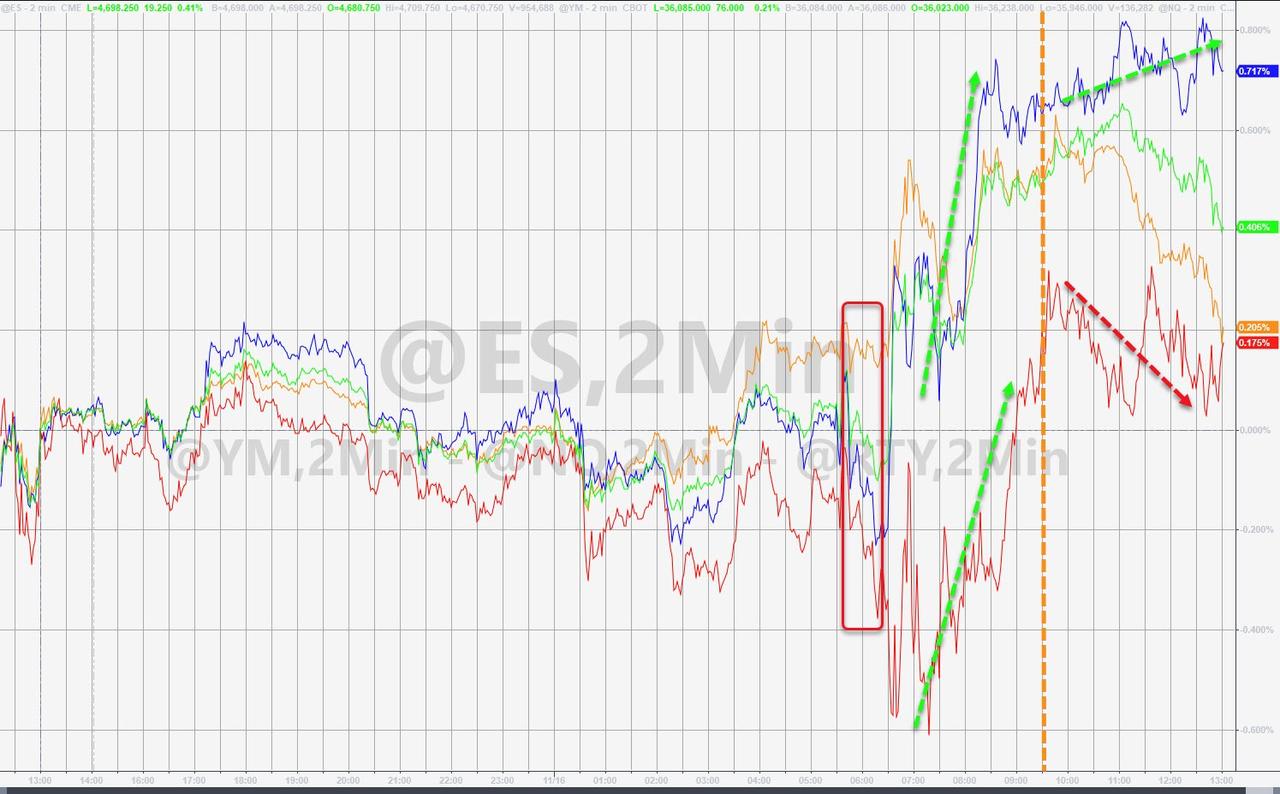
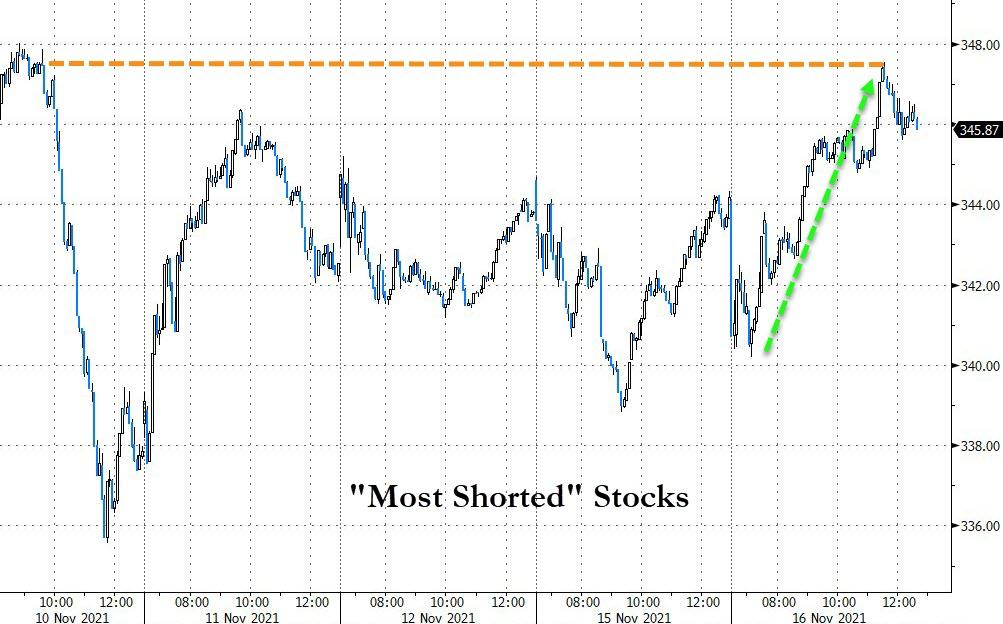
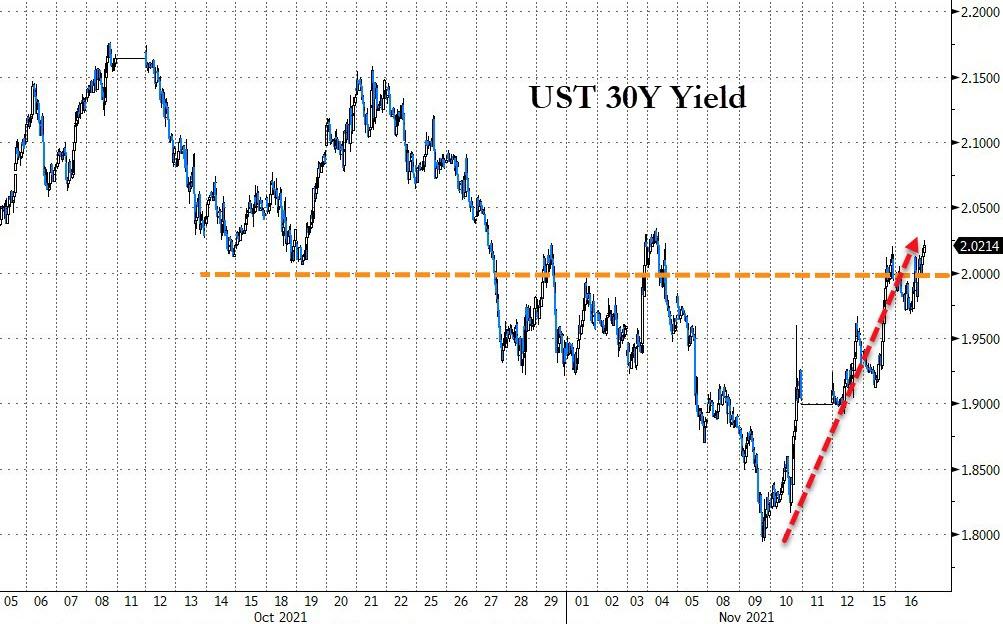
Today’s rebound was again helped by a short squeeze, which provided the much needed fuel to keep the markets on track for a green close, because bond yields continued their run. The 30-year again climbed above the 2% level but did not break out of November’s trading range—yet.
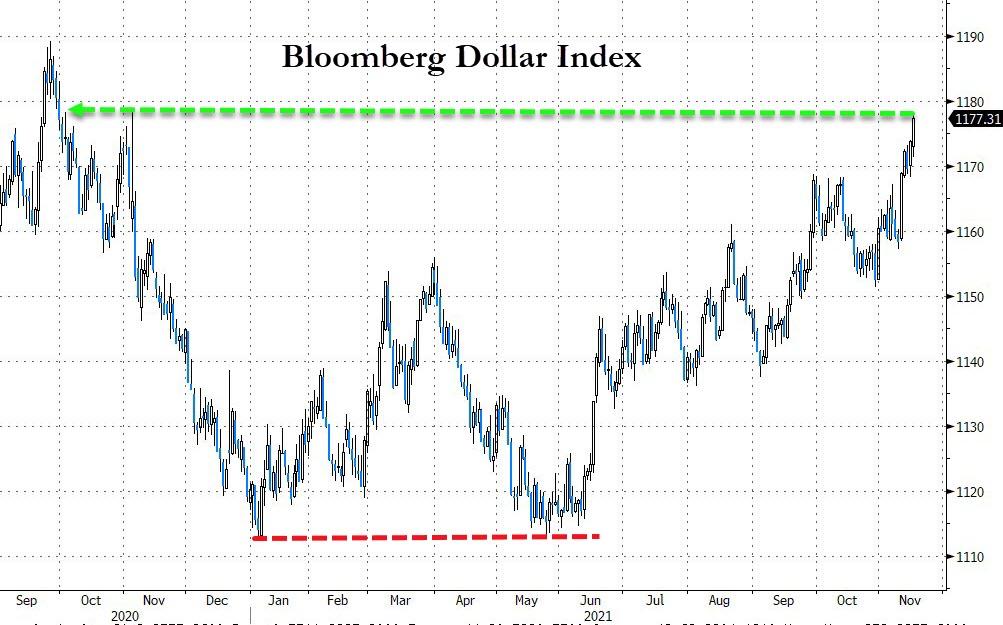
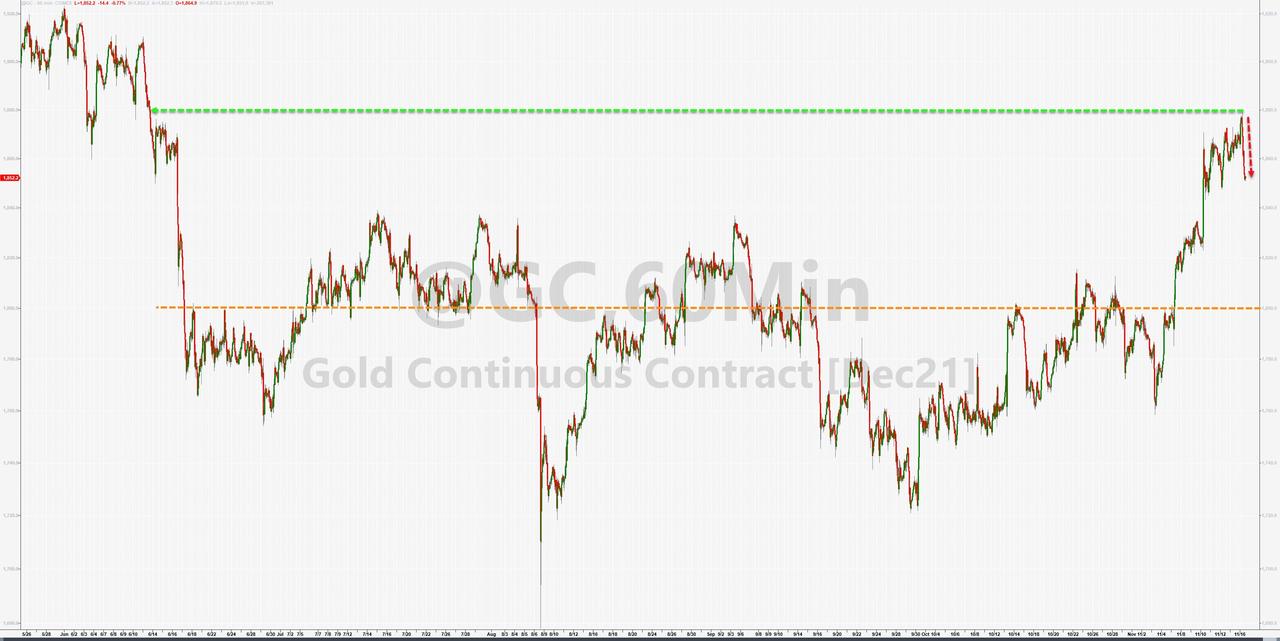
The US Dollar followed suit and touched a level last seen in September. None of these events proved beneficial to gold, so the precious metal slipped 0.79% but managed to successfully defend its $1,800 level.
2. ETFs in the Spotlight
In case you missed the announcement and description of this section, you can read it here again.
It features some of the 10 broadly diversified domestic and sector ETFs from my HighVolume list as posted every Saturday. Furthermore, they are screened for the lowest MaxDD% number meaning they have been showing better resistance to temporary sell offs than all others over the past year.
The below table simply demonstrates the magnitude with which these ETFs are fluctuating above or below their respective individual trend lines (%+/-M/A). A break below, represented by a negative number, shows weakness, while a break above, represented by a positive percentage, shows strength.
For hundreds of ETF choices, be sure to reference Thursday’s StatSheet.
For this current domestic “Buy” cycle, here’s how some our candidates have fared:
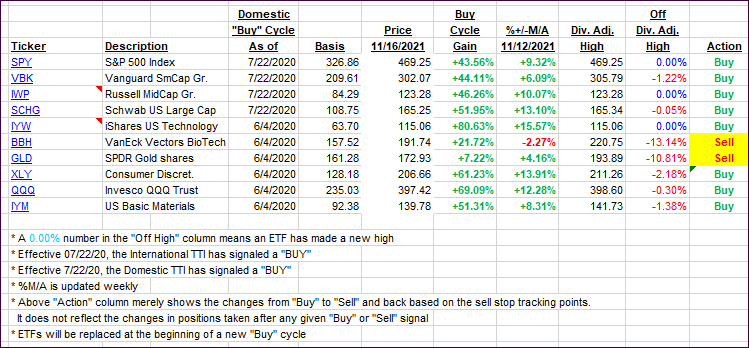
Click image to enlarge.
Again, the %+/-M/A column above shows the position of the various ETFs in relation to their respective long-term trend lines, while the trailing sell stops are being tracked in the “Off High” column. The “Action” column will signal a “Sell” once the -8% point has been taken out in the “Off High” column. For more volatile sector ETFs, the trigger point is -10%.
3. Trend Tracking Indexes (TTIs)
Our TTIs again showed a mixed picture with the Domestic one gaining and the International one pulling back.
This is how we closed 11/16/2021:
Domestic TTI: +8.38% above its M/A (prior close +8.23%)—Buy signal effective 07/22/2020.
International TTI: +3.59% above its M/A (prior close +3.83%)—Buy signal effective 07/22/2020.
Disclosure: I am obliged to inform you that I, as well as my advisory clients, own some of the ETFs listed in the above table. Furthermore, they do not represent a specific investment recommendation for you, they merely show which ETFs from the universe I track are falling within the specified guidelines.
All linked charts above are courtesy of Bloomberg via ZeroHedge.
Contact Ulli