
- Moving the markets
The market mantra of the past few weeks of “digging a hole and climbing out of it” failed miserably today, as dip buyers remained conspicuously absent thereby handing the directional baton to the bears.
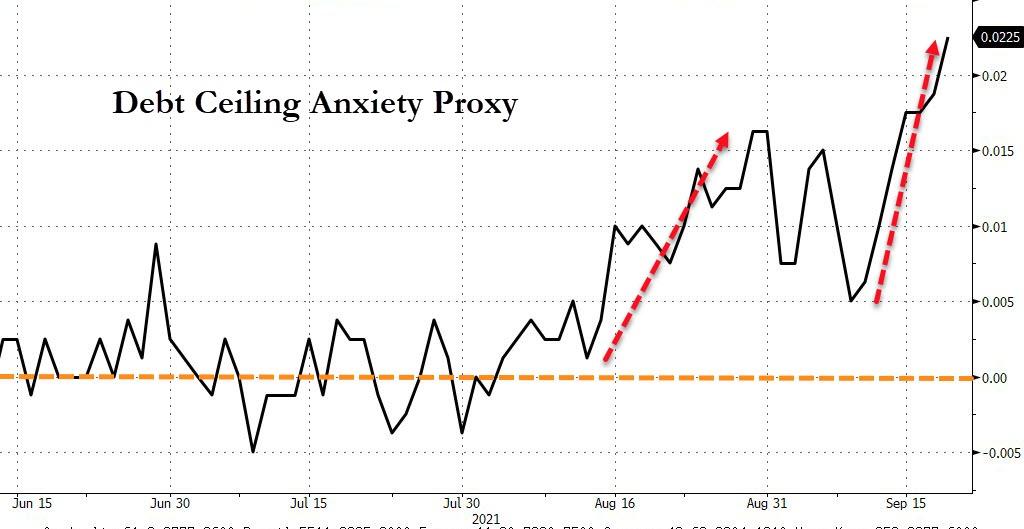
A host of factors combined forces to pull the markets down, including Delta troubles, Fed taper talk, the upcoming debt ceiling battle, seasonality in that the second half of September has been historically one of the worst periods for stocks, inflation fears, and the fact that we are way overdue for a correction if not the bursting of the bubble.
The latter only needed a pin prick, and that may have just occurred via the collapse of the Evergrande empire, a massive Chinese property developer with worldwide projects, which has become insolvent because of $300 billion in bad loans. Their stock plunged 80% YTD.
This story has been developing over the past week or so, with fears increasing that the cockroach theory may play out again in that there is never just one. While we don’t know the other names yet, contagion has already begun as a variety of Chinese construction/real estate ventures are collapsing and developers and industrial producers getting punished.
Some analysts have referred to Evergrande as being the next Lehman Brothers, the demise of which was instrumental in collapsing the financial markets in 2008.
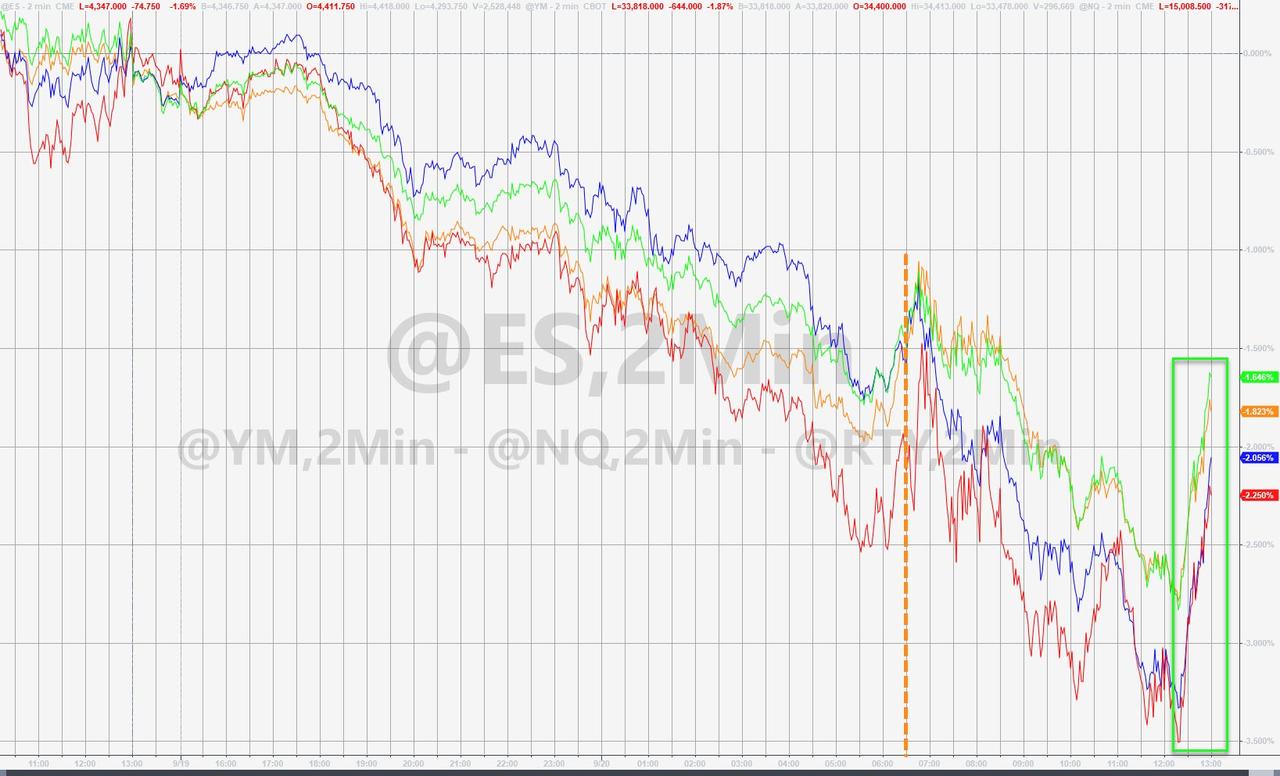
All this uncertainty resulted in equities being hit, but it’s noteworthy that a last hour rebound prevented a worse outcome. It remains to be seen whether there is more downside to come, or if dip buyers will re-appear.
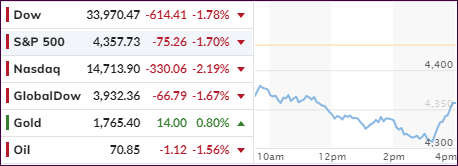
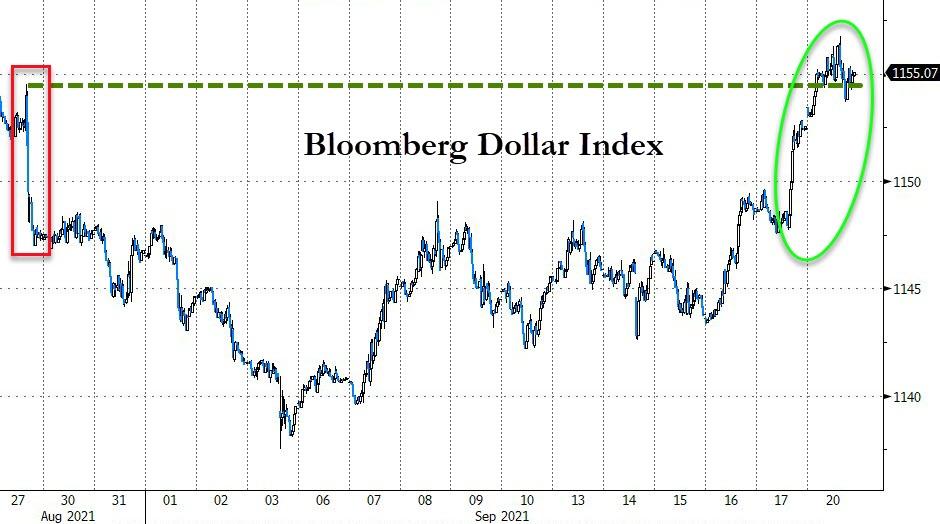
There were no winners, but as was to be expected bond yields dropped, and the US Dollar rode the range but closed about unchanged. Gold was the shining star by gaining +0.79%, which was one of the few green numbers on the computer screens.
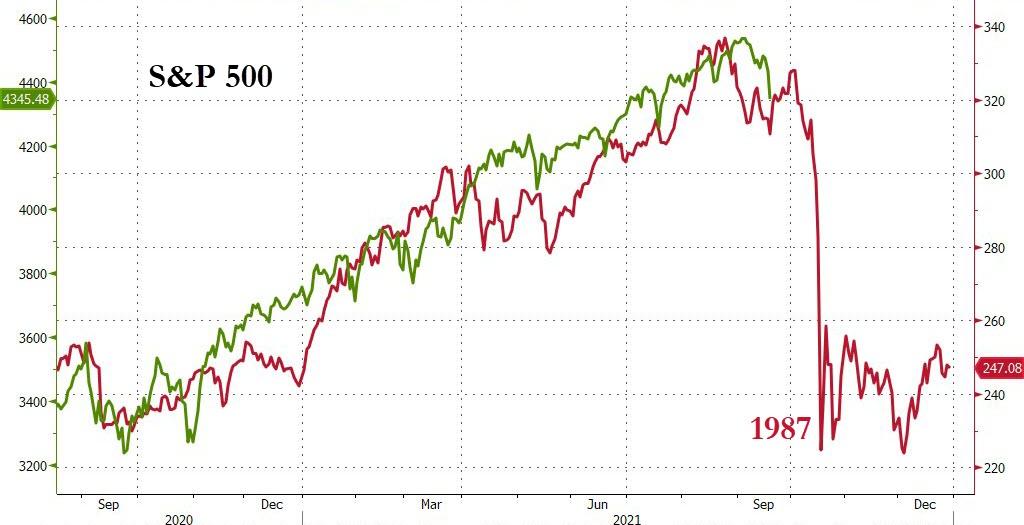
We have now reached a point where markets could break either way, meaning they could recover or the bubble might burst entirely, which brings up the interesting question as to whether history might repeat itself, as Bloomberg demonstrates in this chart.
That is why it’s critical to have an exit strategy in place designed to prevent the participation in the worst-case scenario. As you know, I use a combination of trailing sell stops and my Trend Tracking Indexes (TTIs). You can see their latest update in section 3 below.
My posting schedule for this week has slightly changed again and is updated here.
2. ETFs in the Spotlight
In case you missed the announcement and description of this section, you can read it here again.
It features some of the 10 broadly diversified domestic and sector ETFs from my HighVolume list as posted every Saturday. Furthermore, they are screened for the lowest MaxDD% number meaning they have been showing better resistance to temporary sell offs than all others over the past year.
The below table simply demonstrates the magnitude with which these ETFs are fluctuating above or below their respective individual trend lines (%+/-M/A). A break below, represented by a negative number, shows weakness, while a break above, represented by a positive percentage, shows strength.
For hundreds of ETF choices, be sure to reference Thursday’s StatSheet.
For this current domestic “Buy” cycle, here’s how some our candidates have fared:

Click image to enlarge.
Again, the %+/-M/A column above shows the position of the various ETFs in relation to their respective long-term trend lines, while the trailing sell stops are being tracked in the “Off High” column. The “Action” column will signal a “Sell” once the -8% point has been taken out in the “Off High” column. For more volatile sector ETFs, the trigger point is -10%.
3. Trend Tracking Indexes (TTIs)
Our TTIs dumped with the major indexes. The International one has taken the lead to the downside and is now within striking distance of signaling a “Sell” for that arena.
This is how we closed 09/20/2021:
Domestic TTI: +4.00% above its M/A (prior close +5.98%)—Buy signal effective 07/22/2020.
International TTI: +1.43% above its M/A (prior close +3.15%)—Buy signals effective 07/22/2020.
Disclosure: I am obliged to inform you that I, as well as my advisory clients, own some of the ETFs listed in the above table. Furthermore, they do not represent a specific investment recommendation for you, they merely show which ETFs from the universe I track are falling within the specified guidelines.
Contact Ulli