
- Moving the markets
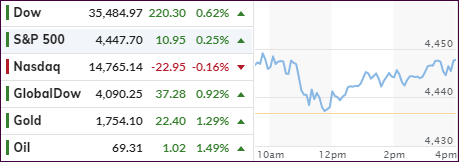
Despite worsening inflation numbers, the markets jumped right after the opening bell, with only the Nasdaq losing momentum during the session, while the Dow and S&P 500 remained solidly in the green.
July’s CPI showed that prices surged 5.4% YoY, which was a tad higher than expectations of 5.3%. MoM the CPI increased at a rate of 0.5% in July. Sure, this could have supported a sell-off, but traders looked at it from a different perspective.
Because, when excluding the energy and food prices, the rise was only 0.3% last month, which was below the expected 0.4% increase. That’s how you turn a negative into a positive giving markets a reason to rally. After all, who uses food and energy anyway?
If you can believe it, this inflation reading, according to the mood on Wall Street, supports the Fed’s belief that these inflationary pressures are still “transitory” and a sign that the economy is indeed recovering from the pandemic. Go figure…
The battle between “growth” and “value” continued unabated, as Small Caps (VBK) took an early hit but managed to crawl back to their breakeven point, while “value” (RPV) ran with the bulls all day to score a 1.30% gain.
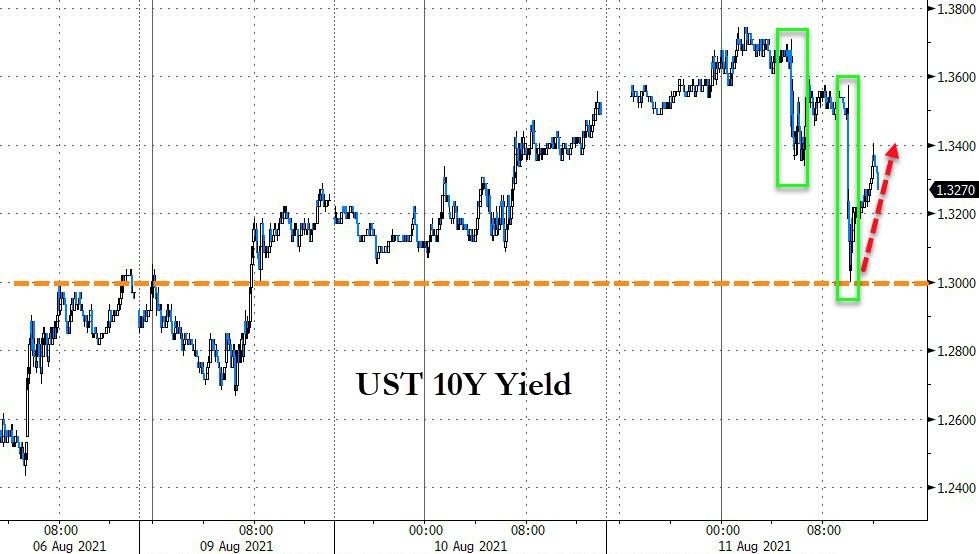
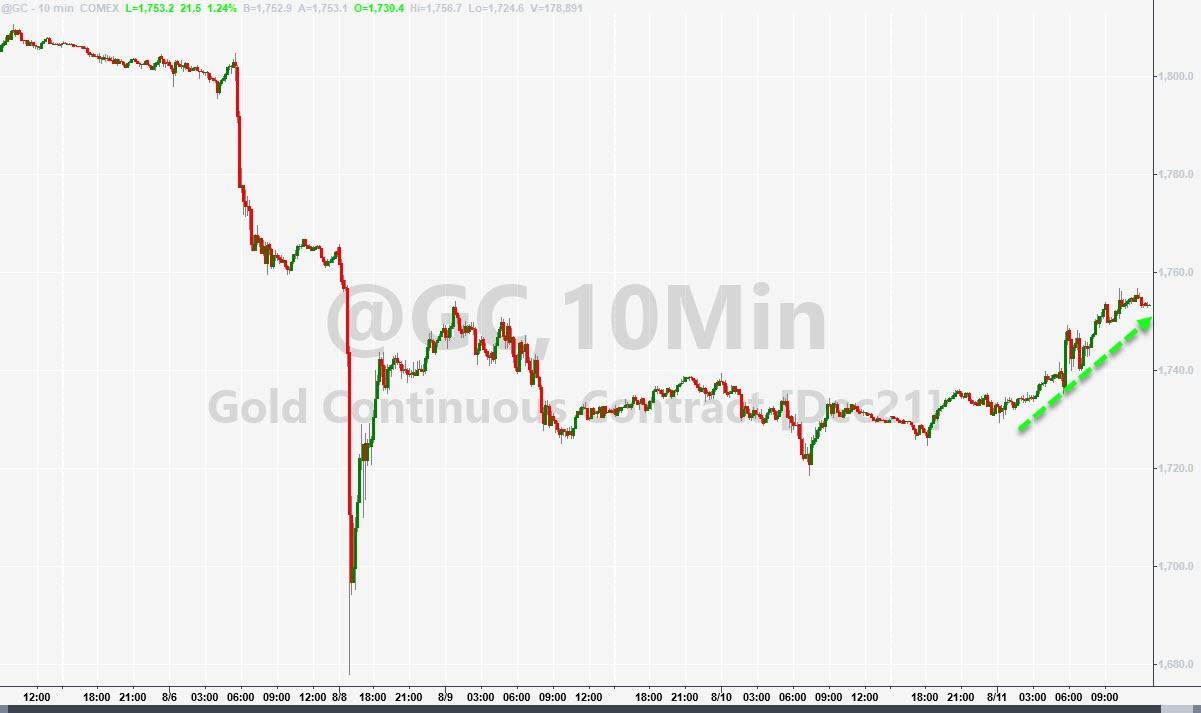
Bond yields stair stepped lower, with the 10-year bouncing off its 1.3% level to end around 1.34%, while the US Dollar index swan dived back to its unchanged level for the week. Despite that mixed showing, Gold surged higher with GLD adding 1.38% and again pursuing its $1,800 level.
Tomorrow, we will find out if the Producer Price Index (PPI) will have a surprise in store for the markets.
2. ETFs in the Spotlight
In case you missed the announcement and description of this section, you can read it here again.
It features some of the 10 broadly diversified domestic and sector ETFs from my HighVolume list as posted every Saturday. Furthermore, they are screened for the lowest MaxDD% number meaning they have been showing better resistance to temporary sell offs than all others over the past year.
The below table simply demonstrates the magnitude with which these ETFs are fluctuating above or below their respective individual trend lines (%+/-M/A). A break below, represented by a negative number, shows weakness, while a break above, represented by a positive percentage, shows strength.
For hundreds of ETF choices, be sure to reference Thursday’s StatSheet.
For this current domestic “Buy” cycle, here’s how some our candidates have fared:
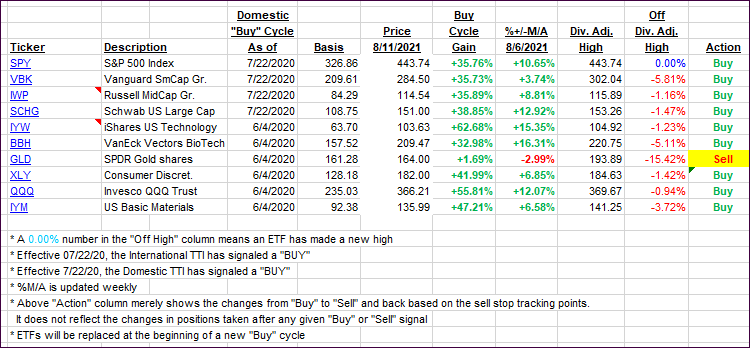
Click image to enlarge.
Again, the %+/-M/A column above shows the position of the various ETFs in relation to their respective long-term trend lines, while the trailing sell stops are being tracked in the “Off High” column. The “Action” column will signal a “Sell” once the -8% point has been taken out in the “Off High” column. For more volatile sector ETFs, the trigger point is -10%.
3. Trend Tracking Indexes (TTIs)
Our TTIs ramped higher, with the International one taking the lead.
This is how we closed 08/11/2021:
Domestic TTI: +11.43% above its M/A (prior close +10.72%)—Buy signal effective 07/22/2020.
International TTI: +8.27% above its M/A (prior close +7.27%)—Buy signals effective 07/22/2020.
Disclosure: I am obliged to inform you that I, as well as my advisory clients, own some of the ETFs listed in the above table. Furthermore, they do not represent a specific investment recommendation for you, they merely show which ETFs from the universe I track are falling within the specified guidelines.
All linked charts above are courtesy of Bloomberg via ZeroHedge.
Contact Ulli