
- Moving the markets
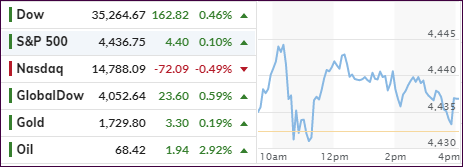
Despite the Dow and S&P 500 climbing into record territory right after the opening, it was only the Dow that maintained its bullish momentum into the close. The S&P 500 floundered and battled with its flatline but managed to close a tad above it, while the Nasdaq stumbled in the red throughout the session.
Supporting the Dow was the Senate’s passage of the $1 trillion infrastructure package, which traders assume to assist those stocks benefiting from economic growth. At least that’s the theory, but as I have pointed out before, the economy needs a boost, as peak growth has decelerated.
Overall, markets were mixed with Small Caps (VBK) taking a hit of -0.78%, while “value,” as represented by RPV, added a solid +1.32%. That performance was outdone by the Commodities Index (DBC) with +1.81%, as inflation persists and creeps through that sector.
Bond yields continued their charge higher with the 10-year reaching almost 1.35%, which is a massive rebound from the lows of 1.12% just a few days ago. Given higher yields, it’s no surprise that the US Dollar ramped higher and has now reached a point that is close to its March highs.
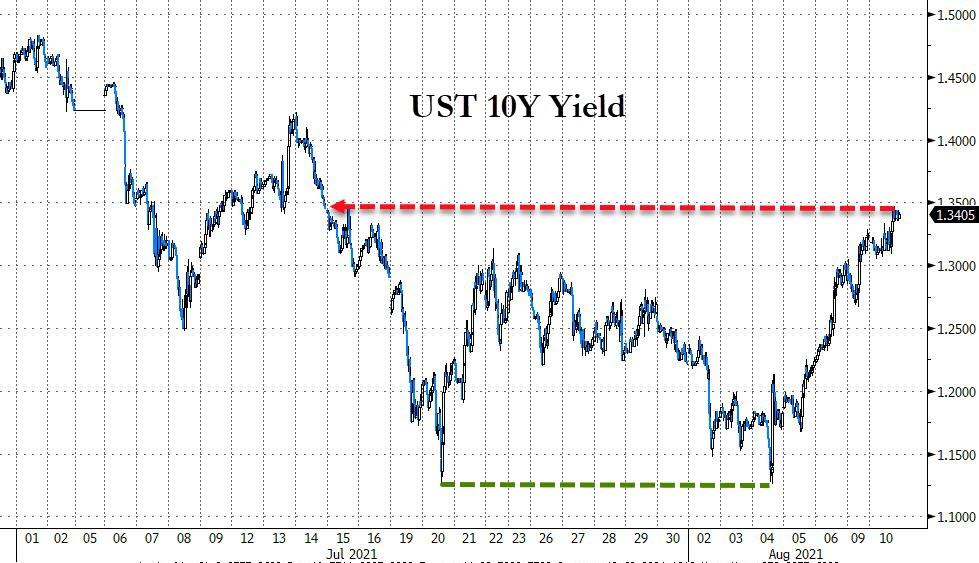
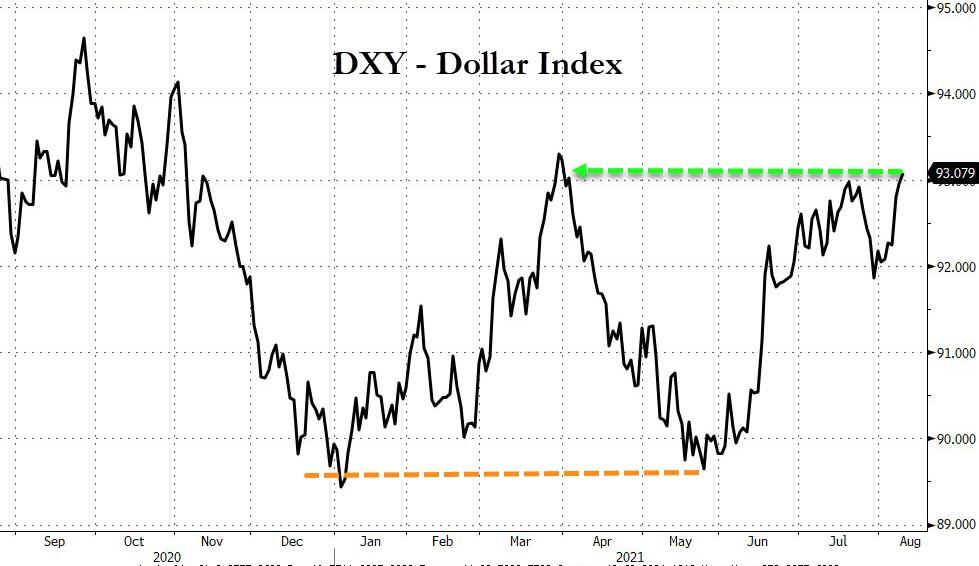
Gold managed to break even and is trying to find some base from which to launch a new attack at its recently lost $1,800 level.
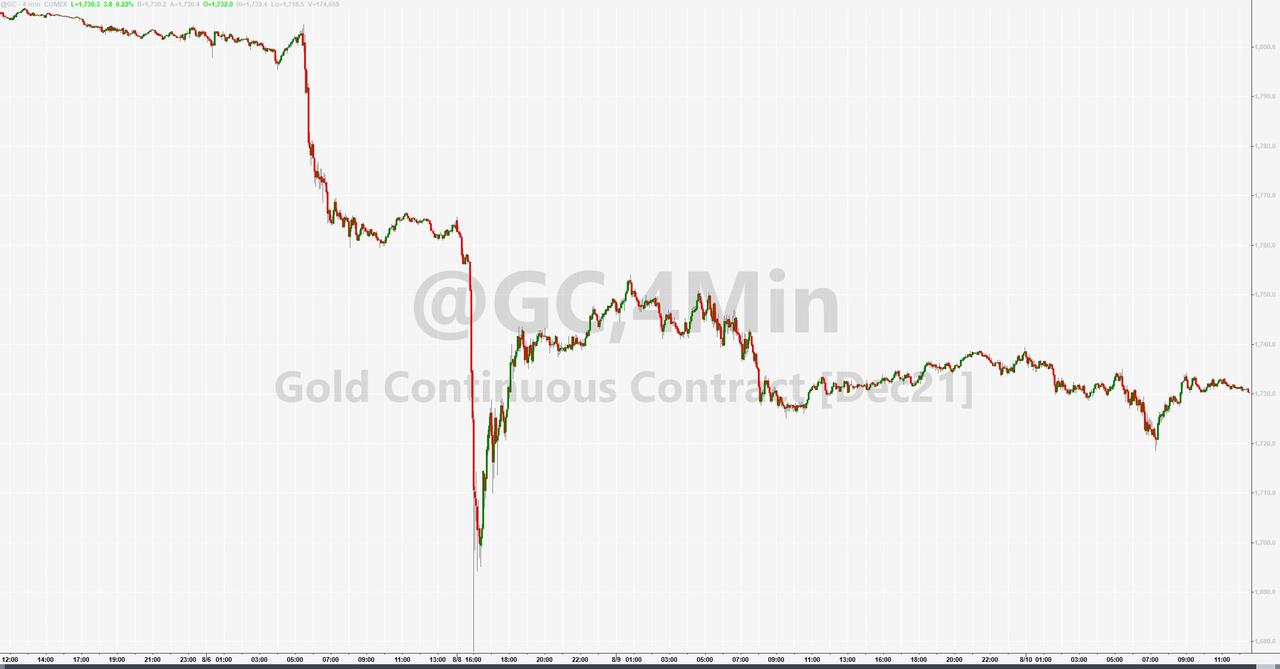
Leave it up to ZeroHedge to come up with another historical trend analysis, this time comparing the current S&P 500 performance with that of 1987:
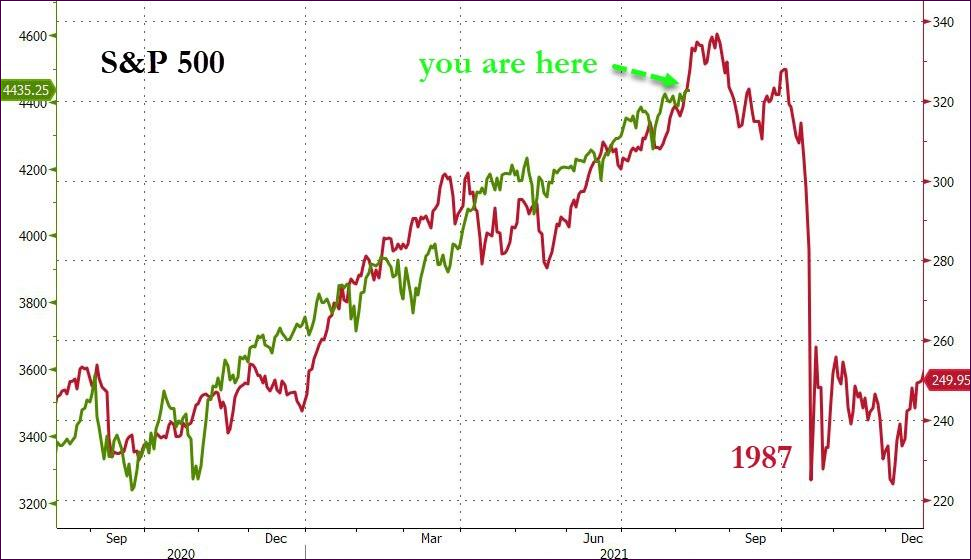
I for one can’t wait to see if history repeats itself.
2. ETFs in the Spotlight
In case you missed the announcement and description of this section, you can read it here again.
It features some of the 10 broadly diversified domestic and sector ETFs from my HighVolume list as posted every Saturday. Furthermore, they are screened for the lowest MaxDD% number meaning they have been showing better resistance to temporary sell offs than all others over the past year.
The below table simply demonstrates the magnitude with which these ETFs are fluctuating above or below their respective individual trend lines (%+/-M/A). A break below, represented by a negative number, shows weakness, while a break above, represented by a positive percentage, shows strength.
For hundreds of ETF choices, be sure to reference Thursday’s StatSheet.
For this current domestic “Buy” cycle, here’s how some our candidates have fared:
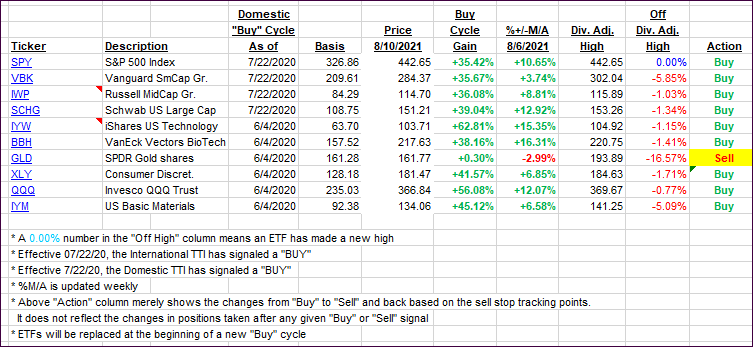
Click image to enlarge.
Again, the %+/-M/A column above shows the position of the various ETFs in relation to their respective long-term trend lines, while the trailing sell stops are being tracked in the “Off High” column. The “Action” column will signal a “Sell” once the -8% point has been taken out in the “Off High” column. For more volatile sector ETFs, the trigger point is -10%.
3. Trend Tracking Indexes (TTIs)
Our TTIs climbed, despite the markets being mixed.
This is how we closed 08/10/2021:
Domestic TTI: +10.72% above its M/A (prior close +10.20%)—Buy signal effective 07/22/2020.
International TTI: +7.27% above its M/A (prior close +6.63%)—Buy signals effective 07/22/2020.
Disclosure: I am obliged to inform you that I, as well as my advisory clients, own some of the ETFs listed in the above table. Furthermore, they do not represent a specific investment recommendation for you, they merely show which ETFs from the universe I track are falling within the specified guidelines.
All linked charts above are courtesy of Bloomberg via ZeroHedge.
Contact Ulli