
- Moving the markets
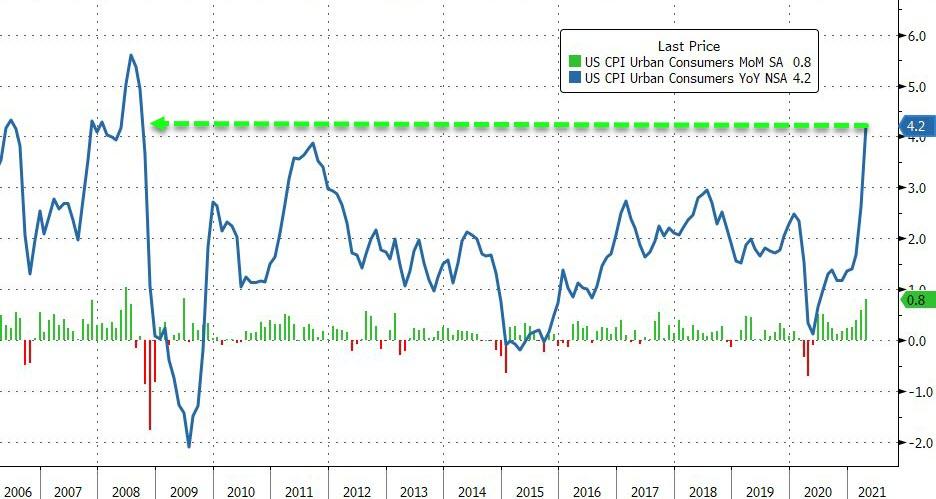
US core consumer price inflation reared its ugly head as a 0.2% expected rise in the CPI index turned out to be wishful thinking with the real number showing a surge of 0.8% MoM, which represents an explosion of 4.2% YoY. As ZeroHedge pointed out, this is the biggest YoY jump since September of 2008 and the biggest MoM jump since June 2008:
Core CPI was expected to rise by the most this millennia, but it was hotter than that. The index for all items less food and energy rose 3.0% over the past 12 months; this was its largest 12-month increase since January 1996… and the MoM jump of 0.92% is the biggest since 1981.
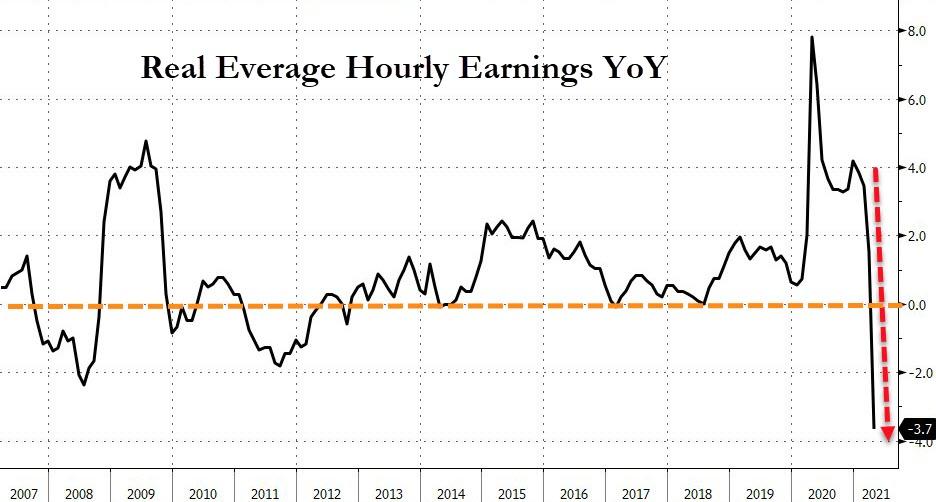
As a reminder though, there is nothing to see here, Fed is focused on jobs, not inflation which is “transitory”… forget about your crumbling cost of living… as real wages crash…
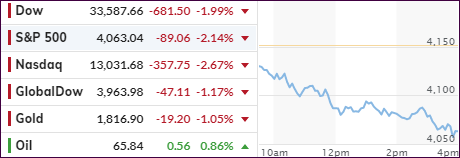
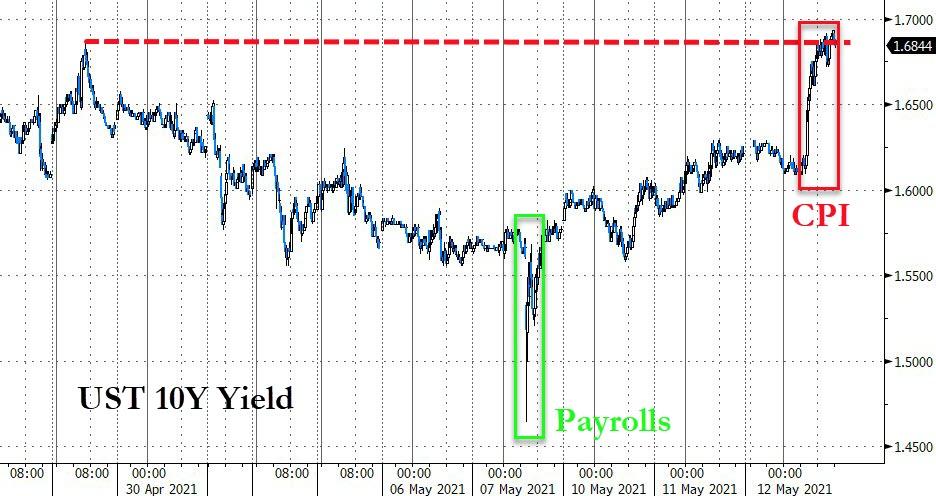
Consequently, the equity markets got thrashed, with the tech sector and Small Caps taking the brunt of the beating. And, as was to be expected, bond yields spiked with the 10-year slashing through the 1.65% level and touching its recent high from April 29.
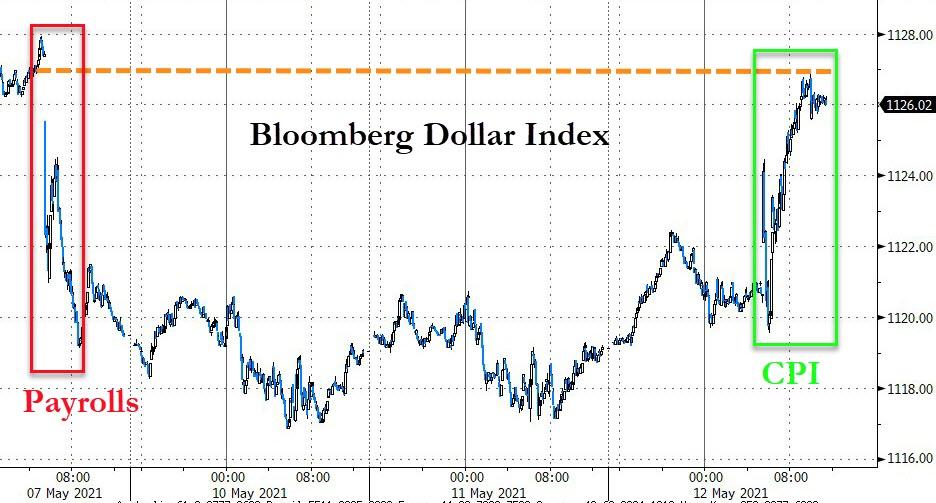
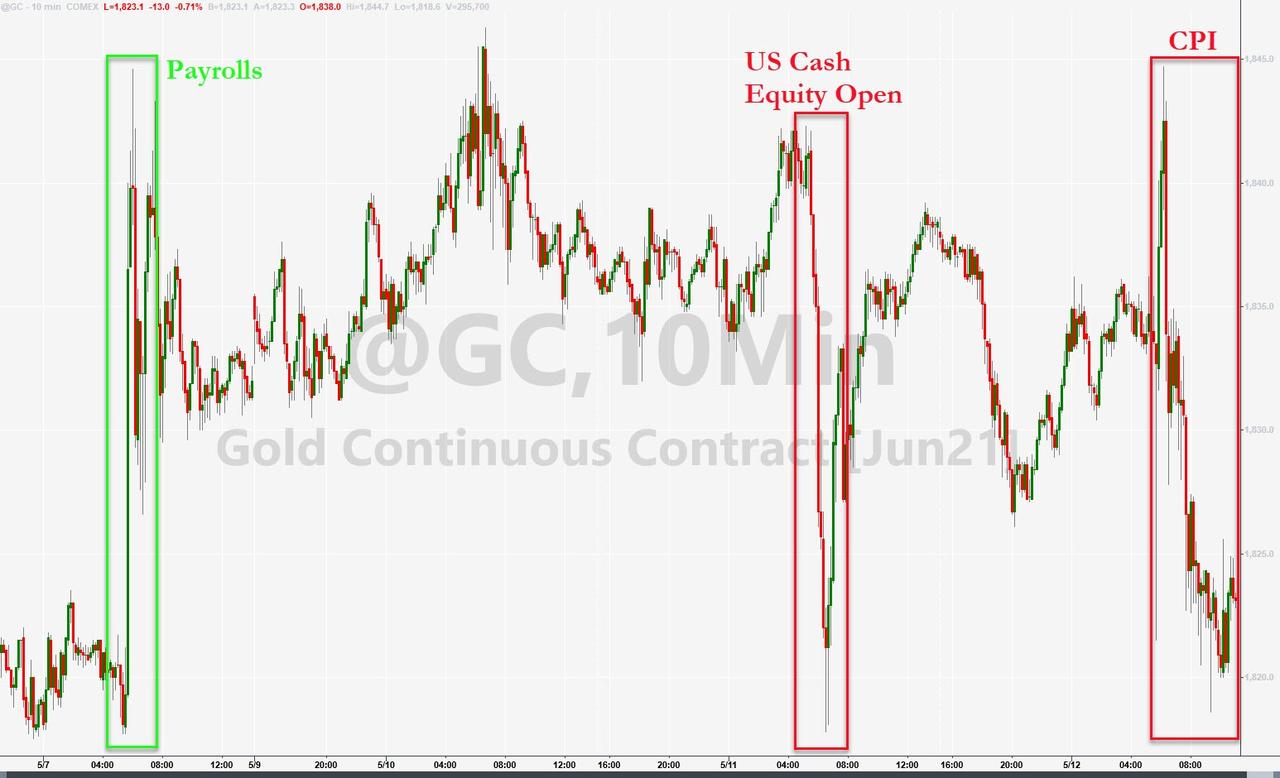
The US Dollar pumped and dumped and then surged higher. The combination of higher yields and a rebounding Dollar took the starch out of Gold’s early upswing, and the precious metal succumbed to the bears as well.
Just like yesterday, there was no place to hide, and it remains to be seen if the dip buyers, who were conspicuously absent today, will make their presence known tomorrow.
2. ETFs in the Spotlight
In case you missed the announcement and description of this section, you can read it here again.
It features some of the 10 broadly diversified domestic and sector ETFs from my HighVolume list as posted every Saturday. Furthermore, they are screened for the lowest MaxDD% number meaning they have been showing better resistance to temporary sell offs than all others over the past year.
The below table simply demonstrates the magnitude with which these ETFs are fluctuating above or below their respective individual trend lines (%+/-M/A). A break below, represented by a negative number, shows weakness, while a break above, represented by a positive percentage, shows strength.
For hundreds of ETF choices, be sure to reference Thursday’s StatSheet.
For this current domestic “Buy” cycle, here’s how some our candidates have fared:
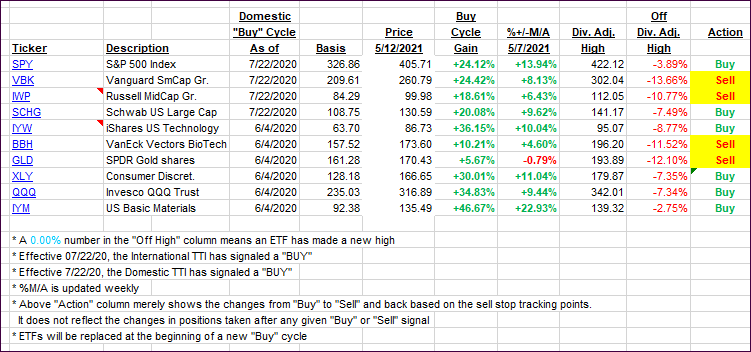
Click image to enlarge.
Again, the %+/-M/A column above shows the position of the various ETFs in relation to their respective long-term trend lines, while the trailing sell stops are being tracked in the “Off High” column. The “Action” column will signal a “Sell” once the -8% point has been taken out in the “Off High” column. For more volatile sector ETFs, the trigger point is -10%.
3. Trend Tracking Indexes (TTIs)
Our TTIs plunged, as “red” was the color of the day for equities.
This is how we closed 05/12/2021:
Domestic TTI: +15.89% above its M/A (prior close +18.52%)—Buy signal effective 07/22/2020.
International TTI: +15.01% above its M/A (prior close +16.32%)—Buy signals effective 07/22/2020.
Disclosure: I am obliged to inform you that I, as well as my advisory clients, own some of the ETFs listed in the above table. Furthermore, they do not represent a specific investment recommendation for you, they merely show which ETFs from the universe I track are falling within the specified guidelines.
Contact Ulli