
ETF Tracker StatSheet
You can view the latest version here.
RECORD HIGHS MEET RISING YIELDS: A MARKET AT ODDS WITH ITSELF
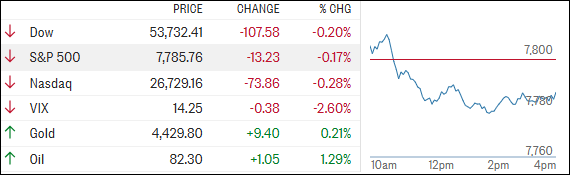
[Chart courtesy of MarketWatch.com]
- Moving the market
Over coffee this morning, I’d say the market’s most impressive feat was its ability to ignore almost everything thrown at it.
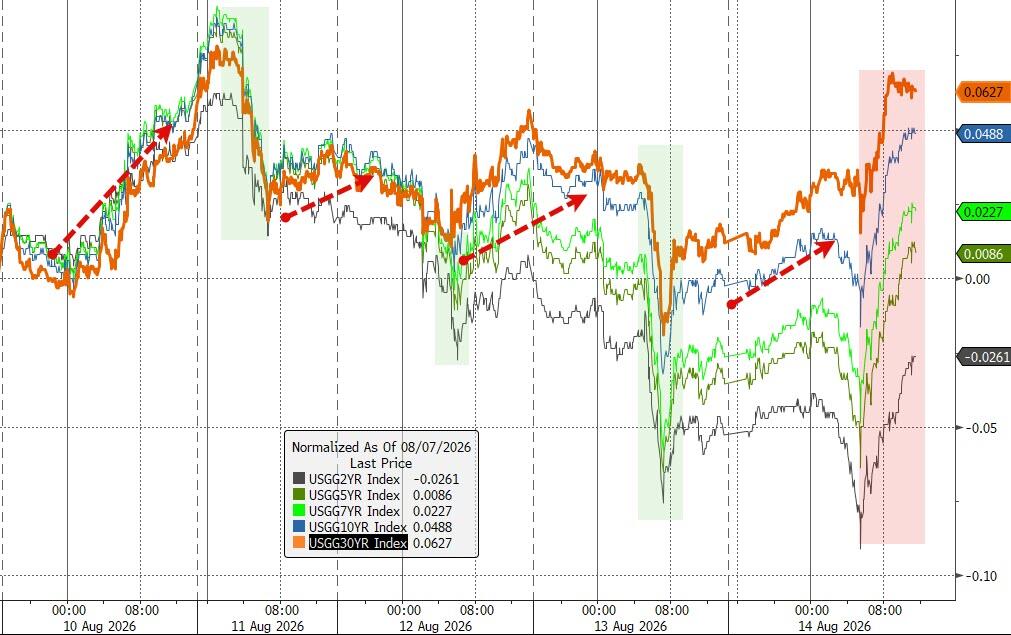
Retail sales came in softer than expected, Applied Materials stumbled more than 4%, oil continued climbing on Middle East tensions, and long-term Treasury yields pushed to levels not seen in decades.
Yet stocks largely held their ground, with the S&P 500 coming off a week filled with fresh record highs.
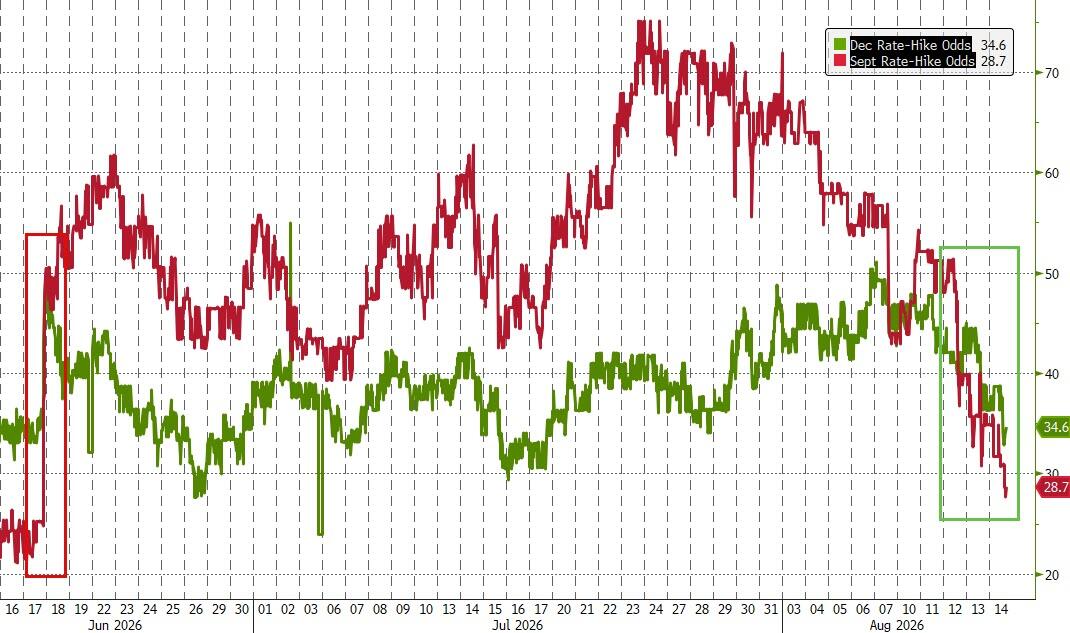
The real story remains the tug-of-war between stocks and bonds. Equity investors are celebrating easing inflation, a friendlier Fed outlook, and exceptionally strong earnings growth, while the bond market seems far less convinced that inflation and deficits are yesterday’s problems.
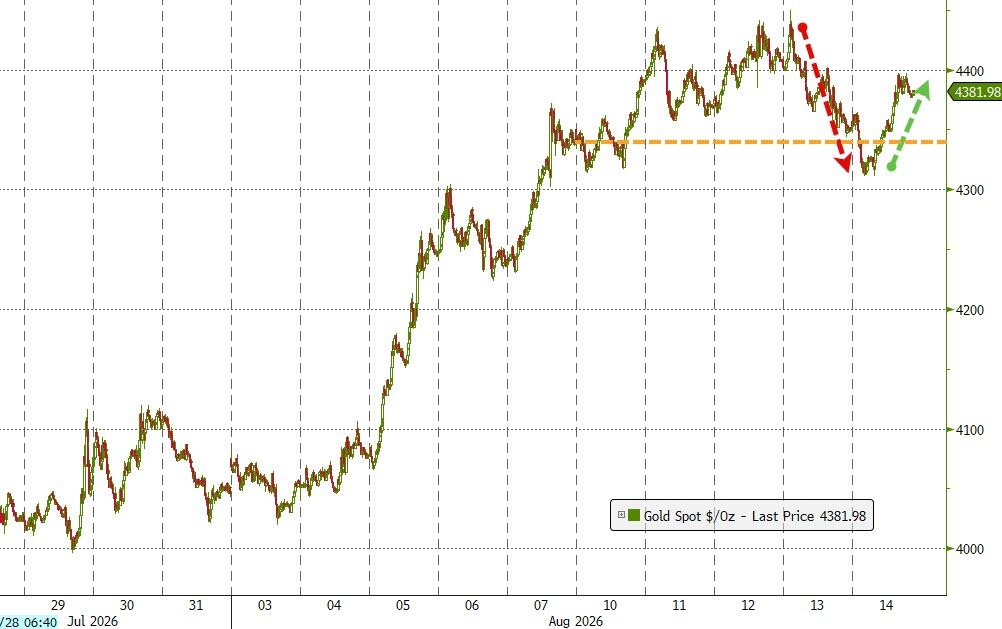
Gold is acting strong, the dollar weakened, and Bitcoin is still pacing back and forth inside its well-worn trading range.
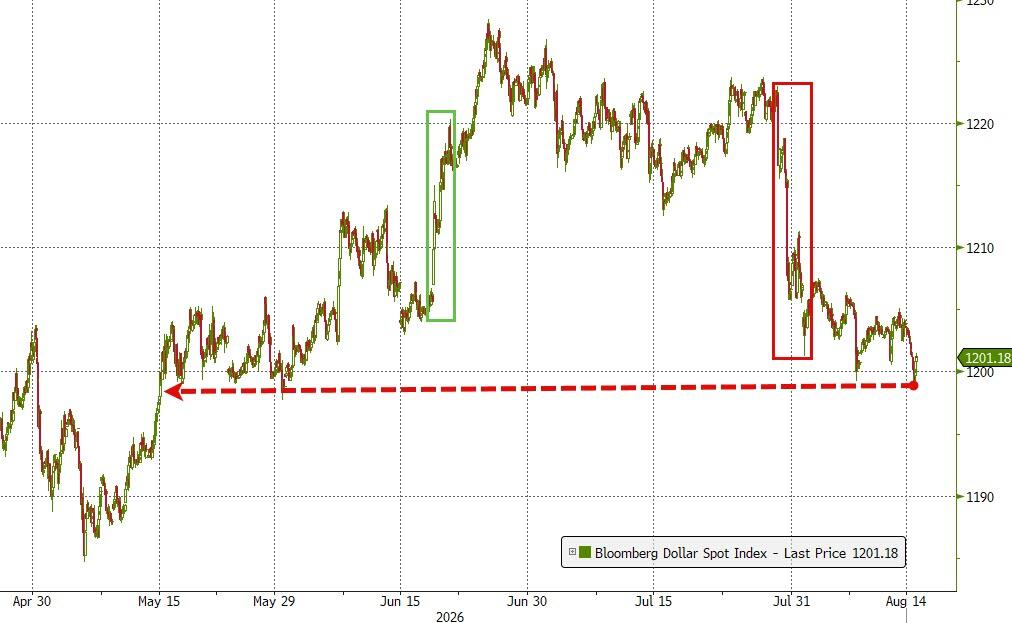
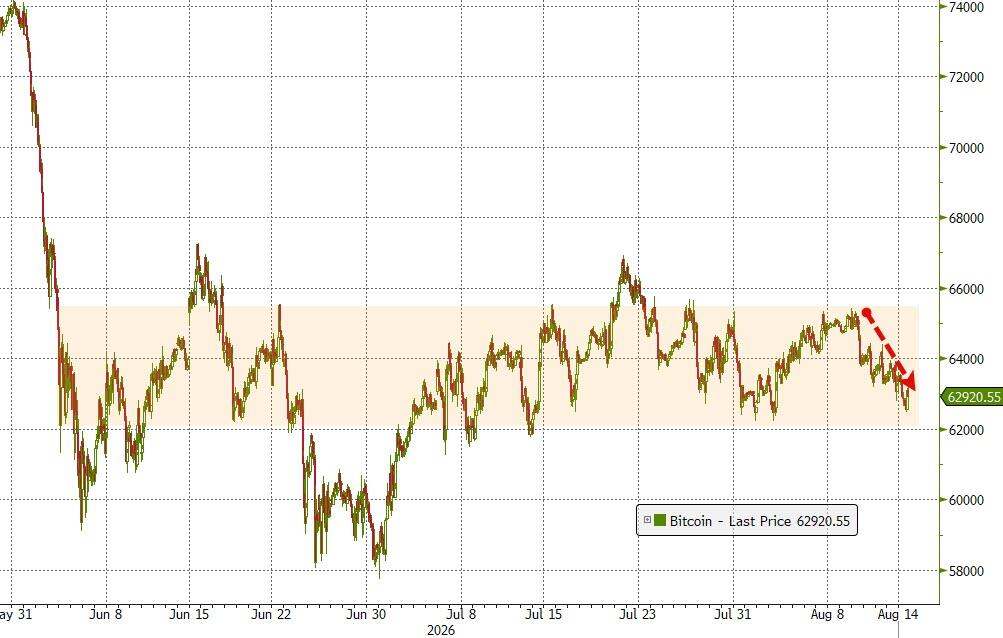
I must admire the resilience of U.S. stocks, but when record-high equity prices are sharing the stage with multi-year high bond yields, I can’t help but wonder: which market is eventually going to blink first?
2. Current domestic “Buy” Cycle (effective 5/20/2025); International “Buy” Cycle (effective 5/8/25)
Our domestic bullish cycle that began on November 21, 2023, concluded on April 3, 2025, following a market downturn triggered by President Trump’s tariff policy announcement.
This development caused significant declines across major indexes and broader market indices. However, markets subsequently rebounded, culminating in a new domestic “Buy” signal taking effect May 20, 2025.
Concurrently, our International Trend Tracking Index (TTI) experienced parallel volatility. On April 4, 2025, it breached critical thresholds, prompting a “Sell” recommendation. This position reversed as global markets recovered, with the International TTI regaining sufficient momentum to issue a new “Buy” signal effective May 8, 2025.
3. Trend Tracking Indexes (TTIs)
Today’s market felt a bit like a Sunday drive with no destination. The major indexes drifted lower and finished in the red, but only by a hair.
Investors largely shrugged off the softer retail sales numbers, choosing instead to focus on a strong rally in the metals space.
Gold and silver led the charge, and even copper decided to join the party, which always gets my attention.
Our TTIs eased slightly on the day, but the bigger picture remains constructive.
Both posted gains for the week, with the domestic TTI turning in a particularly solid performance.
Not a thrilling session by any means, but sometimes the market’s way of standing still is simply to wander around in small circles.
This is how we closed 08/14/2026:
Domestic TTI: +10.67% above its M/A (prior close +11.18%)—Buy signal effective 5/20/25.
International TTI: +8.54% above its M/A (prior close +9.00%)—Buy signal effective 5/8/25.
All linked charts above are courtesy of Bloomberg via ZeroHedge.
———————————————————-
WOULD YOU LIKE TO HAVE YOUR INVESTMENTS PROFESSIONALLY MANAGED?
Do you have the time to follow our investment plans yourself? If you are a busy professional who would like to have his portfolio managed using our methodology, please contact me directly to get more details.
Contact Ulli