
- Moving the markets
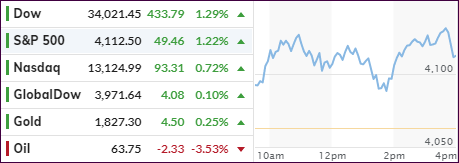
After three days of relentless selling, the major indexes seemed to find a bottom today, as dip buyers stepped in and gave a long overdue assist. The Dow and S&P 500 took the lead, but the much beaten-up Nasdaq managed a decent showing, along with Small Caps, which had taken a severe beating over the past few days.
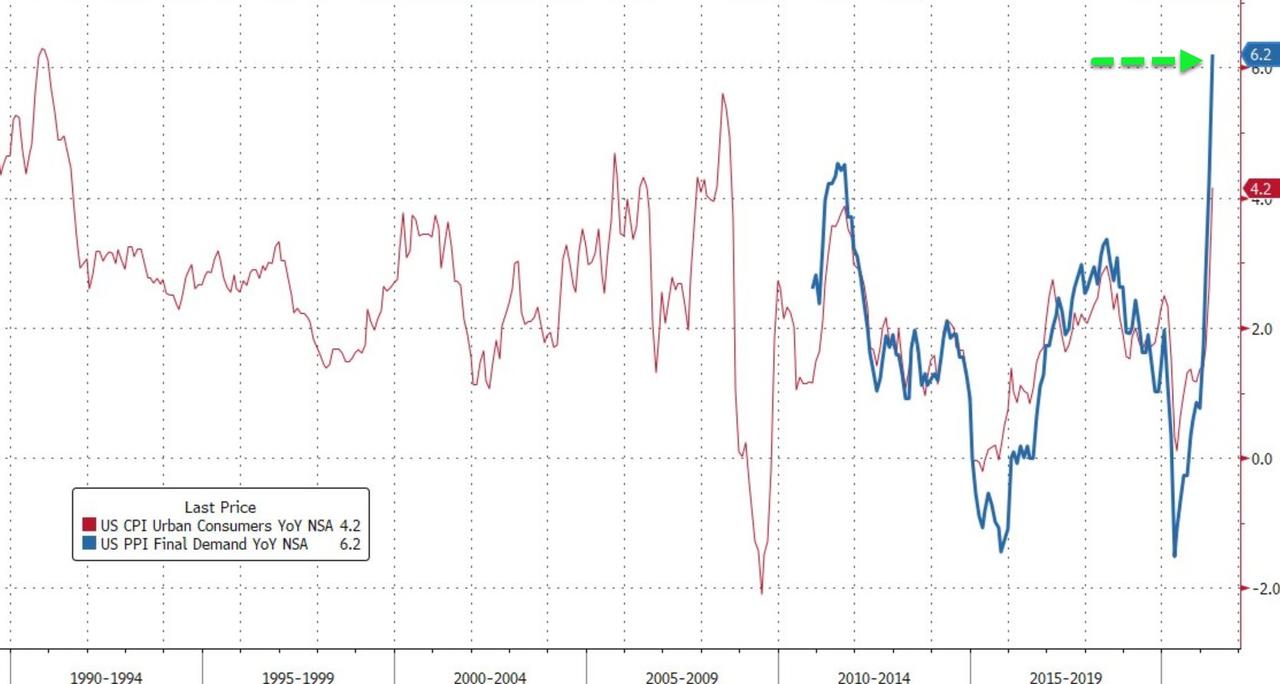
For some reason, yesterday’s inflation print, along with spiking bond yields, were viewed in the rear-view mirror, even though today’s PPI showed that April Producer prices exploded 6.2% YoY, far worse than the expected 5.8%. As ZeroHedge pointed out, sequentially, the PPI was shockingly hot, rising 0.6% MoM, which was double the expected 0.3%.
That means inflation is here to stay, when considering Friday’s disappointing jobs report and this week’s CPI/PPI numbers, you won’t have to look far to see the dreaded “S” word (Stagflation) mentioned by those in the know. If you were around in the early 1980s, you saw a similar pattern, namely inflation and no growth. We’ll have to wait and see if history repeats itself.
Despite dipping into the close, we saw solid gains across the board with “value” still outperforming “growth.” The US Dollar was essentially unchanged, 10-year bond yields slipped to 1.66%, and the Gold ETF GLD managed to eke out a modest gain of 0.42%.
On deck tomorrow will be April retails sales which, according to some analysts, will be another big miss vs. expectations. Why not? Nothing else has met expectations this week, but the question is “how will markets react?”
On a personal note, I am out tomorrow and will not be back in time to write the Friday report. My regular posting will resume on Monday.
2. ETFs in the Spotlight
In case you missed the announcement and description of this section, you can read it here again.
It features some of the 10 broadly diversified domestic and sector ETFs from my HighVolume list as posted every Saturday. Furthermore, they are screened for the lowest MaxDD% number meaning they have been showing better resistance to temporary sell offs than all others over the past year.
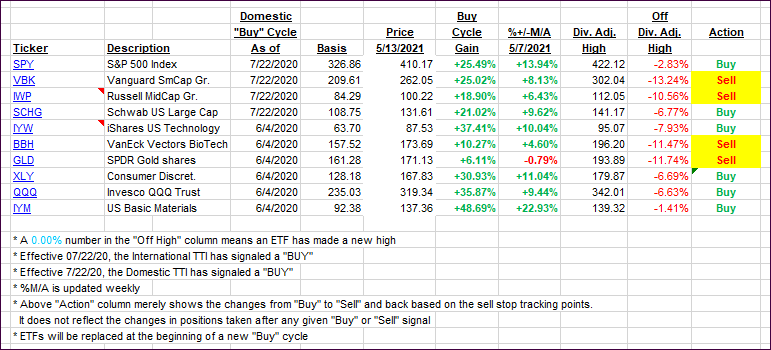
The below table simply demonstrates the magnitude with which these ETFs are fluctuating above or below their respective individual trend lines (%+/-M/A). A break below, represented by a negative number, shows weakness, while a break above, represented by a positive percentage, shows strength.
For hundreds of ETF choices, be sure to reference Thursday’s StatSheet.
For this current domestic “Buy” cycle, here’s how some our candidates have fared:
Click image to enlarge.
Again, the %+/-M/A column above shows the position of the various ETFs in relation to their respective long-term trend lines, while the trailing sell stops are being tracked in the “Off High” column. The “Action” column will signal a “Sell” once the -8% point has been taken out in the “Off High” column. For more volatile sector ETFs, the trigger point is -10%.
3. Trend Tracking Indexes (TTIs)
Our TTIs bounced back with a comeback rally wiping out some of the recent setbacks.
This is how we closed 05/13/2021:
Domestic TTI: +17.46% above its M/A (prior close +15.89%)—Buy signal effective 07/22/2020.
International TTI: +15.22% above its M/A (prior close +15.01%)—Buy signals effective 07/22/2020.
Disclosure: I am obliged to inform you that I, as well as my advisory clients, own some of the ETFs listed in the above table. Furthermore, they do not represent a specific investment recommendation for you, they merely show which ETFs from the universe I track are falling within the specified guidelines.
All linked charts above are courtesy of Bloomberg via ZeroHedge.
Contact Ulli