
- Moving the markets
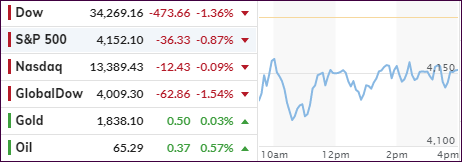
We saw another wild day in the markets with the major indexes tanking, as the Nasdaq was still negatively influenced by rising valuations and ever climbing inflation fears.
It was a strange day, because the tech sector rebounded in the afternoon, in part due to Amazon Buyback rumors, which traders took as a hint that the sell-off may have been overdone. As a result, the Nasdaq bounced back to its unchanged line, but the other 2 major indexes remained in the red with the Dow leading the downside charge.
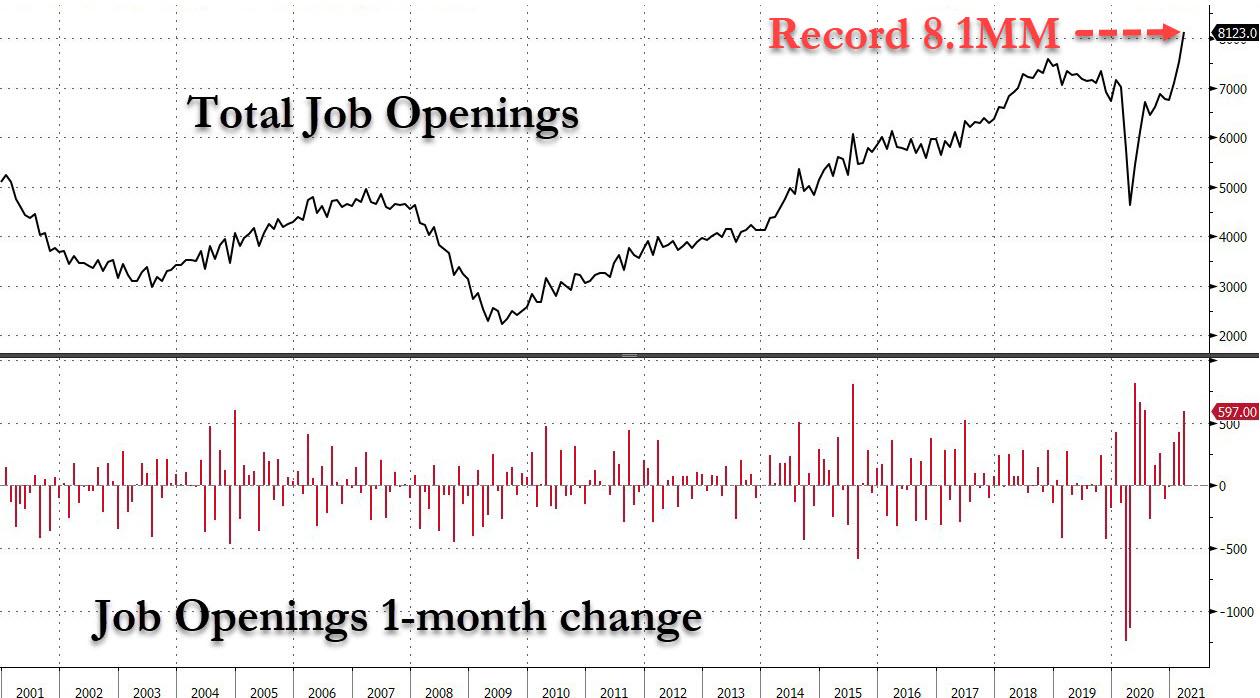
On the economic side, we learned that job openings soared to a record high of 8.1 million with the labor market being totally out of sync. Nobody wants to work and, thanks to the current administration’s monetary give-away, it’s more “profitable” for many to sit at home and collect stimulus checks and other assistance in amounts larger than their salaries would be.
And that does not only apply to low-end jobs. Commented ZH:
It looks like the hiring (and retention) shortage isn’t just for rank-and-file minimum wage jobs.
UBS has now said that, amidst historic competition and a “retention crisis” in the investment banking world (which we noted weeks ago), it is going to pay a one-time $40,000 bonus to its global banking analysts when they are promoted. This is double what some of the bank’s competitors are offering.
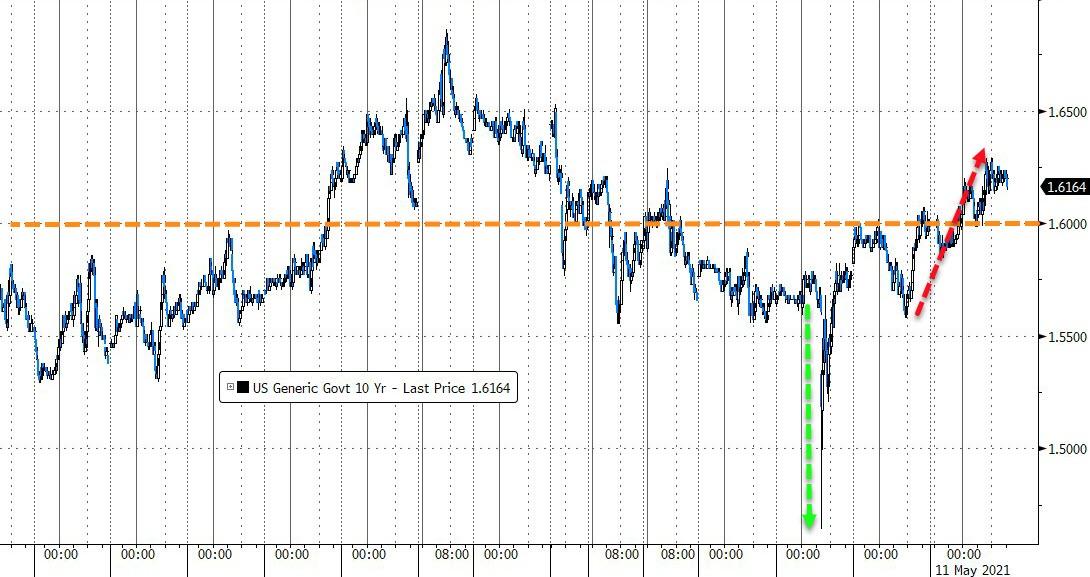
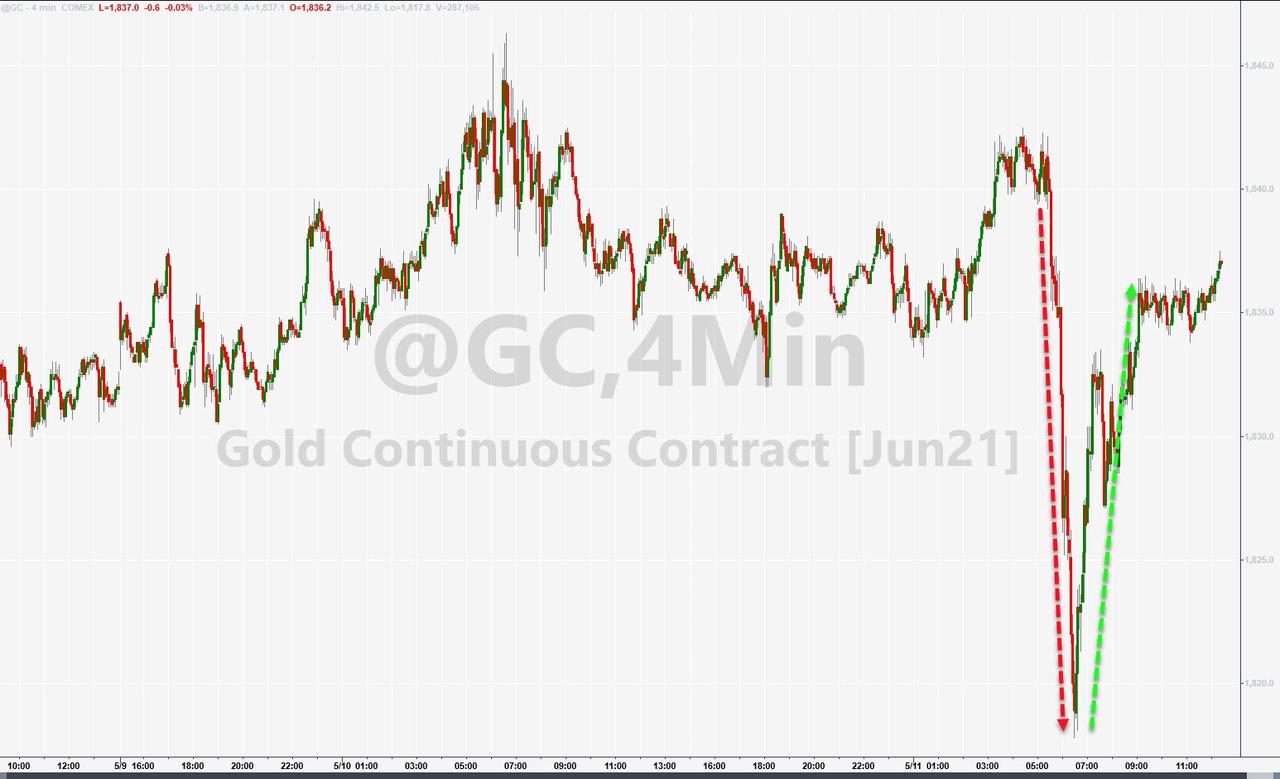
Despite the chaos in the markets, the US Dollar went sideways again, as it did for the past 2 sessions. 10-year bond yields flip flopped and, after diving sharply early on, surged back into the close and over the 1.6% level. Gold followed the same theme by recovering towards the unchanged line after an early drop.
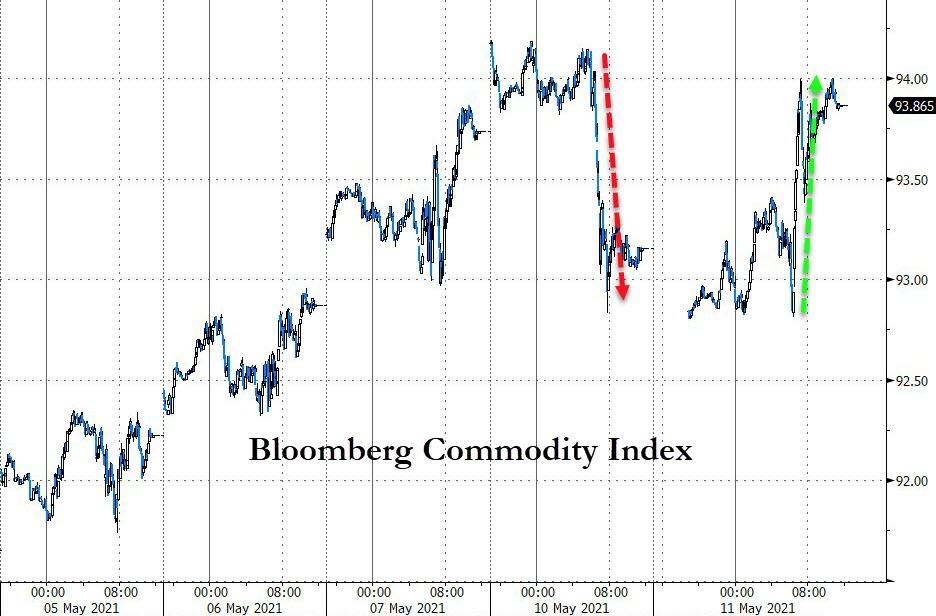
The only solid green number we saw all day was the Commodity index which, after yesterday’s dump, reversed and surged higher.
No matter what asset class you owned, there was no place to hide, because the bears were in no mood of taking prisoners.
2. ETFs in the Spotlight
In case you missed the announcement and description of this section, you can read it here again.
It features some of the 10 broadly diversified domestic and sector ETFs from my HighVolume list as posted every Saturday. Furthermore, they are screened for the lowest MaxDD% number meaning they have been showing better resistance to temporary sell offs than all others over the past year.
The below table simply demonstrates the magnitude with which these ETFs are fluctuating above or below their respective individual trend lines (%+/-M/A). A break below, represented by a negative number, shows weakness, while a break above, represented by a positive percentage, shows strength.
For hundreds of ETF choices, be sure to reference Thursday’s StatSheet.
For this current domestic “Buy” cycle, here’s how some our candidates have fared:
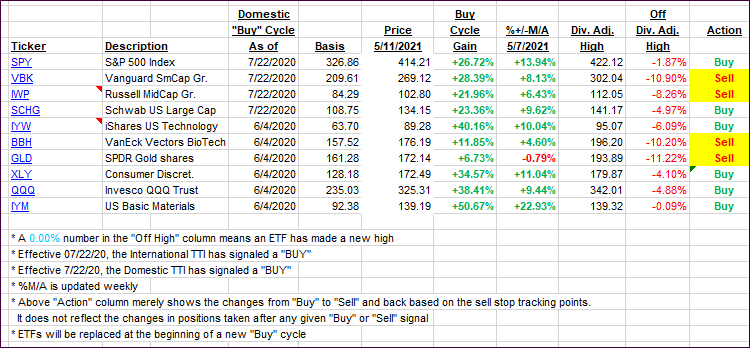
Click image to enlarge.
Again, the %+/-M/A column above shows the position of the various ETFs in relation to their respective long-term trend lines, while the trailing sell stops are being tracked in the “Off High” column. The “Action” column will signal a “Sell” once the -8% point has been taken out in the “Off High” column. For more volatile sector ETFs, the trigger point is -10%.
3. Trend Tracking Indexes (TTIs)
Our TTIs succumbed to broad selling and closed lower.
This is how we closed 05/11/2021:
Domestic TTI: +18.52% above its M/A (prior close +19.96%)—Buy signal effective 07/22/2020.
International TTI: +16.32% above its M/A (prior close +18.05%)—Buy signals effective 07/22/2020.
Disclosure: I am obliged to inform you that I, as well as my advisory clients, own some of the ETFs listed in the above table. Furthermore, they do not represent a specific investment recommendation for you, they merely show which ETFs from the universe I track are falling within the specified guidelines.
Contact Ulli