
- Moving the markets
An early rally got cut in half by the end of the session, when Fed Vice chairman Clarida opined that more support for the economy was needed, but he expects a rebound by next quarter, despite the current massive drop in unemployment and GDP.
He noted:
“More policy support will be needed from the Fed and possibly also fiscal policy. It just depends on how this evolves.”
“Realistically, it’s going to take some time for the labor market to recover from this shock. I do think the recovery can commence in the second half of the year.”
“The Fed will employ “forceful, proactive, and aggressive” policies “until we’re comfortable the economy is on the road to recovery, especially for Main Street. We can’t minimize that we are in a recession here.”
This was not what markets had expected, especially not the “R” word, so south we went, but the major indexes still managed to come out with some decent gains.
The fact that the markets are too optimistic was brought home by Nomura’s managing director, Charlie McElligott:
“Summer could bring hard economic data collapsing like we’ve never seen before, terrible corporate guidance, stories of pending bankruptcies, and a second wave of layoffs that will hit the white-collar sector. Rising trade-war rhetoric from the White House as a presidential election campaign heats up could present more risk.”
“That’s why I think folks are getting ready to hit the wall again, with this idea we’ve moved out of stabilization and now we’re back into the harsh reality of what this is, without having a Federal Reserve boost and no more stimulus checks until things get a lot worse.”
“The good news? The September to December period could look more constructive for equities, though much depends on if we get hit by a second wave of the virus.”
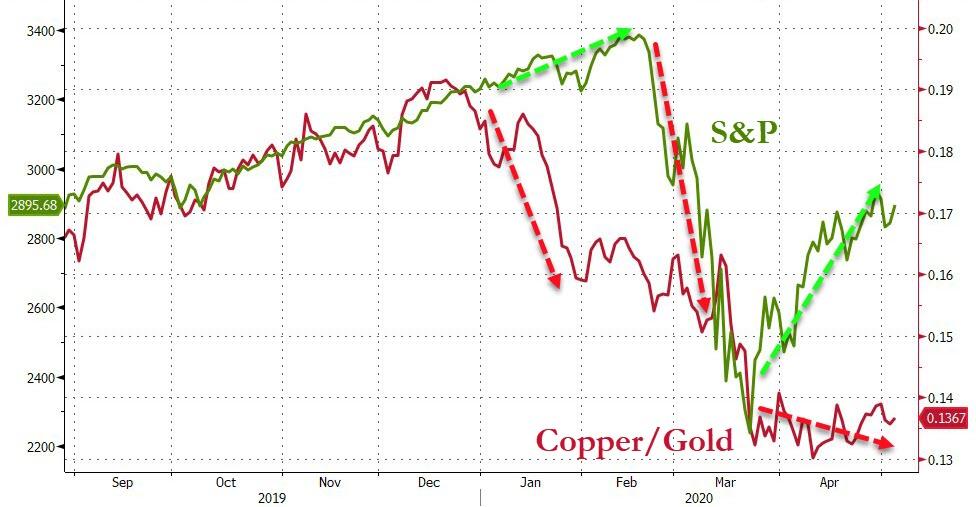
Nobody knows what’s next, but if Bloomberg’s chart is correct, the disconnect will continue until the S&P 500 snaps back down to the Copper/Gold ratio, the direction of which was spot on earlier this year.
2. ETFs in the Spotlight
In case you missed the announcement and description of this section, you can read it here again.
It features some of the 10 broadly diversified domestic and sector ETFs from my HighVolume list as posted every Saturday. Furthermore, they are screened for the lowest MaxDD% number meaning they have been showing better resistance to temporary sell offs than all others over the past year.
The below table simply demonstrates the magnitude with which these ETFs are fluctuating above or below their respective individual trend lines (%+/-M/A). A break below, represented by a negative number, shows weakness, while a break above, represented by a positive percentage, shows strength.
For hundreds of ETF choices, be sure to reference Thursday’s StatSheet.
For this past domestic “Buy” cycle, which ended on 2/27/2020, here’s how some our candidates have fared:
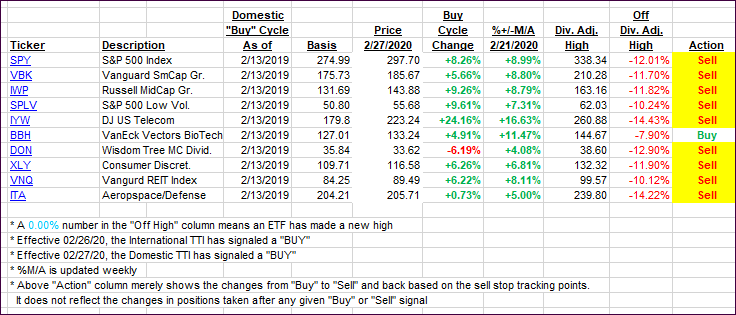
Click image to enlarge
Again, the %+/-M/A column above shows the position of the various ETFs in relation to their respective long-term trend lines, while the trailing sell stops are being tracked in the “Off High” column. The “Action” column will signal a “Sell” once the -8% point has been taken out in the “Off High” column. For more volatile sector ETFs, the trigger point is -10%.
3. Trend Tracking Indexes (TTIs)
Our TTIs improved a tad as markets gains were muted.
This is how we closed 05/05/2020:
Domestic TTI: -11.19% below its M/A (prior close -11.59%)—Sell signal effective 02/27/2020
International TTI: -12.98% below its M/A (prior close -13.74%)—Sell signal effective 02/26/2020
Disclosure: I am obliged to inform you that I, as well as my advisory clients, own some of the ETFs listed in the above table. Furthermore, they do not represent a specific investment recommendation for you, they merely show which ETFs from the universe I track are falling within the specified guidelines.
Contact Ulli