
- Moving the markets
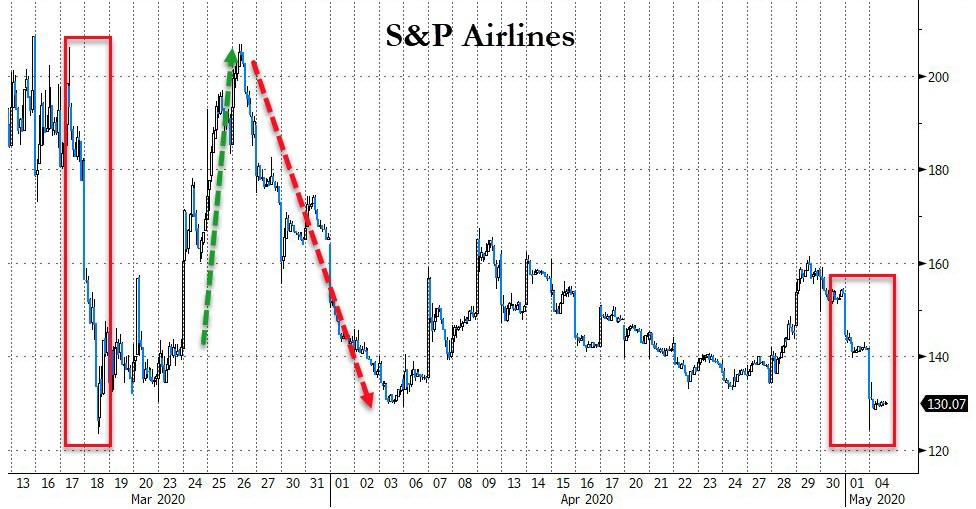
After a couple of down days in the equity markets, a bounce-back was in order, although the conditions were not favorable. Sunday’s news that Warren Buffett had sold all his airline stocks took a toll on the futures markets, which subsequently translated into a weak opening.
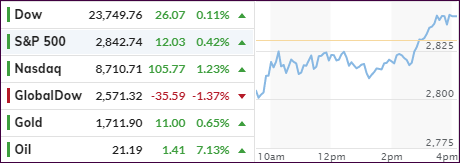
The major indexes spent most of the session bobbing and weaving in the red except for the Nasdaq, which showed more staying power and ended up closing solidly in the green.
But, as we’ve seen many times in the past, a magic afternoon levitation pumped the weaker indexes to a green close, despite US Manufacturers New Orders crashing by the most ever. But as we have learned, underlying fundamentals do not matter, until one day they do.
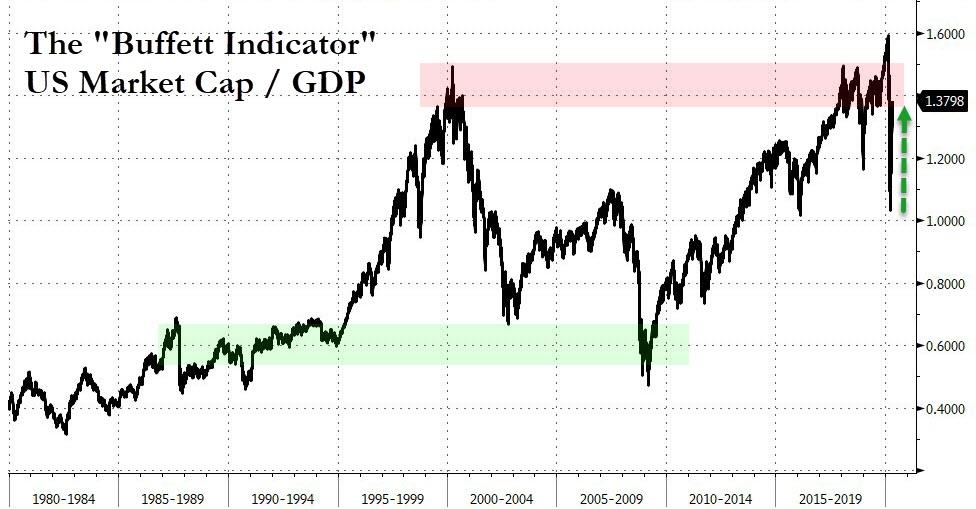
Yet rising U.S.-China tensions with the Covid-19 blame game going on full force, along with new threats of tariffs, could not stop the afternoon ramp. And that despite Buffett’s many warnings, including his widely publicized indicator, US Market Cap/GDP, which Bloomberg presents in this chart. It clearly shows his indicator being in the danger zone.
Some good news bad news headlines, with the bad ones outscoring the only good one, did nothing to slows the market ascent. As ZH commented:
Good news…
Coronavirus Defeated By Experimental Antibody That Targets Spike Protein
But…
American Power Grid ‘Vulnerable’ To Chinese Cyberattacks, Navarro Warns
Q1 GDP To Be Revised Drastically Lower To -8%
NYT Publishes Grim CDC Projections Calling For Daily Coronavirus Deaths To Double By June
In the end, the indexes were trying to find some support, which they surely need ahead of some of the big econ announcements later this week like Jobless Claims and Unemployment rate.
2. ETFs in the Spotlight
In case you missed the announcement and description of this section, you can read it here again.
It features some of the 10 broadly diversified domestic and sector ETFs from my HighVolume list as posted every Saturday. Furthermore, they are screened for the lowest MaxDD% number meaning they have been showing better resistance to temporary sell offs than all others over the past year.
The below table simply demonstrates the magnitude with which these ETFs are fluctuating above or below their respective individual trend lines (%+/-M/A). A break below, represented by a negative number, shows weakness, while a break above, represented by a positive percentage, shows strength.
For hundreds of ETF choices, be sure to reference Thursday’s StatSheet.
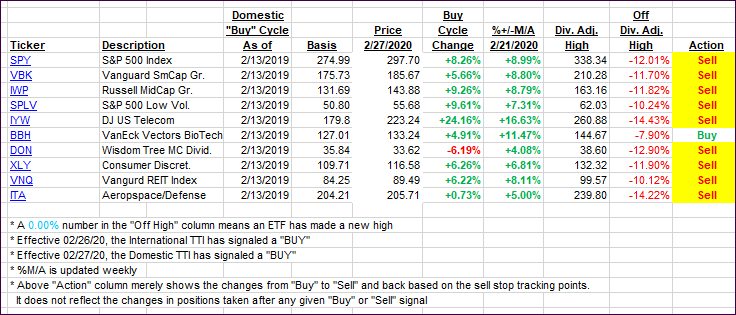
For this past domestic “Buy” cycle, which ended on 2/27/2020, here’s how some our candidates have fared:
Click image to enlarge
Again, the %+/-M/A column above shows the position of the various ETFs in relation to their respective long-term trend lines, while the trailing sell stops are being tracked in the “Off High” column. The “Action” column will signal a “Sell” once the -8% point has been taken out in the “Off High” column. For more volatile sector ETFs, the trigger point is -10%.
3. Trend Tracking Indexes (TTIs)
Our TTIs changed only immaterially due to the markets not making much headway.
This is how we closed 05/04/2020:
Domestic TTI: -11.59% below its M/A (prior close -11.66%)—Sell signal effective 02/27/2020
International TTI: -13.74% below its M/A (prior close -12.64%)—Sell signal effective 02/26/2020
Disclosure: I am obliged to inform you that I, as well as my advisory clients, own some of the ETFs listed in the above table. Furthermore, they do not represent a specific investment recommendation for you, they merely show which ETFs from the universe I track are falling within the specified guidelines.
Contact Ulli