
- Moving the markets
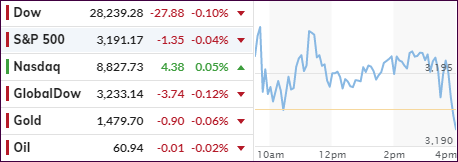
The markets started this Wednesday by inching higher with traders looking to keep a 5-day winning streak alive. Supporting this optimism was the firm belief that the preliminary US-China trade agreement was a done deal, despite some nervousness as to when it would be signed. However, the lack of news to the contrary, was a positive.
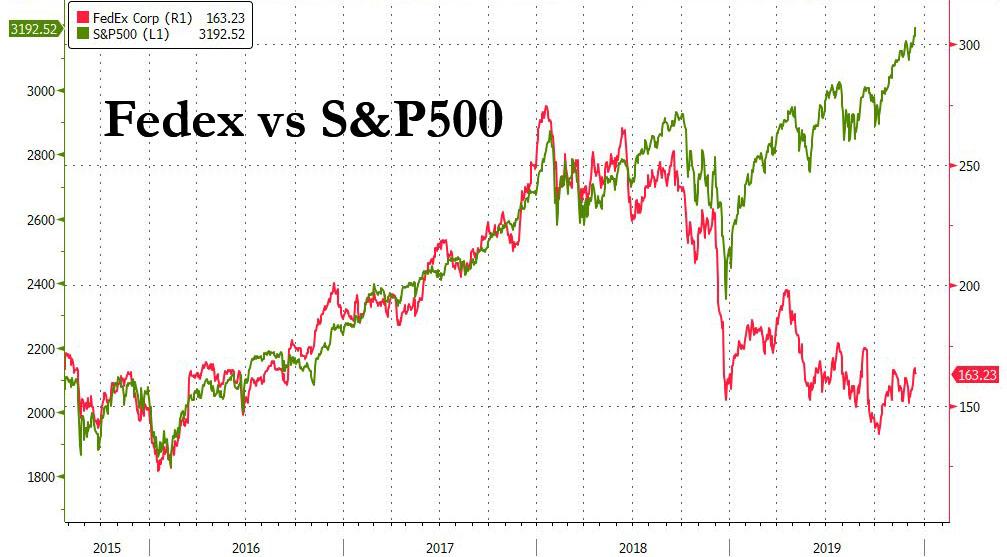
Also lending an assist were waning concerns about the global economic outlook. Although yesterday’s US econ numbers painted an improving picture, except for FedEx, which reported disastrous earnings while slashing guidance. This clearly shows the disconnect between the market and the economy.
The situation remains questionable at best, especially when viewing Eurozone data. After all, pushing interest rates into negative territory, and keeping them there, is not a sign of economic strength; in fact, it is exactly the opposite.
However, stocks remain backed by the Fed stepping in and providing liquidity to get a handle on the unraveling of interest rates in the overnight repo market, which started in September. While this crisis is far from being over, traders and computer algos are simply ignoring it for now—that is until that day arrives when even more emergency stimulus is needed.
In the meantime, the major indexes managed to meander higher, while enjoying another session in record territory, even though they faded into the close.
2. ETFs in the Spotlight
In case you missed the announcement and description of this section, you can read it here again.
It features 10 broadly diversified and sector ETFs from my HighVolume list as posted every Saturday. Furthermore, they are screened for the lowest MaxDD% number meaning they have been showing better resistance to temporary sell offs than all others over the past year.
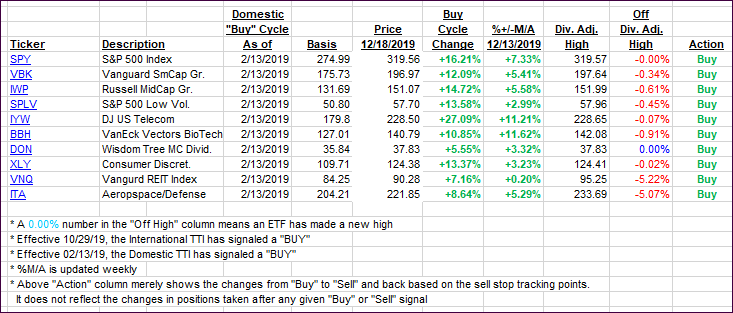
The below table simply demonstrates the magnitude with which some of the ETFs are fluctuating regarding their positions above or below their respective individual trend lines (%+/-M/A). A break below, represented by a negative number, shows weakness, while a break above, represented by a positive percentage, shows strength.
For hundreds of ETF choices, be sure to reference Thursday’s StatSheet.
For this current domestic “Buy” cycle, here’s how some our candidates have fared:
Click image to enlarge
Again, the %+/-M/A column above shows the position of the various ETFs in relation to their respective long-term trend lines, while the trailing sell stops are being tracked in the “Off High” column. The “Action” column will signal a “Sell” once the -8% point has been taken out in the “Off High” column. For more volatile sector ETFs, the trigger point is -10%.
3. Trend Tracking Indexes (TTIs)
Our Trend Tracking Indexes (TTIs) showed some divergence with the Domestic one gaining, while the International one slipped.
Here’s how we closed 12/18/2019:
Domestic TTI: +7.25% above its M/A (prior close +7.09%)—Buy signal effective 02/13/2019
International TTI: +6.04% above its M/A (prior close +6.26%)—Buy signal effective 10/29/2019
Disclosure: I am obliged to inform you that I, as well as my advisory clients, own some of the ETFs listed in the above table. Furthermore, they do not represent a specific investment recommendation for you, they merely show which ETFs from the universe I track are falling within the specified guidelines.
Contact Ulli