
- Moving the markets
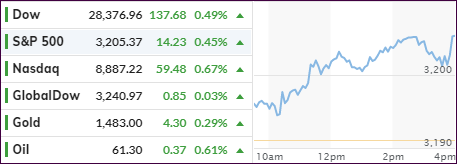
The major indexes set new closing records, unimpressed by the ongoing impeachment saga, the result of which has been simply brushed aside.
Market concerns are virtually non-existent, since the Republican-controlled Senate will be the final judge with expectations being that they will vote against having Trump removed from office.
In other words, from a market perspective, the impeachment is meaningless and a non-event.
Positive vibes, that the US-China trade “truce” will hold, continues to lend support to equities with traders considering recent economic data points as temporarily stabilized.
Even today’s Existing Home Sales Report, showing an unexpected tumble in November, could not shatter confidence.
Of course, the ongoing short squeezes gave an assist to the bullish theme, as they have done for the past 4 days straight, even though today we only saw an opening and closing ramp, as Bloomberg’s chart shows.
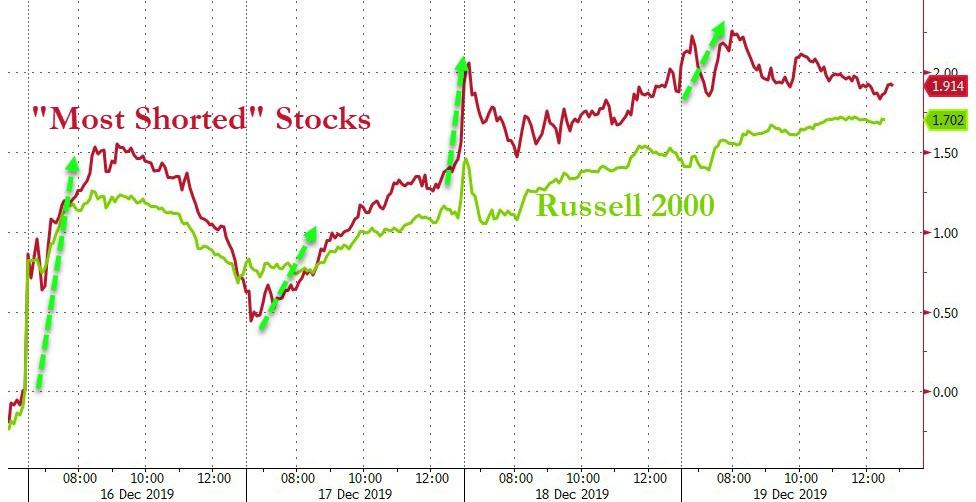
On deck for tomorrow is options expiration day, which can cause more market fluctuations than normal, but it’s unlikely it will have any effect on the major trend.
2. ETFs in the Spotlight
In case you missed the announcement and description of this section, you can read it here again.
It features 10 broadly diversified and sector ETFs from my HighVolume list as posted every Saturday. Furthermore, they are screened for the lowest MaxDD% number meaning they have been showing better resistance to temporary sell offs than all others over the past year.
The below table simply demonstrates the magnitude with which some of the ETFs are fluctuating regarding their positions above or below their respective individual trend lines (%+/-M/A). A break below, represented by a negative number, shows weakness, while a break above, represented by a positive percentage, shows strength.
For hundreds of ETF choices, be sure to reference Thursday’s StatSheet.
For this current domestic “Buy” cycle, here’s how some our candidates have fared:
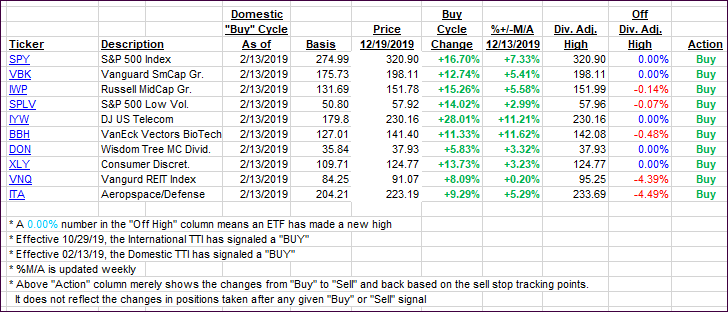
Click image to enlarge
Again, the %+/-M/A column above shows the position of the various ETFs in relation to their respective long-term trend lines, while the trailing sell stops are being tracked in the “Off High” column. The “Action” column will signal a “Sell” once the -8% point has been taken out in the “Off High” column. For more volatile sector ETFs, the trigger point is -10%.
3. Trend Tracking Indexes (TTIs)
Our Trend Tracking Indexes (TTIs) headed higher with the bulls being in charge all day.
Here’s how we closed 12/19/2019:
Domestic TTI: +7.61% above its M/A (prior close +7.25%)—Buy signal effective 02/13/2019
International TTI: +6.29% above its M/A (prior close +6.04%)—Buy signal effective 10/29/2019
Disclosure: I am obliged to inform you that I, as well as my advisory clients, own some of the ETFs listed in the above table. Furthermore, they do not represent a specific investment recommendation for you, they merely show which ETFs from the universe I track are falling within the specified guidelines.
Contact Ulli