
- Moving the markets
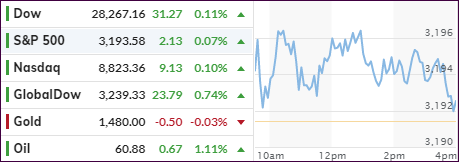
The major indexes opened to the upside, pulled back but managed to bounce around the remainder of the session and, in the end, eked out another green close, although a small one.
The main supporting cast today included positive economic data with manufacturing rebounding and single-family building permits reaching a 12-year high. Job openings rose from October but hiring tumbled.
Good economic news pales in its impact on the stock market compared to headlines about US-China trade talks or the Fed’s spiking the punch bowl via lower rates or more QE. None of that was in the news today, so it was up Trump to keep the good times rolling by focusing on the Fed and tweeting:
“Would be sooo great if the Fed would further lower interest rates and quantitative ease.”
“The Dollar is very strong against other currencies and there is almost no inflation. This is the time to do it. Exports would zoom!“
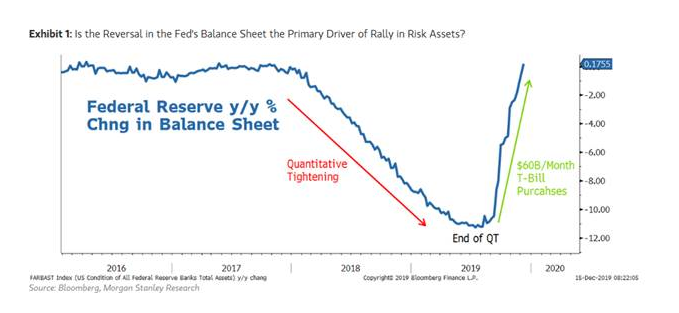
As ZH, pointed out, what about the fact that the dollar has tumbled since the Phase One deal was completed? And the Fed is printing money at its fastest pace since the financial crisis, as this chart shows.
Looks to me that they have been more than compliant with Trump’s wishes, whether you agree with the policy or not.
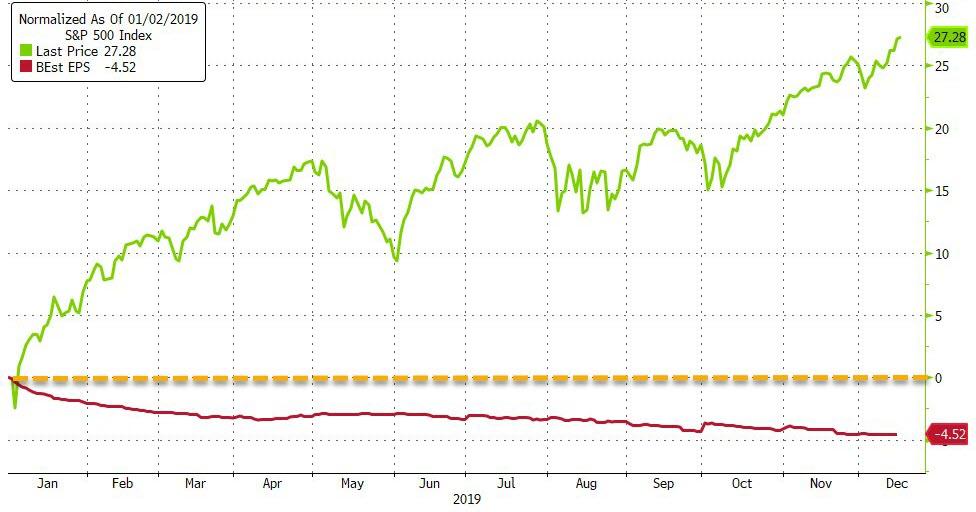
Be that as it may, it looks like the bulls will keep running despite earnings expectations being in retreat mode.
2. ETFs in the Spotlight
In case you missed the announcement and description of this section, you can read it here again.
It features 10 broadly diversified and sector ETFs from my HighVolume list as posted every Saturday. Furthermore, they are screened for the lowest MaxDD% number meaning they have been showing better resistance to temporary sell offs than all others over the past year.
The below table simply demonstrates the magnitude with which some of the ETFs are fluctuating regarding their positions above or below their respective individual trend lines (%+/-M/A). A break below, represented by a negative number, shows weakness, while a break above, represented by a positive percentage, shows strength.
For hundreds of ETF choices, be sure to reference Thursday’s StatSheet.
For this current domestic “Buy” cycle, here’s how some our candidates have fared:
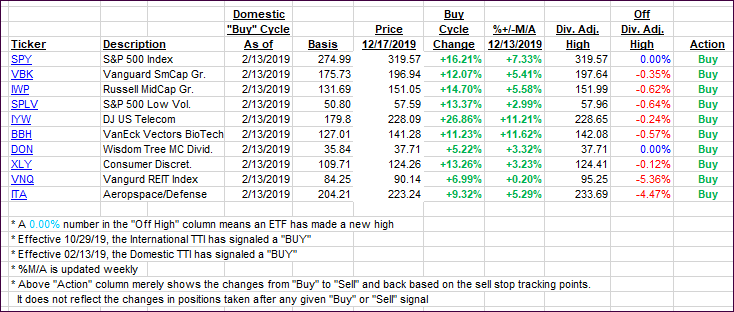
Click image to enlarge
Again, the %+/-M/A column above shows the position of the various ETFs in relation to their respective long-term trend lines, while the trailing sell stops are being tracked in the “Off High” column. The “Action” column will signal a “Sell” once the -8% point has been taken out in the “Off High” column. For more volatile sector ETFs, the trigger point is -10%.
3. Trend Tracking Indexes (TTIs)
Our Trend Tracking Indexes (TTIs) added a tiny bit, as upward momentum took a pause.
Here’s how we closed 12/17/2019:
Domestic TTI: +7.09% above its M/A (prior close +7.07%)—Buy signal effective 02/13/2019
International TTI: +6.26% above its M/A (prior close +6.19%)—Buy signal effective 10/29/2019
Disclosure: I am obliged to inform you that I, as well as my advisory clients, own some of the ETFs listed in the above table. Furthermore, they do not represent a specific investment recommendation for you, they merely show which ETFs from the universe I track are falling within the specified guidelines.
Contact Ulli