
- Moving the markets
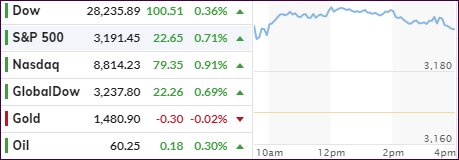
The markets continued their bullish ways into a new week with the supporting actor being the upbeat mood caused by last week’s preliminary trade deal between the US and China.
Despite of all the hysteria, many questions remain over the details of the much-hyped “phase one” accord. The Chinese were pleased, because it included a partial rollback of some tariffs and the ditching of further duties on imports.
If we can believe US trade representative Lighthizer, then the phase one deal is “totally done” and goes beyond agriculture and addresses intellectual property issues, financial services and their respective enforcement provisions.
Still, come contentious issues will need to be resolved, but that would be done in the “phase two” talks, which still must be scheduled. The “phase one” deal is supposed to be signed in January.
Bond yields continued their roller coaster ride by jumping 5.3 basis points to end the day at 1.88%, but equities were in a world of their own but, while coming off their early highs, still managed to score solid gains.
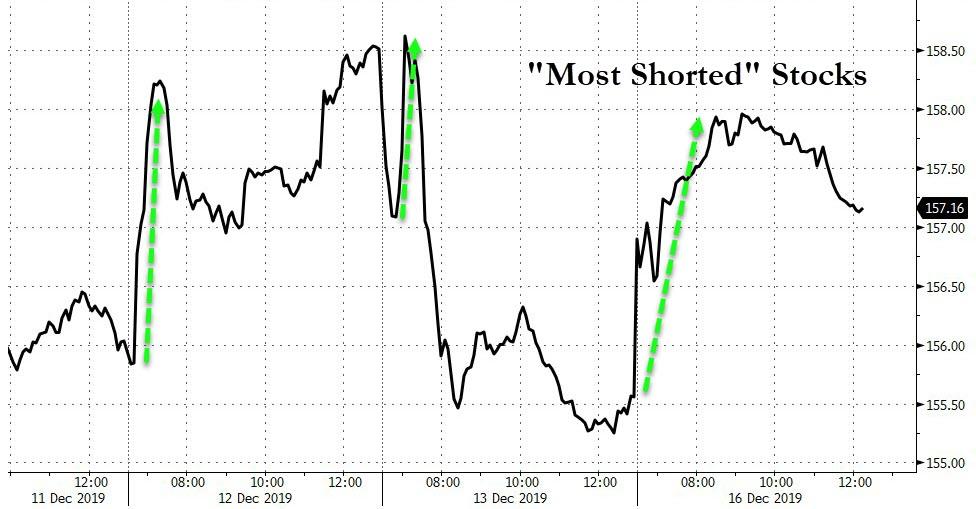
Supporting the bullish trend was another giant short squeeze, which crushed any remaining bearish sentiment that may have been waiting in the wings. Short squeezes have been a major support tool designed to keep the upbeat mood alive.
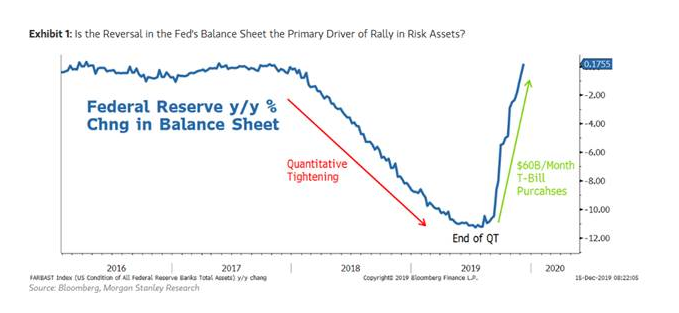
But in the end, the powerbroker to drive this market has been central bank liquidity, as this chart demonstrates. Without it, we would be celebrating the upcoming holiday with considerably lower index levels.
2. ETFs in the Spotlight
In case you missed the announcement and description of this section, you can read it here again.
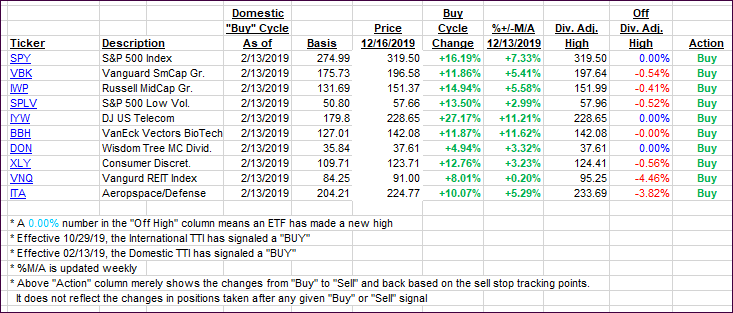
It features 10 broadly diversified and sector ETFs from my HighVolume list as posted every Saturday. Furthermore, they are screened for the lowest MaxDD% number meaning they have been showing better resistance to temporary sell offs than all others over the past year.
The below table simply demonstrates the magnitude with which some of the ETFs are fluctuating regarding their positions above or below their respective individual trend lines (%+/-M/A). A break below, represented by a negative number, shows weakness, while a break above, represented by a positive percentage, shows strength.
For hundreds of ETF choices, be sure to reference Thursday’s StatSheet.
For this current domestic “Buy” cycle, here’s how some our candidates have fared:
Click image to enlarge
Again, the %+/-M/A column above shows the position of the various ETFs in relation to their respective long-term trend lines, while the trailing sell stops are being tracked in the “Off High” column. The “Action” column will signal a “Sell” once the -8% point has been taken out in the “Off High” column. For more volatile sector ETFs, the trigger point is -10%.
3. Trend Tracking Indexes (TTIs)
Our Trend Tracking Indexes (TTIs) jumped again as the bulls were clearly in charge.
Here’s how we closed 12/16/2019:
Domestic TTI: +7.07% above its M/A (prior close +6.40%)—Buy signal effective 02/13/2019
International TTI: +6.19% above its M/A (prior close +5.41%)—Buy signal effective 10/29/2019
Disclosure: I am obliged to inform you that I, as well as my advisory clients, own some of the ETFs listed in the above table. Furthermore, they do not represent a specific investment recommendation for you, they merely show which ETFs from the universe I track are falling within the specified guidelines.
Contact Ulli