ETF/No Load Fund Tracker Newsletter For August 8, 2014

Ulli ETF Tracker Contact

ETF/No Load Fund Tracker StatSheet

————————————————————-

THE LINK TO OUR CURRENT ETF/MUTUAL FUND STATSHEET IS:

https://theetfbully.com/2014/08/weekly-statsheet-for-the-etfno-load-fund-tracker-newsletter-updated-through-08072014/

————————————————————

Market Commentary

Friday, August 8, 2014

BULLS BACK ON TRACK TO END FIRST WEEK OF AUGUST

Fri pic

[Chart courtesy of MarketWatch.com]

1. Moving the Markets

U.S. stocks ended higher today and closed out the first week of August on a strong note. This comes as a slight sigh of relief given how many international crises have rattled markets over the past two weeks. All major indexes headed higher, as the weekly chart above shows.

The Labor Department announced today that productivity rose more than expected in the second quarter. This increase is a rebound from the first-quarter report, which was the biggest productivity drop in more than three decades.

So, all signs on the domestic front tend to be indicating continued economic growth here at home. However, a batch of retail corporate earnings announcements coming up soon could be useful to gain a greater perspective on consumer spending in general.

Macy’s (M), Wal-Mart (WMT), Home Depot (HD), Nordstroms (JWN) and Estee Lauder (ELAA) should provide an interesting array of spending habits across a wide spectrum or retailers.

Our 10 ETFs in the Spotlight joined today’s rally and gained nicely on the day.

Read More

Weekly StatSheet For The ETF/No Load Fund Tracker Newsletter – Updated Through 08/07/2014

Ulli ETF StatSheet Contact

ETF/Mutual Fund Data updated through Thursday, August 7, 2014

Table of Content082312

If you are not familiar with some of the terminology used, please see the Glossary of Terms.


1. DOMESTIC EQUITY MUTUAL FUNDS/ETFs: BUY — since 10/25/2011

TTI

Our main directional indicator, the Domestic Trend Tracking Index (TTI), broke through its long-term trend line generating a Sell for this area effective 8/9/2011. Over the recent past, we’ve seen the TTI hovering slightly below and above this dividing line between bullish and bearish territory. The clear break to the upside occurred on 10/24/11 and, effective 10/25/11, a new Buy signal for domestic equities went into effect.

As of today, our TTI (green line in above chart) is positioned above its long term trend line (red) by +1.18%.

To avoid a potential whip-saw, a Sell signal to move out of all domestic equity positions will be generated once we have clearly pierced the red line to the downside. Be sure to tune in for the latest updates.

Read More

Those Pesky Worldwide Conflicts Just Won’t Go Away; International TTI Slips Below Its Trend Line

Ulli Market Commentary Contact

Thur pic

[Chart courtesy of MarketWatch.com]

1. Moving the Markets

Stocks tumbled as investors continued to worry about rising global tensions, despite adjacent reports of an improving U.S. economy. All major indexes dropped about 0.5%. Many headlines today featured the fact that the Dow is at its lowest level since May 20.

Eight of the 10 industry sectors in the S&P 500 fell. Healthcare and telecom stocks dropped the most, 1.2% and 1% respectively. Utilities stocks rose 1.1%, making them the biggest gainers, as investors bought safer assets.

The situation between Russia and Ukraine continues to weigh on market sentiment as Russia announced it is imposing a food import ban in retaliation for U.S. and European sanctions.

Here at home, we heard today that the number of Americans filing new claims for unemployment benefits fell last week, putting the average amount of claims over the past month to an eight-year low.

1 of our 10 ETFs in the Spotlight managed to squeeze out a gain, while the others slipped. Take a look at where the International TTI ended up…

Read More

Investors Remain Idle Amidst International Issues

Ulli Market Commentary Contact

Wed pic

[Chart courtesy of MarketWatch.com]

1. Moving the Markets

Investors remained largely on the sidelines today, with sell-offs occurring throughout the markets in general. The S&P 500 barely gained 0.01%, the Nasdaq rose 0.05% and the Dow squeezed out a 0.08% gain.

Time Warner (TMX) reported Wednesday that its second quarter net income rose 10% to $850 million as the robust performance of HBO and its cable TV networks helped offset its film studio’s falling revenue. However, share prices fell 12% today to $74.24, continuing its slide from yesterday’s news announcement that Rupert Murdoch’s 21st Century Fox had withdrawn its bid to acquire the company.

After the closing bell, Keurig Green Mountain (GMCR) reported solid earnings that beat expectations and supported a bright forecast for the rest of the year. However, the stock dropped 4.5% in after-hours trading.

In emerging markets, emerging market stocks fell to a five-week low, continued to be driven lower amidst international concerns over the Ukraine and Russia conflict. President Vladimir Putin increased the number of troops on his country’s western border, Polish Prime Minister Donald Tusk told reporters today. We also heard reports today that Russia is going to block all U.S. agricultural imports into Russia.

6 of our 10 ETFs in the Spotlight managed to eke out a gain, while 4 slipped; no new highs were made.

Read More

International Tensions Push Equities Lower; International TTI Close To A Sell

Ulli Market Commentary Contact

Tue pic

[Chart courtesy of MarketWatch.com]

1. Moving the Markets

Stocks closed lower with all 10 S&P 500 sectors losing. Energy was the biggest S&P 500 loser on the day, dropping 2.1%. Ukraine tensions were mostly to blame throughout headlines, as we heard today that Russian troops were massing near the Ukraine border.

Groupon Inc. (GRPN) fell 16% in after-hours trading. The daily deals site reported second-quarter revenue that fell short of analyst expectations. Also, its third-quarter projections for both earnings also disappointed.

21st Century Fox Inc. (FOX) withdrew its proposal to buy Time Warner (TWX) late Tuesday and pulled a 180 as it announced a share-buyback program instead. The move comes ahead of Time Warner earnings early Wednesday, when the media company is expected to report a profit of 84 cents per share on revenue of $6.88 billion. FOX gained 7.15% on the news, while TWX fell 9.85%.

Markets continue to be fragile in regards to international events, so let’s keep an eye on Ukraine, Gaza and the rest of the conflicts going on around the world.

Given today’s negative sentiment, it’s no surprise that our 10 ETFs in the Spotlight slipped with the indexes.

Read More

08-05-2014

Ulli Newsletter Archives Contact

The ETF/No Load Fund Tracker

Monthly Review—July 31, 2014

Some US Indexes Slide Into Negative Territory In July; Europe Follows Suit

US equities finished July lower as a combination of disappointing economic news, drab corporate earnings and geopolitical tensions took its toll on investor sentiment, triggering a broad selloff in equities.

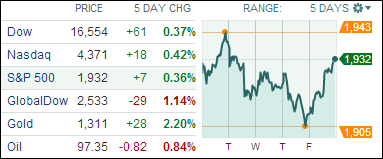
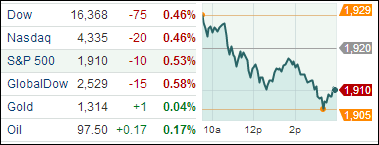
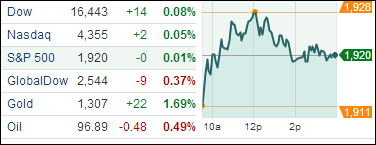
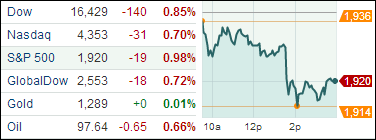
The Dow Jones Industrial Average ended the month 1.6 percent lower at 16,563.37 which turned its performance for 2014 negative. The blue-chip index shed 316.99 points, or 1.9 percent, on the last trading day of the month, its worst single-day performance since February 3.

The S&P 500 finished July at 1,930.67, down 1.5 percent for the month. All the 10 sectors of the benchmark index fell more than 1.5 percent on July 31 with energy and telecom stocks leading the losses.

The NASDAQ Composite Index closed at 4,369.77, tallying its monthly loss at 0.7 percent. The tech-heavy index slumped 93.13 points, or 2.1 percent, on the last business day of the month as investors became nervous about the Fed’s trigger points for raising rates ahead of Friday’s payrolls report.

The nonfarm payrolls report, released on the last day of the month, however, fell short of expectations. July US nonfarm payrolls increased by 209,000, which were smaller than the 230,000 gain most economists had forecast. Private payrolls performed worse, gaining only 198,000 jobs after adding 270,000 jobs in June. While the Labor Department revised job gains upwards by a total of 15,000 for May and June, the unemployment rate unexpectedly rose to 6.2 percent in July from 6.1 percent the previous month.

Labor force participation rate, a measure of working-age population in the labor force, ticked up to 62.9 percent from 62.8 percent in June. Average hourly earnings remained flat for the month after rising 0.2 percent in June while U6 unemployment rate, a gauge for under-employed and unemployed workers, inched up to 12.2 percent from 12.1 percent. Average workweek remained unchanged at 34.5 hours, validating Fed Chair Janet Yellen’s observation that there remains “significant underutilization of labor resources” that calls for loose monetary policy “for an extended period of time.”

The US economy continued to paint a mixed picture of recovery, with economic indicators hitting and missing economists’ forecasts in July. The economy made a strong comeback in the second quarter as consumer spending surged and business investments rebounded. Gross domestic product grew at a 4 percent annual pace after contracting by a downwardly-revised 2.1 percent in the first quarter. Consumer spending, the biggest component of the economy, jumped 2.5 percent as spending on big-ticket items such as cars and trucks accelerated. Spending on goods meant to last three years or more soared 14 percent, the biggest increase since 2009.

The Personal Consumption Expenses index, the Fed’s favorite gauge for measuring inflation, meanwhile grew at a 2.3 percent annual pace, the fastest since the second quarter of 2011. Core PCE, which excludes volatile items like food and energy, accelerated to a 2 percent annual clip from 1.2 percent in the first three months. While the Fed believes the sudden jump in inflation is temporary and expects price levels to moderate in the coming months, the central bank could be forced to raise interest rates sooner than it would like if proven wrong.

Pre-owned home sales fell unexpectedly in June, a separate report by the National Association for Realtors revealed. NAR’s Pending Home Sales Index, which is calculated after assessing the number of contracts signed, fell 1.1 percent to 102.7, missing forecasts for a 0.5 percent gain.

Shipment of non-defense capital goods excluding aircrafts, considered as a good proxy for business investments, fell 1 percent in June, while the reading for May was revised downward minus 0.1 percent, indicating business spending could soften in the next quarters.

Across the Atlantic, European stocks tracked Wall Street as weak economic data and falling inflation sapped demand for riskier assets. Weak price levels continued to haunt Europe with July inflation slipping to 0.4 percent from 0.5 percent in the previous two months. The July reading, the lowest since October 2009, is bad news for the European Central Bank as the bank announced a raft of liquidity measures in June to boost the region’s economy and bring inflation up to the bank’s target of 2 percent. Some economists, however, said the drop was temporary and argued a bigger-than-expected dip in non-core prices caused the decline.

The trend reversal in the indexes affected our holdings to varying degrees. First, the close up performance of our main holdings over the month of July:

Monthly Chart

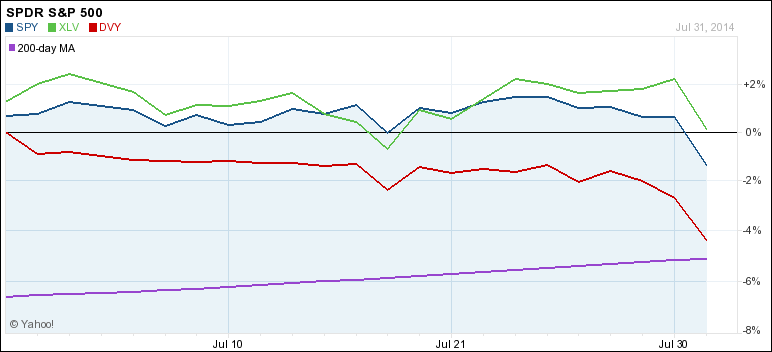
DVY was the weakling while SPY held up fairly well. Only healthcare (XLV) managed to stay on the plus side of the ledger for this period supporting the leading role it has played all year.

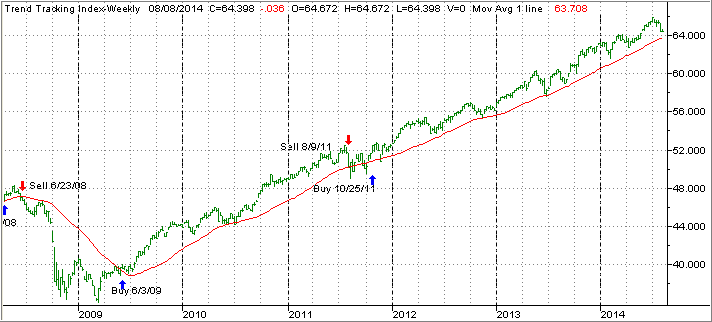
On to the big picture. Our Domestic Trend Tracking Index (TTI) came off its high as the following chart shows:

TTI

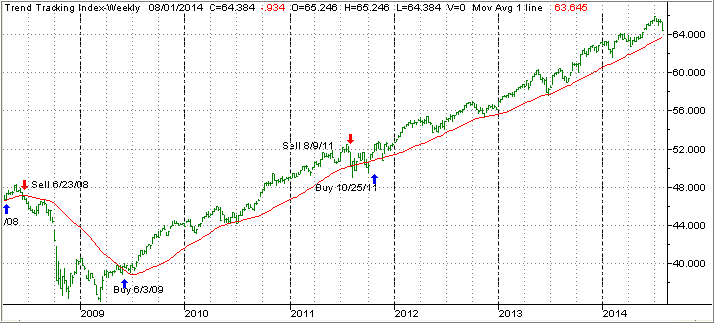
Notice how the last green bar on the upper right turned south and headed towards its long-term trend line (red). This happened during the last week of July, however, the TTI remains above is trend line by +1.23% and therefore in bullish territory.

It’s too early to tell if that drop was only an aberration or an indication of things to come. For sure, we are long overdue for a correction. The good news is that it won’t take much of a drop for our above indicator to signal a move out of equities, which means that we will be able to most likely escape with gains on most of our positions rather than losses.

Our trailing sell stops provide another measure of downside protection, which will be sorely needed if and when this cycle comes to its inevitable end.