
1. Moving the Markets
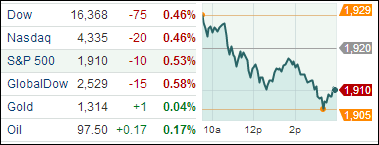
Stocks tumbled as investors continued to worry about rising global tensions, despite adjacent reports of an improving U.S. economy. All major indexes dropped about 0.5%. Many headlines today featured the fact that the Dow is at its lowest level since May 20.
Eight of the 10 industry sectors in the S&P 500 fell. Healthcare and telecom stocks dropped the most, 1.2% and 1% respectively. Utilities stocks rose 1.1%, making them the biggest gainers, as investors bought safer assets.
The situation between Russia and Ukraine continues to weigh on market sentiment as Russia announced it is imposing a food import ban in retaliation for U.S. and European sanctions.
Here at home, we heard today that the number of Americans filing new claims for unemployment benefits fell last week, putting the average amount of claims over the past month to an eight-year low.
1 of our 10 ETFs in the Spotlight managed to squeeze out a gain, while the others slipped. Take a look at where the International TTI ended up…
2. ETFs in the Spotlight
In case you missed the announcement and description of this section, you can read it here again.
It features 10 broadly diversified ETFs from my HighVolume list as posted every Monday. Furthermore, they are screened for the lowest MaxDD% number meaning they have been showing better resistance to temporary sell offs than all others over the past year.
Here are the 10 candidates:
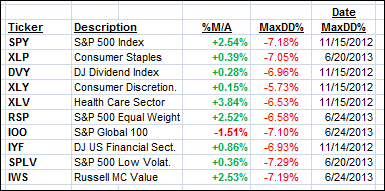
9 of them are in “buy” mode, meaning their prices are above their respective long term trend lines by the percentage indicated (%M/A).
Year to date, here’s how the above candidates have fared so far:
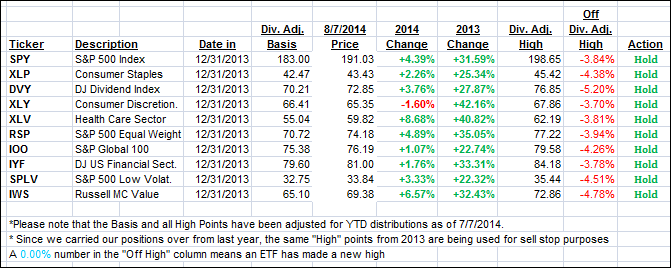
To be clear, the first table above shows the position of the various ETFs in relation to their respective long term trend lines (%M/A), while the second one tracks their trailing sell stops in the “Off High” column. The “Action” column will signal a “Sell” once the -7.5% point is taken out in the “Off High” column.
3. Domestic Trend Tracking Indexes (TTIs)
Our Trend Tracking Indexes (TTIs) slipped with the International one crossing its long-term trend line to the downside—but only barely. This to me is not a clear break and, in order to avoid a whipsaw signal, I like to see a more distinct piercing of the line over a few days before declaring an all-out Sell signal for broadly diversified international funds/ETFs.
Here are the closing numbers:
Domestic TTI: +1.18% (last close +1.27%)
International TTI: -0.09% (last close +0.51%)
Disclosure: I am obliged to inform you that I, as well as advisory clients of mine, own some of these listed ETFs. Furthermore, they do not represent a specific investment recommendation for you, they merely show which ETFs from the universe I track are falling within the guidelines specified.
Contact Ulli