12-12-2014

Ulli Newsletter Archives Contact

ETF/No Load Fund Tracker Newsletter For December 12, 2014

ETF/No Load Fund Tracker StatSheet

————————————————————-

THE LINK TO OUR CURRENT ETF/MUTUAL FUND STATSHEET IS:

https://theetfbully.com/2014/12/weekly-statsheet-for-the-etfno-load-fund-tracker-newsletter-updated-through-12112014/

————————————————————

Market Commentary

Friday, December 12, 2014

MARKETS END LOWER ON THE SECOND WEEK OF DECEMBER
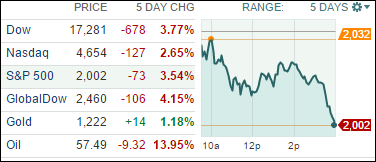
Fri pic

[Chart courtesy of MarketWatch.com]

1. Moving the Markets

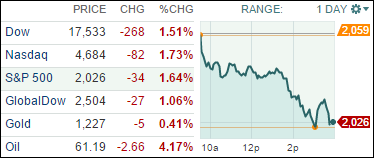
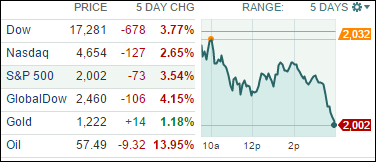
After seven consecutive weeks higher, stocks fell as they took their lead from poor global economic data and declining oil prices. On the week, the S&P 500 fell 3.5%, the Dow dropped 3.7%, and the Nasdaq slid 2.6%.

It seems that Wall Street is very nervous about the price of oil and the situation in the EU. With oil at a five-year low and overseas markets also slowing, persistent weak inflation has allowed Federal Reserve policymakers room to keep interest rates near zero after ending monthly asset purchases in October as the economy allegedly strengthened.

In labor news, the Labor Department says the producer price index fell 0.2% in November, after rising by the same amount in October. In the past 12 months, producer prices have risen just 1.4%, the smallest yearly increase since February.

The bet and hope is now on the American consumer to boost retail sales throughout the month of December.

With today’s sell off, our International TTI has now officially entered bear market territory. Please see section 3 for more details.

2. ETFs in the Spotlight

In case you missed the announcement and description of this section, you can read it here again.

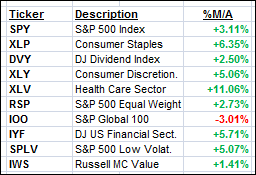
It features 10 broadly diversified ETFs from my HighVolume list as posted every Monday. Furthermore, they are screened for the lowest MaxDD% number meaning they have been showing better resistance to temporary sell offs than all others over the past year.

Here are the 10 candidates:
MaxDD

The above table simply demonstrates the magnitude with which some of the ETFs are fluctuating in regards to their positions above or below their respective individual trend lines (%M/A). A break below, represented by a negative number, shows weakness, while a break above, represented by a positive percentage, shows strength.

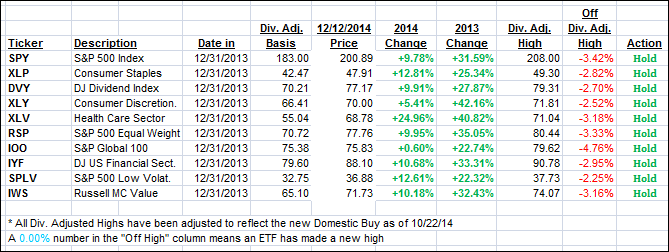
Year to date, here’s how the above candidates have fared so far:
YTD

Again, the first table above shows the position of the various ETFs in relation to their respective long term trend lines (%M/A), while the second one tracks their trailing sell stops in the “Off High” column. The “Action” column will signal a “Sell” once the -7.5% point has been taken out in the “Off High” column.

3. Trend Tracking Indexes (TTIs)

Our Trend Tracking Indexes (TTIs) headed south with the International one now clearly settling below its trend line and in bear market territory. Barring any huge rebound on Monday, this short Buy cycle is over as bearish momentum makes this arena too risky to be exposed in.

It remains to be seen if the International TTI is again the canary in the coalmine alerting us early of things to come.

Here’s how we ended this volatile week:

Domestic TTI: +1.82% (last Friday +3.46%)—Buy signal since 10/22/2014

International TTI: -1.60% (last Friday +1.62%)—New Sell signal effective 12/15/14

Have a nice weekend.

Ulli…

Disclosure: I am obliged to inform you that I, as well as advisory clients of mine, own some of these listed ETFs. Furthermore, they do not represent a specific investment recommendation for you, they merely show which ETFs from the universe I track are falling within the guidelines specified.

————————————————————-

READER Q & A FOR THE WEEK

All Reader Q & A’s are listed at our web site!
Check it out at:

http://www.successful-investment.com/q&a.php

Reader Dick:

Q: Ulli: In following the 7.5% rule, I cashed in my mutual fund shares at about 8% when the markets turned bearish in the middle of October. Being reluctant to get back in over the following week, I missed a complete upside return to where I was when I got out.

The problem with mutual funds is that they don’t like you redeeming your shares and then returning to the market every other day or so. My apprehension kept me on the sidelines and I have paid the price.

Your input regarding this problem in dealing with mutual funds.

A: Dick: Yes, that’s been an old problem that we avoid by using ETFs. I manage a few 401k accounts for clients, where mutual funds are mandatory, but I predominantly use the equivalent index fund for the S&P 500. Since a whipsaw does not happen very often, this has not been an issue for us.

———————————————————-

WOULD YOU LIKE TO HAVE YOUR INVESTMENTS PROFESSIONALLY MANAGED?

Do you have the time to follow our investment plans yourself? If you are a busy professional who would like to have his portfolio managed using our methodology, please contact me directly or get more details at:

https://theetfbully.com/personal-investment-management/

———————————————————

Back issues of the ETF/No Load Fund Tracker are available on the web at:
https://theetfbully.com/newsletter-archives/

ETF/No Load Fund Tracker Newsletter For December 12, 2014

Ulli Market Commentary Contact

ETF/No Load Fund Tracker StatSheet

————————————————————-

THE LINK TO OUR CURRENT ETF/MUTUAL FUND STATSHEET IS:

https://theetfbully.com/2014/12/weekly-statsheet-for-the-etfno-load-fund-tracker-newsletter-updated-through-12112014/

————————————————————

Market Commentary

Friday, December 12, 2014

MARKETS END LOWER ON THE SECOND WEEK OF DECEMBER

Fri pic

[Chart courtesy of MarketWatch.com]

1. Moving the Markets

After seven consecutive weeks higher, stocks fell as they took their lead from poor global economic data and declining oil prices. On the week, the S&P 500 fell 3.5%, the Dow dropped 3.7%, and the Nasdaq slid 2.6%.

It seems that Wall Street is very nervous about the price of oil and the situation in the EU. With oil at a five-year low and overseas markets also slowing, persistent weak inflation has allowed Federal Reserve policymakers room to keep interest rates near zero after ending monthly asset purchases in October as the economy allegedly strengthened.

In labor news, the Labor Department says the producer price index fell 0.2% in November, after rising by the same amount in October. In the past 12 months, producer prices have risen just 1.4%, the smallest yearly increase since February.

The bet and hope is now on the American consumer to boost retail sales throughout the month of December.

With today’s sell off, our International TTI has now officially entered bear market territory. Please see section 3 for more details.

Read More

Weekly StatSheet For The ETF/No Load Fund Tracker Newsletter – Updated Through 12/11/2014

Ulli ETF StatSheet Contact

ETF/Mutual Fund Data updated through Thursday, December 11, 2014

TOC112614

If you are not familiar with some of the terminology used, please see the Glossary of Terms.


1. DOMESTIC EQUITY MUTUAL FUNDS/ETFs: BUY — since 10/22/2014

TTI

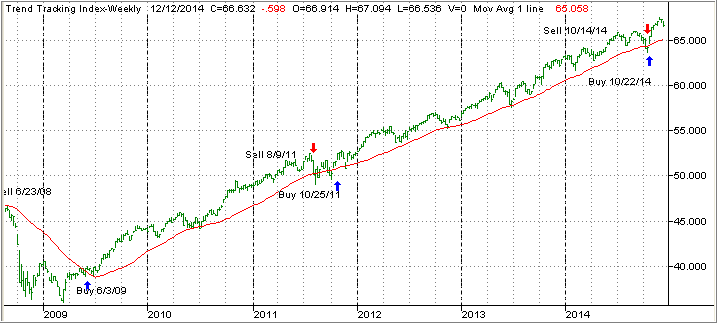
Our main directional indicator, the Domestic Trend Tracking Index (TTI), broke through its long-term trend line generating a “Sell” for this arena effective 10/14/2014, which was followed by a violent break back above the line on 10/22/14 generating a new “Buy.” It was a classic whipsaw signal, and you can read more on my blog as to the events as they were unfolding.

As of today, our TTI (green line in above chart) is positioned above its long term trend line (red) by +2.54% keeping us in the market with newly established positions.

Read More

A Pump And Dump Kind Of Day

Ulli Market Commentary Contact

Thur pic

[Chart courtesy of MarketWatch.com]

1. Moving the Markets

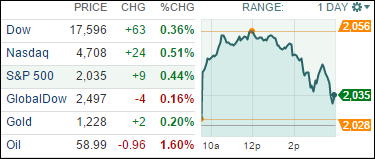
As the chart above clearly shows, the major indexes went off to races right at the opening as upbeat, although severely seasonally adjusted, retail sales figures lead the way to a sharp rebound rally overcoming yesterday’s bearish tendencies.

Hope for a strengthening economy based on optimism that the consumer had not died yet, the S&P 500 hit an intra-day high of 2,056 before reality set in that all may not be well and south we went. However, the day was saved by the indexes managing to close above the unchanged line.

The culprit unraveling this nice morning rally was Crude Oil, which fell below $60 for the first time in five years. Sure, while we all enjoy lower prices at the pump, the energy sector as a whole appears in trouble as any asset would that drops 40% in just a few months.

Not helping matters and adding to market uncertainty was concern that the $1.1 trillion spending bill may face serious objections and may not pass as was widely expected.

All of our 10 ETFs in the Spotlight gained but no new Highs were made.

Read More

The Worst Day In Stocks Since Early October; And A Burger To Go With It

Ulli Market Commentary Contact

Wed pic

[Chart courtesy of MarketWatch.com]

1. Moving the Markets

Stocks took a beating today. The S&P 500, Dow and Nasdaq all dropped more than 1.5%, and marked the third straight day of losses on Wall Street.

The dominant financial story remains oil, as the price of crude plunged again after the Organization of Petroleum Exporting Countries (OPEC) slashed its estimate of how much crude oil it will need to produce in 2015. Crude oil prices hit five-year lows today thanks to burgeoning supply from North American producers. The OPEC projection for 2015 production is 28.9 million barrels a day, which is 300,000 barrels more than previously forecast.

In addition to the dropping price of oil, the market has taken a hit on concerns over sluggish global economies, particularly in Asia and Europe. A sell-off of stocks in China continued today as well, despite a rebound today in Chinese equities that lifted the Shanghai composite index nearly 3%. While individual stocks may look good, the country is still experiencing slowing growth.

In positive glutinous news, Carl’s Jr., will become the first major fast-food chain to sell a “natural” burger when it rolls out the “All-Natural Burger” Dec. 17. The strategic move by the regional chain comes at a time when fast-food chains are fighting to improve the perceived quality of their food. But what exactly is “natural” about the burger? I guess we shall soon see.

All of our 10 ETFs in the Spotlight joined the trend reversal and headed south today as yesterday’s rebound from an early morning drop know looks like a dead cat bounce.

Read More

Dow And S&P Close In The Red For Second Straight Day

Ulli Market Commentary Contact

Tue pic

[Chart courtesy of MarketWatch.com]

1. Moving the Markets

It was a bit of a quiet day in regards to market moving news. Stocks were steady early in the day, but fizzled later and, despite a tremendous rebound, the S&P 500 and Dow both closed in the red. The Nasdaq was the only major index that inched up, driven higher by strong tech stocks.

It was not a good day for Chinese equities. Hong Kong’s Hang Seng index tumbled 2.3% to 23,485.83 and mainland China’s Shanghai composite index plunged 5.4%. Also, half of the 15 stocks on the NYSE Arca China index, which trades on a major U.S. exchange, were down today. One of the big drivers impacting the Chinese markets negatively has been continued decline in energy stocks, as well as the fact that China tightened lending rules for short term loans.

Looking forward to the rest of December and onwards to 2015, it is fair to stay optimistic. An improving job market coupled with low oil prices means the outlook for 2015 is still looking good. But slower economic growth in the rest of the world and the uncertainty about interest rates could increase market volatility. As always, market pullbacks can occur at any time and for any reason, which means you better be prepared via my recommended exit strategy.

Again, 3 of our 10 ETFs in the Spotlight managed to climb higher today; however, none of them made new highs as the YTD table below shows.

Read More