
1. Moving the Markets
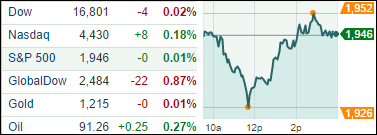
Finally, investors were able to get a slight sigh of relief today, not because markets showed big gains, but because there were no major losses. The S&P 500 ended the day flat, the Dow dropped 0.02% and the Nasdaq moved higher 0.18%.
Small caps and energy stocks were the heroes of the day. Energy stocks, which had been down for much of the session, gained 0.4%. U.S. crude rebounded after falling below $90 for the first time since April last year, and Brent crude also finished well off the day’s lows.
In tech, shares of extreme camera maker GoPro (GPRO) dropped 7% today after the founder indirectly sold 5.8 million shares — despite saying he would wait six months. The catch is that he is donating the shares to a charity, but those shares will be free to trade on Oct. 3, effectively avoiding the lock-up period (Dec. 22) that other existing shares are subjected to.
And back to international conflicts. Asian stocks fell sharply Thursday amid worries about the strength of U.S. and European economies and the first American case of Ebola. Luckily, markets were closed in Hong Kong and China for a public holiday, otherwise, we may have seen a continued decline given the continued protests taking place in the former British province, even though the Chief Executive of Hong Kong has agreed to hold talks between his government and pro-democracy protesters.
6 of our 10 ETFs in the Spotlight managed to close up during this very volatile day.
2. ETFs in the Spotlight
In case you missed the announcement and description of this section, you can read it here again.
It features 10 broadly diversified ETFs from my HighVolume list as posted every Monday. Furthermore, they are screened for the lowest MaxDD% number meaning they have been showing better resistance to temporary sell offs than all others over the past year.
Here are the 10 candidates:
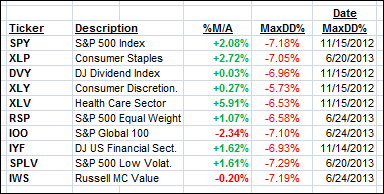
All of them, except IOO and IWS, are currently in “buy” mode, meaning their prices are above their respective long term trend lines by the percentage indicated (%M/A).
Year to date, here’s how the above candidates have fared so far:
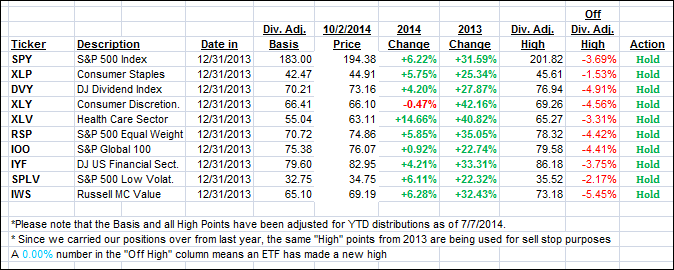
To be clear, the first table above shows the position of the various ETFs in relation to their respective long term trend lines (%M/A), while the second one tracks their trailing sell stops in the “Off High” column. The “Action” column will signal a “Sell” once the -7.5% point is taken out in the “Off High” column.
3. Domestic Trend Tracking Indexes (TTIs)
Our Trend Tracking Indexes (TTIs) were mixed as the Domestic one improved slightly while the International one sank deeper below its long-term trend line validating the current bearish tendencies in that arena.
Here’s how we ended up:
Domestic TTI: +0.71% (last close +0.64%)
International TTI: -2.33% (last close -1.76%)
A new international Buy cycle will be generated once the above TTI penetrates its long-term trend line to the upside by a clear margin. Stay tuned for further updates.
Disclosure: I am obliged to inform you that I, as well as advisory clients of mine, own some of these listed ETFs. Furthermore, they do not represent a specific investment recommendation for you, they merely show which ETFs from the universe I track are falling within the guidelines specified.
Contact Ulli