
1. Moving the Markets
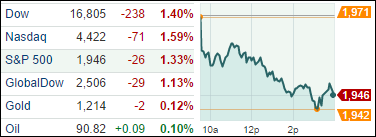
The markets turned into a black diamond ski slope with only one way to go: Lower. The major indexes all surrendered some of their yearly gains with XLY, last year’s big winner, actually dipping into the negative YTD.
Today’s downside acceleration confirmed yesterday’s international Sell signal, with the International Trend Tracking Index (TTI) closing the day at -1.76%. The Domestic TTI still remains on the positive side as you can see in section 3 below.
Weak economic data out of Europe along with cooling U.S. manufacturing were some of the culprits pulling the indexes lower along with the usual menu of geopolitical tensions. The S&P 500 slipped below its widely followed 50-day moving average by a sharp -1.55%, and it remains to be seen if this downtrend will accelerate and pull us out of equities altogether. We are not that far away!
So, it was no surprise that all of our 10 ETFs in the Spotlight slipped as selling continued throughout the day. Please see the tables below for more details.
2. ETFs in the Spotlight
In case you missed the announcement and description of this section, you can read it here again.
It features 10 broadly diversified ETFs from my HighVolume list as posted every Monday. Furthermore, they are screened for the lowest MaxDD% number meaning they have been showing better resistance to temporary sell offs than all others over the past year.
Here are the 10 candidates:
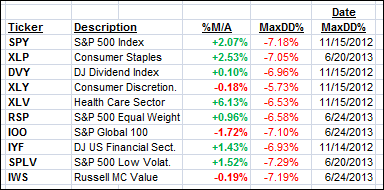
All of them, except IOO, XLY and IWS, are currently in “buy” mode, meaning their prices are above their respective long term trend lines by the percentage indicated (%M/A).
Year to date, here’s how the above candidates have fared so far:
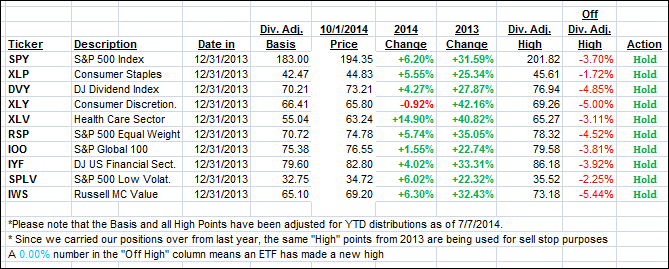
To be clear, the first table above shows the position of the various ETFs in relation to their respective long term trend lines (%M/A), while the second one tracks their trailing sell stops in the “Off High” column. The “Action” column will signal a “Sell” once the -7.5% point is taken out in the “Off High” column.
3. Domestic Trend Tracking Indexes (TTIs)
Our Trend Tracking Indexes (TTIs) headed further south with the Domestic one remaining on the bullish side of the trend line—for the time being. Internationally, the Sell signal was confirmed this morning as a rebound did not materize. For tracking purposes, the date of this move to bearish territory will be 10/1/14.
Here’s how we ended up:
Domestic TTI: +0.64% (last close +1.18%)
International TTI: -1.76% (last close -0.73%)
A new international Buy cycle will be generated once the above TTI penetrates its long-term trend line to the upside by a clear margin. Stay tuned for further updates.
Disclosure: I am obliged to inform you that I, as well as advisory clients of mine, own some of these listed ETFs. Furthermore, they do not represent a specific investment recommendation for you, they merely show which ETFs from the universe I track are falling within the guidelines specified.
Contact Ulli