ETF/No Load Fund Tracker Newsletter For September 26, 2014
ETF/No Load Fund Tracker StatSheet
————————————————————-
THE LINK TO OUR CURRENT ETF/MUTUAL FUND STATSHEET IS:
https://theetfbully.com/2014/09/weekly-statsheet-for-the-etfno-load-fund-tracker-newsletter-updated-through-09252014/
————————————————————
Market Commentary
Friday, September 26, 2014
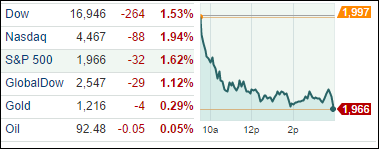
SURVIVING A ROLLER COASTER WEEK
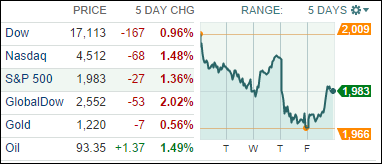
[Chart courtesy of MarketWatch.com]
1. Moving the Markets
As the 5-day chart above clearly demonstrates, it was a roller coaster week, the outcome of which could have been a lot worse, had it not been for Wednesday’s and Friday’s rebound rallies. While they helped in keeping the losses manageable, the major indexes surrendered between 0.96% and 1.48%.
Helping today’s jump off the lows was a stronger than expected GDP number, which provided the firepower necessary to overcome this short-term down trend. The US economy grew at a 4.6% annual pace in the second quarter; while it matched its best performance since the recession it at the same time raises questions as to its sustainability.
Additionally, the consumer sentiment index remained very steady at its highest level since July 2013 and above the more recent August 2014 reading.
Still, it was a volatile week and it remains a wide open question if this oversold bounce actually has the legs to resume and extend the bullish trend.
All of our 10 ETFs in the Spotlight participated in today’s bounce, but no new highs were made.
2. ETFs in the Spotlight
In case you missed the announcement and description of this section, you can read it here again.
It features 10 broadly diversified ETFs from my HighVolume list as posted every Monday. Furthermore, they are screened for the lowest MaxDD% number meaning they have been showing better resistance to temporary sell offs than all others over the past year.
Here are the 10 candidates:
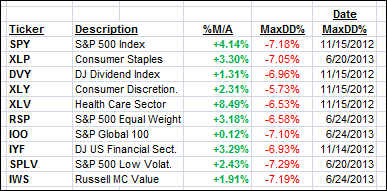
All of them are currently in “buy” mode, meaning their prices are above their respective long term trend lines by the percentage indicated (%M/A).
Year to date, here’s how the above candidates have fared so far:
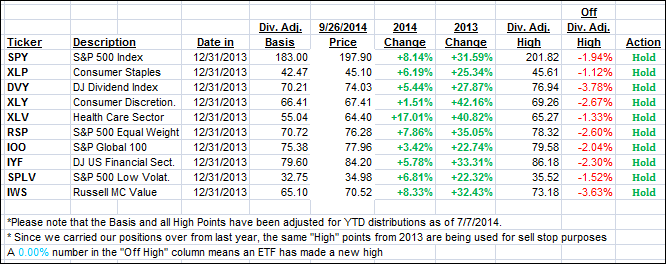
To be clear, the first table above shows the position of the various ETFs in relation to their respective long term trend lines (%M/A), while the second one tracks their trailing sell stops in the “Off High” column. The “Action” column will signal a “Sell” once the -7.5% point is taken out in the “Off High” column.
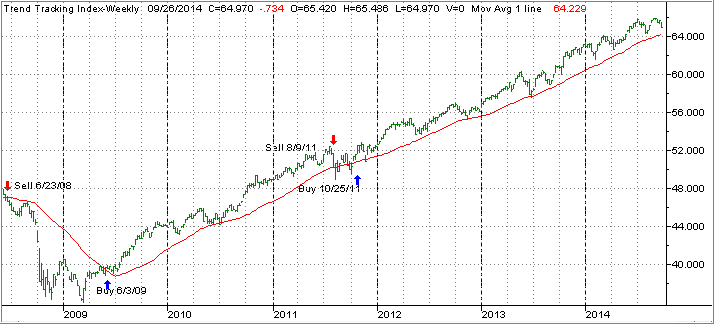
3. Domestic Trend Tracking Indexes (TTIs)
Our Trend Tracking Indexes (TTIs) joined today’s rebound with the International one almost climbing back to the bullish side of the trend line. As I posted yesterday, I want to see a clear and sustained break below the line before issuing a Sell signal for that arena:
Domestic TTI: +1.55% (last Friday +2.37%)
International TTI: -0.12% (last Friday +1.66%)
Have a nice weekend.
Ulli…
Disclosure: I am obliged to inform you that I, as well as advisory clients of mine, own some of these listed ETFs. Furthermore, they do not represent a specific investment recommendation for you, they merely show which ETFs from the universe I track are falling within the guidelines specified.
————————————————————-
READER Q & A FOR THE WEEK
All Reader Q & A’s are listed at our web site!
Check it out at:
http://www.successful-investment.com/q&a.php
Reader Steve:
Q: Ulli: Why do you use the 39 week moving average and not some other type of moving average, like the 200 day or 50 week moving average?
A: Steve: When I developed the Trend Tracking Indexes (TTIs) in the 80s, I found the 39-week SMA to be the most effective average that minimized whip-saw signals and produced reliable Buy/Sell signals.
———————————————————-
WOULD YOU LIKE TO HAVE YOUR INVESTMENTS PROFESSIONALLY MANAGED?
Do you have the time to follow our investment plans yourself? If you are a busy professional who would like to have his portfolio managed using our methodology, please contact me directly or get more details at:
https://theetfbully.com/personal-investment-management/
———————————————————
Back issues of the ETF/No Load Fund Tracker are available on the web at:
https://theetfbully.com/newsletter-archives/

 The latest upward revision of second-quarter US GDP to 4.6 percent indicates an annualized growth rate of 3 percent or more in the third quarter, said David Kelly, chief global strategist at JP Morgan Funds. After years of disappointing growth, finally the US recovery seems to gather a lot of steam, he observed.