
1. Moving the Markets
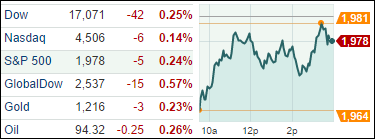
Pro-democracy protests in Hong Kong shook the markets today. As if investors didn’t have enough global conflicts on their plate already. The Hong Kong protest is the latest geopolitical stir to snag Wall Street’s attention, and cause investors to pare back their risk-taking. Last week, U.S. markets went on a volatile ride primarily driven by global uncertainty in Iraq, Syria and the Ukraine. For the day, the three major indexes dropped.
Today was not a good day for Ford (F) either. Share prices fell dramatically (7.47%) after the company warned that losses in Russia will delay a return to profitability in Europe and that this year’s big losses in South America will continue. Adding fuel to the fire was their additional announcement that last Friday’s recall of 850,000 vehicles for a short-circuiting problem with an air bag control module will cost about $500 million to fix. Ouch!
The news wasn’t all bad today though. One of the largest gainers was Iron Mountain Inc (IRM), whose shares gained 5.71%. The data management company announced today that it plans to acquire Recall Holdings Ltd (RCLHF) for more than $2 billion. Recall is a provider of information management solutions and trades on the ASX, but conducts most of its business in the U.S.
2 of our 10 ETFs in the Spotlight managed to close up but no new highs were made.
2. ETFs in the Spotlight
In case you missed the announcement and description of this section, you can read it here again.
It features 10 broadly diversified ETFs from my HighVolume list as posted every Monday. Furthermore, they are screened for the lowest MaxDD% number meaning they have been showing better resistance to temporary sell offs than all others over the past year.
Here are the 10 candidates:
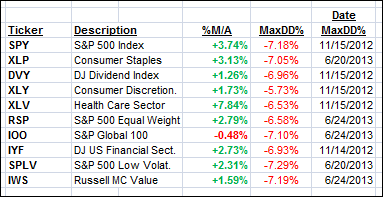
All of them, except IOO, are currently in “buy” mode, meaning their prices are above their respective long term trend lines by the percentage indicated (%M/A).
Year to date, here’s how the above candidates have fared so far:
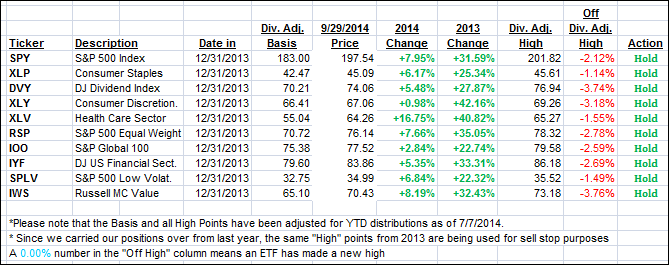
To be clear, the first table above shows the position of the various ETFs in relation to their respective long term trend lines (%M/A), while the second one tracks their trailing sell stops in the “Off High” column. The “Action” column will signal a “Sell” once the -7.5% point is taken out in the “Off High” column.
3. Domestic Trend Tracking Indexes (TTIs)
Our Trend Tracking Indexes (TTIs) were mixed with the domestic one ending the day unchanged while its international cousion slipped a bit but not enough to call that bullish cycle over:
Domestic TTI: +1.55% (last close +1.55%)
International TTI: -0.48% (last close -0.12%)
Disclosure: I am obliged to inform you that I, as well as advisory clients of mine, own some of these listed ETFs. Furthermore, they do not represent a specific investment recommendation for you, they merely show which ETFs from the universe I track are falling within the guidelines specified.
Contact Ulli