ETF/No Load Fund Tracker Newsletter For January 8, 2016

Ulli ETF Tracker Contact

ETF/No Load Fund Tracker StatSheet

————————————————————-

THE LINK TO OUR CURRENT ETF/MUTUAL FUND STATSHEET IS:

https://theetfbully.com/2016/01/weekly-statsheet-for-the-etfno-load-fund-tracker-newsletter-updated-through-01072016/

————————————————————

Market Commentary

MARKETS MELT DOWN IN WORST EVER FIRST WEEK TO START THE YEAR
Fri pic 

[Chart courtesy of MarketWatch.com]

1. Moving the Markets

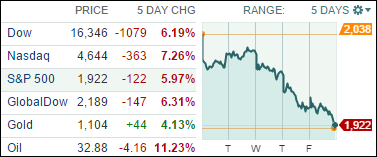
One look at the above chart shows the extent to which the bulls got slaughtered this week as the U.S. stock market saw an early rally fizzle out and finished sharply lower after a big late-day selloff. The selloff at the end of trading essentially dashed hopes for a market rebound today, despite a strong U.S. jobs report and a 2% rebound in China’s markets. Both the Dow and S&P 500 have posted their worst five-day start to a year in history.

Stocks got a big sentiment boost before the opening bell when the government reported that the U.S. economy created 292,000 jobs in December, which was well above the 200,000 estimate. But the early gains didn’t hold up as a look under the hood confirmed that most jobs were of the part-time variety. Job gains were also revised up 41,000 in November and 9,000 in October. The unemployment rate stayed steady at 5% in December for a third straight month.

All of our 10 ETFs in the Spotlight took a beating again, as they did all week, with the Financials (IYF) taking the dubious lead with -1.54% while the Dividend ETF (DVY) held up the best with a loss of -0.69%.

We remain on the sidelines as the bear market deepens. For the exact numbers, please see section 3 below.
Read More

Weekly StatSheet For The ETF/No Load Fund Tracker Newsletter – Updated Through 01/07/2016

Ulli ETF StatSheet Contact

ETF/Mutual Fund Data updated through Thursday, January 07, 2016

TOC010716

If you are not familiar with some of the terminology used, please see the Glossary of Terms.


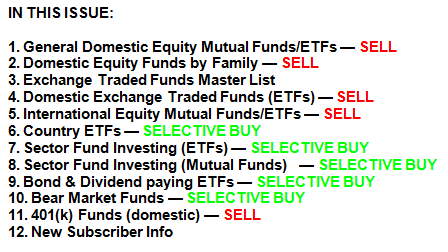
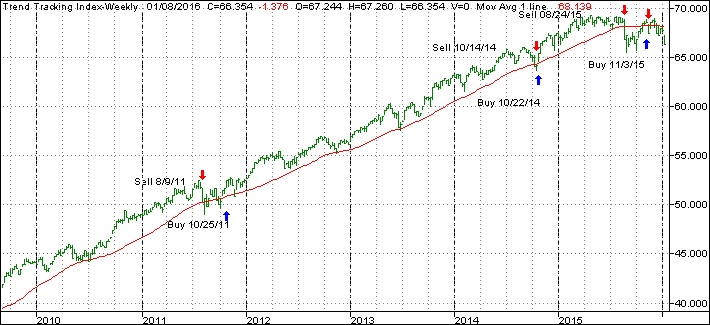
1. DOMESTIC EQUITY MUTUAL FUNDS/ETFs: SELL — since 11/13/2015

TTI

Our main directional indicator, the Domestic Trend Tracking Index (TTI-green line in above chart) has recently crawled above its long term trend line (red) and finally generated a new “Buy” signal effective 11/3/15. The market subsequently dropped, and we exited again on 11/13/15. As of today, the TTI remains below its trend line by -2.69%, which means we are in cash on the sidelines.

Read More

China Troubles Continue To Spank Wall Street

Ulli Market Commentary, Uncategorized Contact

Thur pic

[Chart courtesy of MarketWatch.com]

1. Moving the Markets

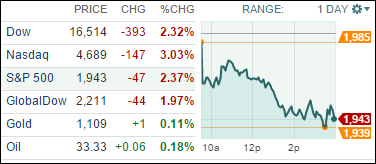
Wall Street’s worst opening to a new year since 2008 got even uglier today when repeated waves of selling sent the Dow tumbling almost 400 points and the Nasdaq into correction territory amid a global stock rout that started when China halted trading in its market again following a 7% plunge.

The real drama was in the tech-heavy Nasdaq Composite, which plunged 3% to 4689.43, leaving it more than 10% below its July record close and officially in correction territory.

China was again the epicenter of the sell-off. Sparking angst was a freefall in Chinese stocks at the start of trading there, which triggered a shutdown of the Chinese stock market about 30 minutes into the trading session. That marks the shortest trading day in the market’s short history. It was the second trading halt this week.

While Wall Street is in turmoil, it seems to me that for the first time in many years, equities appear to slowly move in sync with the actual performance of the economy and not be controlled and manipulated by the great enabler of bull markets, namely the Fed. If you look at most of the data being published ranging from factory orders, imports, exports, industrial production along with the services sector, not just in the U.S. but China as well, you will notice that all have been in a prolonged downturn. So, will tomorrow’s payroll numbers come to the rescue?

All of our 10 ETFs in the Spotlight followed the “down” theme of 2016 and closed lower. The worst performer of the day was the S&P 500 (SPY) with -2.40%; holding up reasonably well was Consumer Staples (XLP) with -1.20%.

We continue to stay on the sidelines with our Domestic TTI now firmly entrenched in bear market territory. See section 3 below for details.

Read More

China, Korea Both Impacting U.S. Markets

Ulli Market Commentary Contact

Wed pic

[Chart courtesy of MarketWatch.com]

1. Moving the Markets

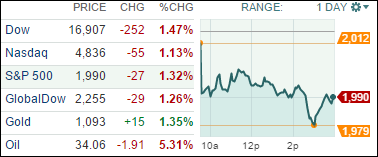
2016 has been awful so far for the bulls, with the Dow logging its worst three-day stretch in a new year since the financial-crisis days of 2008. All major indexes closed at least 1.15% lower today and there were no signs of a change to come.

Some news agencies are blaming the market slide today on the news about North Korea having successfully tested a hydrogen bomb. Others say that the news only added to the already down trending market set in motion Monday when a major plunge in shares of mainland China stocks renewed global growth fears of the state of the global economy. I think certain realities, such as weak domestic economic data points and current lack of Fed support, are coming home to roost.

Adding to the market’s woes Wednesday was another sharp drop in the price of U.S. Crude Oil, which plunged 5.5% to below $34 a barrel amid the growing worries related to slowing growth.

As it related to energy, the biggest anchor on the Dow today was Chevron (CVX), showing that the woes in the energy patch continue. The stock dropped $3.54 to $86.07, which accounted for a decline of about 26 Dow points.

All of our 10 ETFs in the Spotlight hit the skids as well and closed in the red. Faring the worst was the Equal Weight S&P (RSP) with -1.83%. As could be expected, Consumer Staples (XLP) held up best by giving back only -0.34%.

Read More

No Headaches For Investors Tuesday

Ulli Market Commentary Contact

Mon pic

[Chart courtesy of MarketWatch.com]

1. Moving the Markets

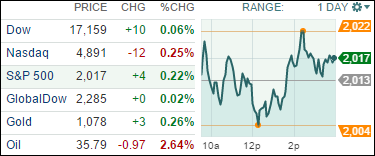
Wall Street entered the second day of trading of 2016 on the defensive as investors still reeled from a global stock sell-off Monday and evaluated the most recent steps taken by Chinese authorities to stabilize markets and reduce jitters.

Overnight, shares in mainland China stabilized with the help once again from government intervention in markets a day after a 7% plunge prompted an early halt to trading in what was the worst start to the year ever for China stocks.

Here in the U.S., we heard some positive news in the auto industry. Automakers posted a solid 9% sales gain in December, an exclamation mark that sealed 2015 as the biggest sales year ever for the industry. Automakers sold 17.47 million vehicles for the year, Autodata reported, besting what Kelley Blue Book reported as the previous record, which was 17.35 million in 2000. Low gas prices, cheap credit, low unemployment, soaring consumer confidence and warm weather fueled a rush into the showroom in December apparently.

And in tech, Investors hoping the Apple (AAPL) stock implosion would end this year are now clinging to what’s left of the triple-digit stock price. Shares of the iPhone maker closed down another 2.5%, or $2.64, Tuesday to $102.71. The once-hot stock is now careering toward the $100-a-share level — a price threshold bulls are hoping will finally hold. Apple’s stock hasn’t closed below $100 since late October 2014.

Our 10 ETFs in the Spotlight were mixed as the market attempted to bounce back with 8 of them closing higher, while 2 of them ended up in the red. Leading the charge to the upside was the Low Volatility ETF (SPLV) with +0.82%. On the downside, Consumer Discretionaries (XLY) gave back a minor -0.13%.

Read More