New Year, Old Problems = Sour Start To 2016

Ulli Market Commentary Contact

Mon pic

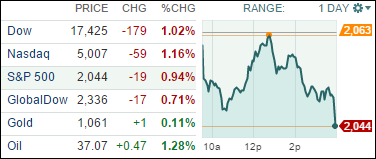
[Chart courtesy of MarketWatch.com]

1. Moving the Markets

Stocks around the world plunged on the first trading day of 2016, with the Dow diving 470 points in intraday trading before moderating its losses amid fresh signs of slowing growth in China, the world’s second-biggest economy. All three major indexes got spanked as the chart above shows.

2016’s rocky beginning came as many of the same worries that held stocks back last year reappeared, prompting investors to sell equities and reduce risk.

China was the main culprit today, as we received a weaker-than-expected reading on Chinese manufacturing that showed continued contraction in one of the world’s most important economies. The lackluster numbers raised fresh fears about the global growth outlook for 2016 and the profit outlook for companies around the globe. It also sparked a massive stock market sell-off in mainland China, where shares tumbled more than 7%, forcing authorities to halt trading for the day before the normal closing time.

Fresh data in today on U.S. manufacturing added to investor fears about a global economic slowdown. An index of U.S. factory activity fell to 48.2 from 48.6, the Institute for Supply Management said Monday. That’s the lowest level since June 2009 and the second straight month of reading below 50, signaling contraction in the sector.

One bad day, even if it’s the first day of a new year, doesn’t mean that stock market returns will be horrific for the full year. It just signals that volatility is still present trailing from 2015 along with the uncertainty of what the effects of ever weakening economic data points will have on equities. Will have to wait and see if today was simply an outlier or the final nail in the coffin of a much overextended bull market.

All of our 10 ETFs in the Spotlight followed the theme of world markets and closed down. Giving back the most was the Financials (IYF) with -1.92% while the Dividend Select ETF (DVY) held up best with -0.79%.

Read More

ETFs/Mutual Funds On The Cutline – Updated Through 12/31/2015

Ulli ETFs on the Cutline Contact

Below are the latest ETF Cutline reports, which show how far above or below their respective long-term trend lines (39 week SMA) my currently tracked ETFs/MFs are positioned.

The first report covers the ETF Master List from Thursday’s StatSheet and includes 381 ETFs, of which currently 56 (last week 55) are hovering in bullish territory.

The second report includes only High Volume ETFs. To clarify, High Volume (HV) ETFs are defined as those with an average daily volume of $10 million or higher. Volume figures can change in a hurry, so be sure to check first before investing.

These ETFs are generated from my selected list of 98 that I use in my advisor practice. It cuts out the “noise,” which simply means it eliminates those ETFs that I would never buy because of their volume limitations. 9 ETFs (last week 12) have managed to remain in bullish territory after the recent market volatility.

The third report covers Mutual Funds on the Cutline. There are currently 56 (last week 83) above the line and 744 below it out of the 800 that I follow.

Take a look:

  1. ETF Master Cutline Report
  2. ETF High Volume Cutline Report
  3. MF Cutline Report

In case you are not familiar with some of the terminology used in the reports, please read the Glossary of Terms.

If you missed the original post about the Cutline approach, you can read it here.

One Man’s Opinion: Will Equities See Muted Gains In 2016?

Ulli Market Review Contact

ManThe year 2016 is likely to see a slow start, similar to what was witnessed in the last couple of years, due to some additional slowdown in manufacturing, said Mark Vitner, senior economist at Wells Fargo Securities.
The forward looking data on manufacturing is still pointing to additional deceleration – new orders data looks horrible, while the US economy failed to record any growth in industrial production in 2015. A lot of people try to minimize the troubles in the factory-sector arguing manufacturing is a small part of the economy, but it still accounts for the bulk of the swing in GDP from quarter-to-quarter.

While the general-consensus economic growth for 2016 is 2-2.5 percent, Wells Fargo Securities thinks weak manufacturing could be the biggest obstacle to achieving that target, he noted.

Read More

New ETFs On The Block: SPDR S&P 500 High Dividend ETF (BITE)

Ulli Dividend ETFs Contact

Investing

Domestic consumption and US consumer spending is likely to remain the dominant investment theme for 2016 as employee wages start to pick up and the wider economic recovery gains traction.

Moreover, cheap fuel and improving consumer confidence would likely lead to greater levels of disposable incomes, making the consumer discretionary sector a compelling proposition to stay invested in.

The restaurant industry – part of the consumer discretionary sector, has been the best performing segment in 2015 due to solid fundamentals, despite some headwinds. Research shows the Average American household spends more than $2,600 every year and eats at a restaurant more than five times a week. Needless to say, it was just a matter of time before some body spotted an opportunity in this oft overlooked but lucrative space.

Read More

Weekly StatSheet For The ETF/No Load Fund Tracker Newsletter – Updated Through 12/31/2015

Ulli ETF StatSheet Contact

ETF/Mutual Fund Data updated through Thursday, December 31, 2015

TOC 111915

If you are not familiar with some of the terminology used, please see the Glossary of Terms.


1. DOMESTIC EQUITY MUTUAL FUNDS/ETFs: SELL — since 11/13/2015

TTI-12-31-15

Our main directional indicator, the Domestic Trend Tracking Index (TTI-green line in above chart) has recently crawled above its long term trend line (red) and finally generated a new “Buy” signal effective 11/3/15. The market subsequently dropped, and we exited again on 11/13/15. As of today, the TTI remains below its trend line by -0.70%, which means we are in cash on the sidelines.

Read More

2015 Ends With An Ugly Close

Ulli Market Commentary Contact

Thur pic

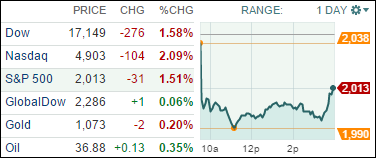
[Chart courtesy of MarketWatch.com]

1. Moving the Markets

U.S. stocks closed out the final trading day of 2015 with both the Dow and S&P 500 suffering their first year of negative returns since 2008 when the financial crisis was in full swing. Both benchmarks were on the verge of a positive year at the start of today’s trading session, with the Dow needing a sizable, 219-point gain to hit break even. However, it wasn’t meant to be today, as all three major indexes fell about 1% or more and closed at their lows. The Nasdaq reigned supreme for 2015, posting final annual gains of 5.7%, while the S&P 500 and Dow ended the year down about 1%. Oil was by far the biggest loser this year, with the price of U.S. Crude dropping a whopping 30.5%.

It’s been an up and down year on Wall Street. After hitting record highs in May, the stock market suffered its first correction, or drop of 10% or more, back in August. And while the market has rebounded from its summer lows, all three of the major U.S. indexes are still around 3% to 4% off their peaks.

Stocks have been held back throughout the year by uncertainty surrounding interest rate policy, as the Federal Reserve hiked borrowing costs earlier this month for the first time in nearly a decade. Stocks have also been hurt by slowing growth in China, the negative fallout on sales and earnings of U.S. multinationals due to a stronger dollar and the steep losses in the energy sector, which have sent the energy sector of the S&P 500 down almost 24% this year.

Geopolitical threats around the globe and resurgence in terror attacks in the later stages of 2015 have also weighed on investor sentiment. Stock valuations are also above historical averages following the stock market’s more than tripling in value off of the lows back in March 2009.

All of our 10 ETFs in the Spotlight joined the last hour sell-off and closed lower. Leading the charge to the downside was Consumer Staples (XLP) with -1.12% while the Mid-Cap Value (IWS) held up best with -0.72%.

Read More