Due to a variety of commitments, today’s market commentary will be delayed. I hope to have it posted by around 5:30 PM PST.
Ulli…

Due to a variety of commitments, today’s market commentary will be delayed. I hope to have it posted by around 5:30 PM PST.
Ulli…
Below are the latest ETF Cutline reports, which show how far above or below their respective long-term trend lines (39 week SMA) my currently tracked ETFs/MFs are positioned.
The first report covers the ETF Master List from Thursday’s StatSheet and includes 381 ETFs, of which currently 55 (last week 35) are hovering in bullish territory.
The second report includes only High Volume ETFs. To clarify, High Volume (HV) ETFs are defined as those with an average daily volume of $10 million or higher. Volume figures can change in a hurry, so be sure to check first before investing.
These ETFs are generated from my selected list of 98 that I use in my advisor practice. It cuts out the “noise,” which simply means it eliminates those ETFs that I would never buy because of their volume limitations. 12 ETFs (last week 10) have managed to remain in bullish territory after the recent market volatility.
The third report covers Mutual Funds on the Cutline. There are currently 83 (last week 48) above the line and 717 below it out of the 800 that I follow.
Take a look:
In case you are not familiar with some of the terminology used in the reports, please read the Glossary of Terms.
If you missed the original post about the Cutline approach, you can read it here.

The Central Bank continues to dominate the economy of not just the US but globally, said Eric Wiegand, portfolio manager at US Bank. (There has been) a break from the trajectory that was witnessed previously; at least the US has the certainty of one rate-hike behind it.
The debate over the number of increases as the economy moves through 2016 is still out there, and the overall impact on currencies in the level of growth that the economy is likely to see in 2016 is still a question mark, he observed.
Asked if investors should focus on value or growth stocks, Eric said there should be an appropriate mix of the two, to be candid. For US Bank, there are certain sectors that offer better opportunities than others including technology, healthcare – a sector for all seasons, select consumer discretionary stocks, financials as well as industrials, he noted.
 State Street Global Advisors (SSgA), a unit of State Street and the asset manager behind the iconic SPDR S&P 500 ETF (SPY), recently launched an equity fund dedicated to tracking the performance of the biggest dividend paying stocks listed in the US.
The newly minted SPDR S&P 500 High Dividend ETF (SPYD) targets the top dividend payers in the S&P 500 benchmark and aims to reflect the performance of the S&P 500 High Dividend Index, a gauge consisting of the top 80 dividend yield securities from the S&P 500 Index.
Needless to say, by its very nature, the new fund is comprised of large-cap securities from the US with a weighted-average market cap exceeding $40 billion. To begin with, the underlying index calculates the dividend yields for all the constituents of the S&P 500 Index. To that end, latest dividend payouts, excluding any special/one-time payments, are recorded and are multiplied by the frequency of payouts made in year. The dividend yield is calculated next by dividing annualized dividends by the firm’s current stock price.
ETF/Mutual Fund Data updated through Thursday, December 24, 2015
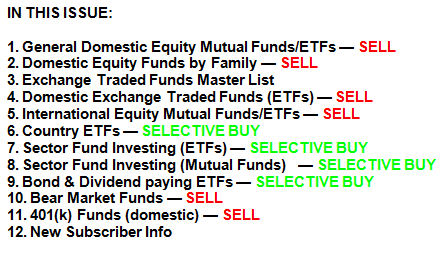
If you are not familiar with some of the terminology used, please see the Glossary of Terms.
1. DOMESTIC EQUITY MUTUAL FUNDS/ETFs: SELL — since 11/13/2015
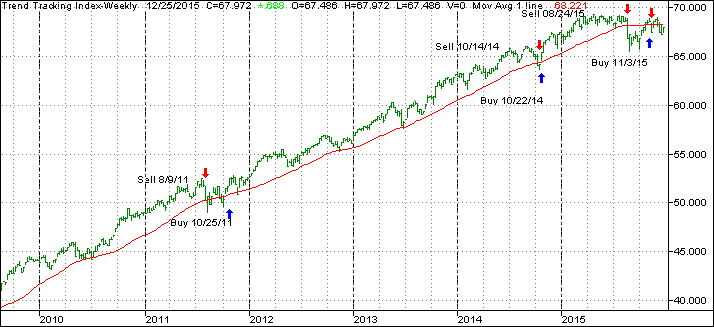
Our main directional indicator, the Domestic Trend Tracking Index (TTI-green line in above chart) has recently crawled above its long term trend line (red) and finally generated a new “Buy” signal effective 11/3/15. The market subsequently dropped, and we exited again on 11/13/15. As of today, the TTI remains below its trend line by -0.38%, which means we are in cash on the sidelines.
With today’s shortened uneventful market session, there won’t be a commentary. I will publish Thursday’s StatSheet sometime this coming Saturday along with the “New ETF’s on the Block” series. Sunday will feature the usual “One Man’s Opinion” piece, and Monday morning I will resume with “ETFs on the Cutline.”
In the meantime, I wish you a very Merry Christmas and Happy Holidays.
Ulli…