
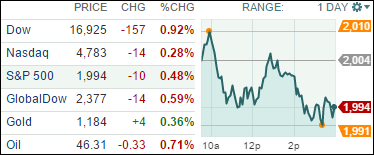
1. Moving the Markets
Markets closed lower today after a lackluster bunch of quarterly earnings reports. The reports gave a somewhat confirming nod to speculative investors that the U.S. and global economy will may experience a slowdown over the next year,
As far as earnings go, Walmart (WMT) shares experienced their lowest one-day drop in nearly thirty years after the U.S. retailing giant jolted financial markets by forecasting a 6% to 12% earnings drop in fiscal year 2017. The company said earnings for sales growth for the current fiscal year would be flat, a drop from the 1% to 2% increase earlier forecasted by Wall Street analysts.
On the other side of the coin, the air travel market seems to be boding well for Delta (DAL). Today, the company announced $1.4 billion in adjusted net income for the Q3, or $1.74 per diluted share, amid low fuel prices and solid demand from travelers. The strong performance that marked a 45% improvement over the same period a year earlier is expected to continue during the final three months of the year, according to Delta’s CEO Richard Anderson.
Also in earnings news today, shares of Netflix (NFLX) sank 8.7% to $100.61 after the company reported that U.S. subscriber additions fell below its own forecast.
None of our 10 ETFs in the Spotlight was able to buck the trend and all closed lower with Consumer Staples giving back -1.16%, while Healthcare (XLV) held up best with -0.19%.
2. ETFs in the Spotlight
In case you missed the announcement and description of this section, you can read it here again.
It features 10 broadly diversified ETFs from my HighVolume list as posted every Monday. Furthermore, they are screened for the lowest MaxDD% number meaning they have been showing better resistance to temporary sell offs than all others over the past year.
Here are the 10 candidates:
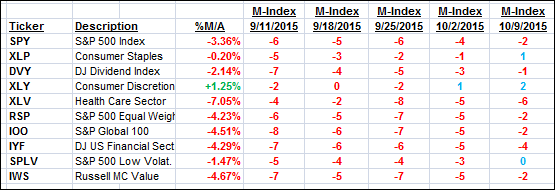
The above table simply demonstrates the magnitude with which some of the ETFs are fluctuating in regards to their positions above or below their respective individual trend lines (%M/A). A break below, represented by a negative number, shows weakness, while a break above, represented by a positive percentage, shows strength.
For hundreds of ETF/Mutual fund choices, be sure to reference Thursday’s StatSheet.
Year to date, here’s how the above candidates have fared so far:
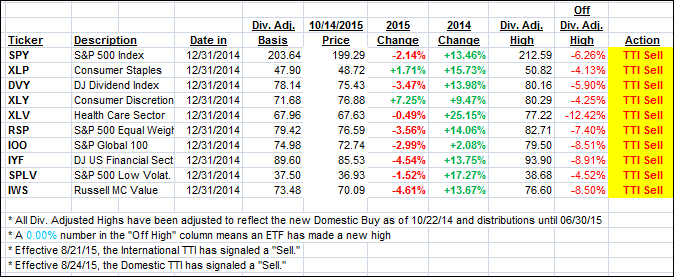
Again, the first table above shows the position of the various ETFs in relation to their respective long term trend lines (%M/A), while the second one tracks their trailing sell stops in the “Off High” column. The “Action” column will signal a “Sell” once the -7.5% point has been taken out in the “Off High” column.
3. Trend Tracking Indexes (TTIs)
Our Trend Tracking Indexes (TTIs) again headed south and closed as follows:
Domestic TTI: -1.10% (last close -0.94%)—Sell signal effective 8/24/2015
International TTI: -4.28% (last close -4.18%)—Sell signal effective 8/21/2015
Until the respective trend lines get clearly broken to the upside, we are staying on the sidelines.
Disclosure: I am obliged to inform you that I, as well as advisory clients of mine, own some of these listed ETFs. Furthermore, they do not represent a specific investment recommendation for you, they merely show which ETFs from the universe I track are falling within the guidelines specified.
Contact Ulli