
1. Moving the Markets
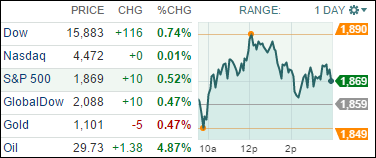
After Wednesday’s wild ride and sizable stock market reversal that limited losses, Wall Street attempted a rebound Thursday with the Dow rising triple digits after oil jumped 5% and European stocks rallied on ECB stimulus talk.
Wall Street kicked off the session wondering if yesterday’s big drop and late-day comeback was a sign of a short-term selling climax that could finally pave the way for a market bounce back. The general consensus on Wall Street is that, if anything, the market has suffered enough pain since the start of 2016 to at least mount a counter-trend rally. However, fears of a continued selloff do remain rampant, so today may very well have been a dead cat bounce.
Stocks got a boost as the head of the European Central Bank said it will review its monetary policy stance in March. That comment from ECB President Mario Draghi could mean more stimulus is on the way to combat slow growth and worsening inflation in the Eurozone.
Today’s rally was also helped by a rise in oil prices as U.S. benchmark crude jumped about 5% back up to almost $30 a barrel.
8 of our 10 ETFs in the Spotlight ended up in the gree lead by Consumer Discretionaries (XLY) with +1.28%. Closing in the red were Healthcare (XLV) and the Financials (IYF) with -0.30% and -0.17% respectively.
2. ETFs in the Spotlight
In case you missed the announcement and description of this section, you can read it here again.
It features 10 broadly diversified ETFs from my HighVolume list as posted every Monday. Furthermore, they are screened for the lowest MaxDD% number meaning they have been showing better resistance to temporary sell offs than all others over the past year.
Here are the 10 candidates:
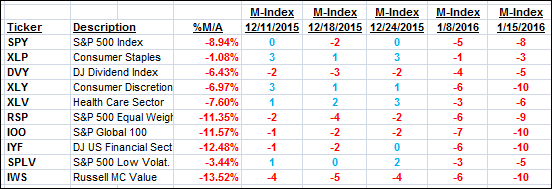
The above table simply demonstrates the magnitude with which some of the ETFs are fluctuating in regards to their positions above or below their respective individual trend lines (%M/A). A break below, represented by a negative number, shows weakness, while a break above, represented by a positive percentage, shows strength.
For hundreds of ETF/Mutual fund choices, be sure to reference Thursday’s StatSheet.
Year to date, here’s how the above candidates have fared so far:
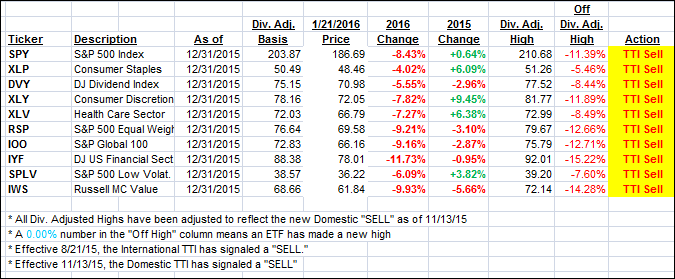
Again, the first table above shows the position of the various ETFs in relation to their respective long term trend lines (%M/A), while the second one tracks their trailing sell stops in the “Off High” column. The “Action” column will signal a “Sell” once the -7.5% point has been taken out in the “Off High” column.
3. Trend Tracking Indexes (TTIs)
Our Domestic Trend Tracking Index (TTI) slipped just a tad as the markets closed up.
Here’s how we ended up:
Domestic TTI: -3.65% (last close -3.74%)—Sell signal effective 11/13/2015
International TTI: -12.35% (last close -12.61%)—Sell signal effective 8/21/2015
Disclosure: I am obliged to inform you that I, as well as advisory clients of mine, own some of these listed ETFs. Furthermore, they do not represent a specific investment recommendation for you, they merely show which ETFs from the universe I track are falling within the guidelines specified.
Contact Ulli