Weekly StatSheet For The ETF/No Load Fund Tracker Newsletter – Updated Through 03/24/2016

Ulli ETF StatSheet Contact

ETF/Mutual Fund Data updated through Thursday, March 24, 2016

TOC010716

If you are not familiar with some of the terminology used, please see the Glossary of Terms.


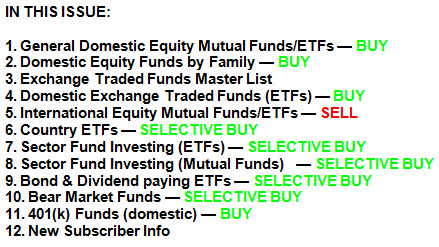
1. DOMESTIC EQUITY MUTUAL FUNDS/ETFs: SELL — since 11/13/2015

TTI

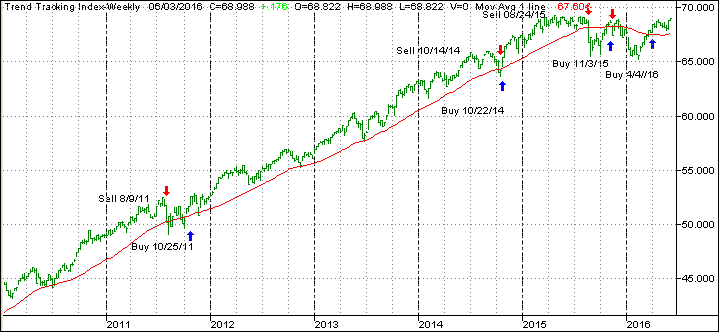
Our main directional indicator, the Domestic Trend Tracking Index (TTI-green line in above chart) has recently crawled above its long term trend line (red) and finally generated a new “Buy” signal effective 11/3/15. The market subsequently dropped, and we exited again on 11/13/15. As of today, the TTI has just crawled above its trend line by +0.27%. This is move is not enough to generate a new Buy signal. Stay tuned for daily updates and any changes to our position.

Read More

ETF/No Load Fund Tracker Newsletter For March 24, 2016

Ulli Market Commentary Contact

ETF/No Load Fund Tracker StatSheet

————————————————————-

https://theetfbully.com/2016/03/weekly-statsheet-for-the-etfno-load-fund-tracker-newsletter-updated-through-03242016/

————————————————————

Market Commentary

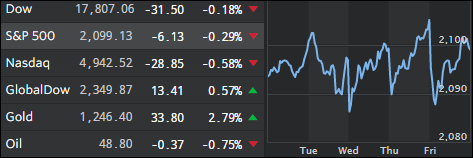
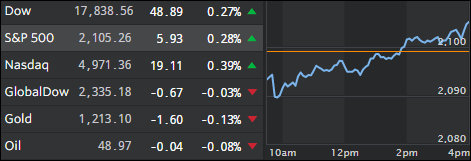
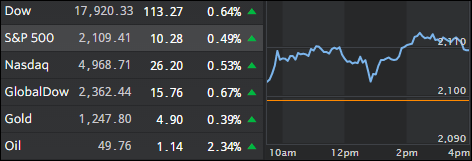
MARKETS UNCHANGED FOR THE DAY BUT DOWN FOR THE WEEK

Thur pic

[Chart courtesy of MarketWatch.com]

1. Moving the Markets

Heading into the long weekend, U.S. stocks showed weakness amid renewed talks of a coming interest rate hike from the Federal Reserve, a resurgent dollar and falling oil prices, putting an end to their five-week winning streak.

Investor sentiment has cooled following the terror attacks in Brussels as well as comments the past two days from St. Louis Fed President James Bullard that hinted that the next interest rate hike could come sooner than investors have anticipated.

We were also digesting economic news. Durable goods, or sales of long-lasting, big-ticket items like refrigerators and washing machines, fell 2.8% in February. The weak reading suggests “that companies and households are still very cautious in their spending,” Steven Ricchiuto, chief economist at Mizuho Securities USA told clients in a report.

As a side note, Thursday marked the end of the trading week. U.S. financial markets are closed Friday in observance of Good Friday.

Read More

Markets Slip On Oil Pullback

Ulli Market Commentary Contact

Wed pic

[Chart courtesy of MarketWatch.com]

1. Moving the Markets

There wasn’t a lot of news for the markets to react to today, so reactionaries moved back to their fallback…oil prices. Oil prices were down more than 3% after the U.S. government reported a crude build three times above analysts’ expectations.

Virgin America stole a number of headlines today after news reports stated that the company is considering selling a part or its entire business. Virgin America’s shares gained 13.7% to $34.87. Virgin America is the U.S. offshoot of billionaire entrepreneur Richard Branson’s London-based Virgin Group, which is involved in airlines, railroads, telecommunications, media and hospitality.

Stocks that moved lower today included Sun Edison, Nike after reporting lower-than-expected revenue, and ConocoPhillips. The energy company slid along with the rest of the sector after reports of growing U.S. stockpiles.

Looking ahead for the week, we will get a read on durable goods for February. Analysts are expecting a 3% drop for new orders. Fed watch continues with St. Louis Fed President James Bullard speaking in New York and pre-orders begin for Apple’s new iPhone SE smartphone, its cheapest iPhone to date.

Read More

Terrorists Fail To Shake Markets

Ulli Market Commentary Contact

Tue pic

[Chart courtesy of MarketWatch.com]

1. Moving the Markets

Stocks in the U.S. and Europe on Tuesday basically shook off the deadly terror strikes at an airport and metro station in Brussels. U.S. investors didn’t overreact, as terror acts have unfortunately become more common. After opening slightly lower, the major benchmarks climbed above break-even in afternoon trade, before ending mixed.

Taking the bulk of the early hit in the stock market were travel-related shares in Europe.  Low-cost air carriers were down but off their earlier lows, with Ryanair  down 2.1% and EasyJet off 1.3%. AirFrance was down more than 4% and Paris-based hotel chain operator Accor fell 3.8%.

U.S. airlines canceled flights to Brussels as security measures were tightened across Europe. The move lower for airline stocks spread to the U.S. American Airlines (AAL) fell 1.63%. United Continental (UAL) was off 1.14%. And Delta Air Lines (DAL) closed 1.46% lower.

Some investors did seek out so-called safe havens, such as gold. An ounce of gold was trading $10 higher, or 0.8%, to $1,254 early in the day and closed up at $1,247.25 an ounce.

Read More

Momentum Slows But Major Indexes Inch Higher

Ulli Uncategorized Contact

Mon pic

[Chart courtesy of MarketWatch.com]

1. Moving the Markets

The resurgent U.S. stock market kicked off the holiday-shortened week by slightly extending last week’s gains as investors digested a big rally that has turned stocks positive for the year and reacted to deals in the hotel, paint and data businesses.

A flurry of M&A deals announced Monday gave an assist, including Starwood Hotels & Resorts Worldwide (HOT) agreeing to a better revised deal of $13.6 billion from Marriott International (MAR) that tops a competing bid from China’s Anbang Insurance Group.

Apple (AAPL) was back in the news today. The company unveiled the iPhone SE Monday, which executives described as “the most powerful 4-inch phone ever.” Hitting the market alongside the smaller phone was a trimmed down iPad Pro. The stock moved up and down, but ended at par with the morning.

I for one am very curious to see if the upward momentum of the recent bear market rally can continue as some of the supporting players are no longer in the game. First, most of the shorts have covered so that driving force has been diminished. Second, the biggest contributors to the recent ramp, namely corporate buy-backs, are entering their blackout period, which is the 5 week time frame prior to their quarterly reports cards being issued. Third, according to BofA, most institutional clients, AKA the smart money, took the recent rally as an opportunity to exit the markets or at least lighten up on equity positions.

If, however, against this negative backdrop, the markets continue on their upward trajectory, we may very well face a resumption of last year’s bull market, which may possibly coincide with a new Domestic Buy signal. You can see the latest numbers in section 3 below.

Read More

ETFs/Mutual Funds On The Cutline – Updated Through 03/18/2016

Ulli ETFs on the Cutline Contact

Below are the latest ETF Cutline reports, which show how far above or below their respective long-term trend lines (39 week SMA) my currently tracked ETFs/MFs are positioned.

The first report covers the ETF Master List from Thursday’s StatSheet and includes 381 ETFs, of which currently 225 (last week 154) are hovering in bullish territory.

The second report includes only High Volume ETFs. To clarify, High Volume (HV) ETFs are defined as those with an average daily volume of $10 million or higher. Volume figures can change in a hurry, so be sure to check first before investing.

These ETFs are generated from my selected list of 98 that I use in my advisor practice. It cuts out the “noise,” which simply means it eliminates those ETFs that I would never buy because of their volume limitations. 54 ETFs (last week 41) have managed to remain in bullish territory after the recent market volatility.

The third report covers Mutual Funds on the Cutline. There are currently 180 (last week 104) above the line and 600 below it out of the 780 that I follow.

Take a look:

  1. ETF Master Cutline Report
  2. ETF High Volume Cutline Report
  3. MF Cutline Report

In case you are not familiar with some of the terminology used in the reports, please read the Glossary of Terms.

If you missed the original post about the Cutline approach, you can read it here.