
1. Moving the Markets
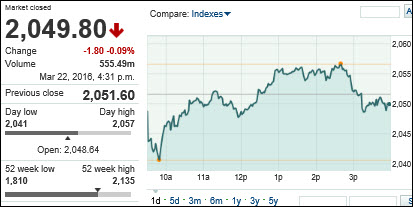
Stocks in the U.S. and Europe on Tuesday basically shook off the deadly terror strikes at an airport and metro station in Brussels. U.S. investors didn’t overreact, as terror acts have unfortunately become more common. After opening slightly lower, the major benchmarks climbed above break-even in afternoon trade, before ending mixed.
Taking the bulk of the early hit in the stock market were travel-related shares in Europe. Low-cost air carriers were down but off their earlier lows, with Ryanair down 2.1% and EasyJet off 1.3%. AirFrance was down more than 4% and Paris-based hotel chain operator Accor fell 3.8%.
U.S. airlines canceled flights to Brussels as security measures were tightened across Europe. The move lower for airline stocks spread to the U.S. American Airlines (AAL) fell 1.63%. United Continental (UAL) was off 1.14%. And Delta Air Lines (DAL) closed 1.46% lower.
Some investors did seek out so-called safe havens, such as gold. An ounce of gold was trading $10 higher, or 0.8%, to $1,254 early in the day and closed up at $1,247.25 an ounce.
2. ETFs in the Spotlight
In case you missed the announcement and description of this section, you can read it here again.
It features 10 broadly diversified ETFs from my HighVolume list as posted every Monday. Furthermore, they are screened for the lowest MaxDD% number meaning they have been showing better resistance to temporary sell offs than all others over the past year.
Here are the 10 candidates:
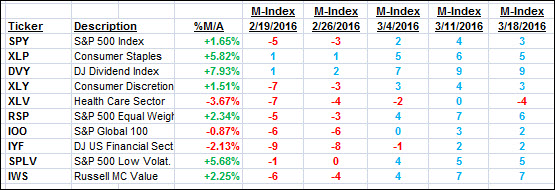
The above table simply demonstrates the magnitude with which some of the ETFs are fluctuating in regards to their positions above or below their respective individual trend lines (%M/A). A break below, represented by a negative number, shows weakness, while a break above, represented by a positive percentage, shows strength.
For hundreds of ETF/Mutual fund choices, be sure to reference Thursday’s StatSheet.
Year to date, here’s how the above candidates have fared so far:
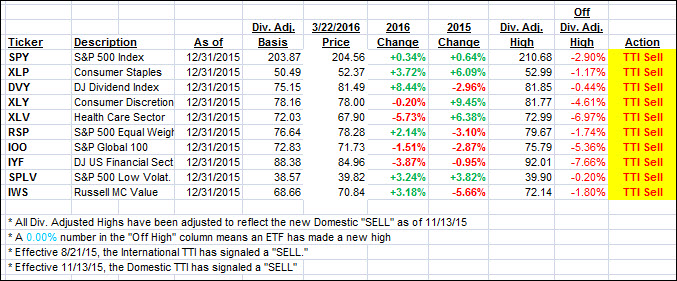
Again, the first table above shows the position of the various ETFs in relation to their respective long term trend lines (%M/A), while the second one tracks their trailing sell stops in the “Off High” column. The “Action” column will signal a “Sell” once the -7.5% point has been taken out in the “Off High” column.
3. Trend Tracking Indexes (TTIs)
Our Domestic Trend Tracking Index (TTI) again changed only immaterially with the indexes showing no clear direction in the aftermath of the Brussels terrorist attacks.
Here’s how we ended up:
Domestic TTI: +0.49% (last close +0.55%)—Sell signal effective 11/13/2015
International TTI: -2.79% (last close -2.88%)—Sell signal effective 8/21/2015
Disclosure: I am obliged to inform you that I, as well as advisory clients of mine, own some of these listed ETFs. Furthermore, they do not represent a specific investment recommendation for you, they merely show which ETFs from the universe I track are falling within the guidelines specified.
Contact Ulli