ETFs/Mutual Funds On The Cutline – Updated Through 06/10/2016

Ulli ETFs on the Cutline Contact

Below are the latest ETF Cutline reports, which show how far above or below their respective long-term trend lines (39 week SMA) my currently tracked ETFs/MFs are positioned.

The first report covers the ETF Master List from Thursday’s StatSheet and includes 381 ETFs, of which currently 324 (last week 344) are hovering in bullish territory.

The second report includes only High Volume ETFs. To clarify, High Volume (HV) ETFs are defined as those with an average daily volume of $10 million or higher. Volume figures can change in a hurry, so be sure to check first before investing.

These ETFs are generated from my selected list of 98 that I use in my advisor practice. It cuts out the “noise,” which simply means it eliminates those ETFs that I would never buy because of their volume limitations. 79 ETFs (last week 86) have managed to remain in bullish territory after the recent market volatility.

The third report covers Mutual Funds on the Cutline. There are currently 542 (last week 588) above the line and 238 below it out of the 780 that I follow.

Take a look:

  1. ETF Master Cutline Report
  2. ETF High Volume Cutline Report
  3. MF Cutline Report

In case you are not familiar with some of the terminology used in the reports, please read the Glossary of Terms.

If you missed the original post about the Cutline approach, you can read it here.
ETF/No Load Fund Tracker Newsletter For June 10, 2016

Ulli ETF Tracker Contact

ETF/No Load Fund Tracker StatSheet

————————————————————-

https://theetfbully.com/2016/06/weekly-statsheet-for-the-etfno-load-fund-tracker-newsletter-updated-through-06092016/

————————————————————

Market Commentary

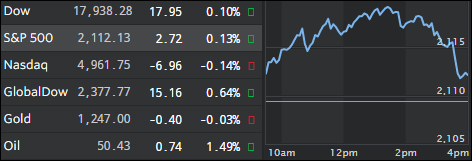
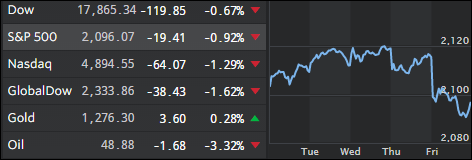
RUNNING INTO A BRICK WALL

Fri pic

[Chart courtesy of MarketWatch.com]

1. Moving the Markets

Markets were on a hot streak heading into today’s trading, driven by well-performing energy stocks and oil. However, the hopes of the S&P 500 breaking into record territory slowly faded into dust as all 3 major indexes slid into negative territory fairly quickly.

Global trading has been all about the bond market of late. The rush into bonds comes at a time when investors are worried about possible market disruptions due to political and economic uncertainties. Also pushing yields lower is the continued aggressive buying of bonds by the European Central Bank and other central bankers in an attempt to boost flagging economic growth.

Yields have been falling since last Friday’s weak May jobs report put the Federal Reserve’s interest rate hikes on hold for the time being. The next Fed meeting wraps up on Wednesday, and investors will ponder over the central bank’s announcement for clues when an interest rate hike might be coming.

Also of note today, is that U.S. crude fell 3.3% to $48.88 and back below $50 per barrel following news that the U.S. rig count rose for the second week in a row.

Read More

Weekly StatSheet For The ETF/No Load Fund Tracker Newsletter – Updated Through 06/09/2016

Ulli ETF StatSheet Contact

ETF/Mutual Fund Data updated through Thursday, June 9, 2016

TOC060916

If you are not familiar with some of the terminology used, please see the Glossary of Terms.


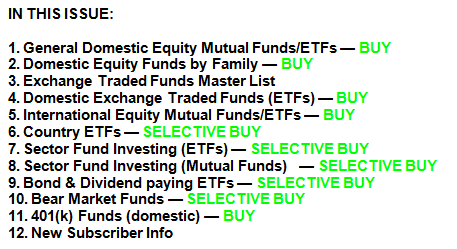
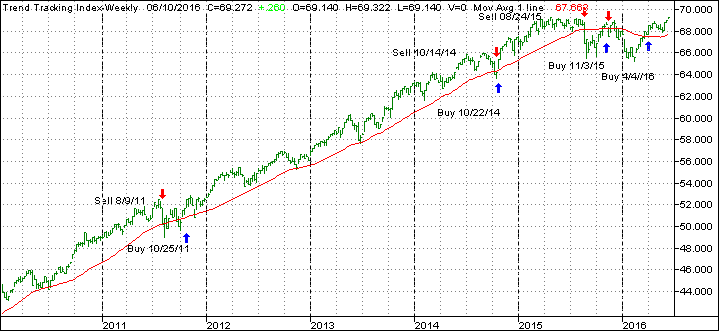
1. DOMESTIC EQUITY MUTUAL FUNDS/ETFs: BUY — since 4/4/2016

TTI

Our main directional indicator, the Domestic Trend Tracking Index (TTI-green line in above chart) remains above its long term trend line (red) by +2.47% after having generated a new Domestic Buy signal effective 4/4/2016 as posted.

Read More

S&P 500 Can’t Break Through; Winning Streak Ends

Ulli Market Commentary Contact

Thur pic

[Chart courtesy of MarketWatch.com]

1. Moving the Markets

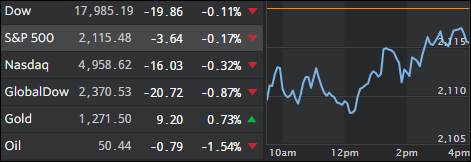
European and Asian markets were down and so were the US major indexes, at least in the early part of the session. Then the usual afternoon Lift-A-Thon pulled the major indexes up but we still closed slightly below the unchanged line.

Well, Wall Street was hoping that the S&P 500 would push to a new record high today, but that did not happen. The index, haunted by speculation over weak global growth and a steep drop in government bond yields, ended down 0.2% after a three-day run towards an all-time high.

Also weighing on stocks of late is a rise in the value of the USD, which is putting pressure on commodities, such as oil. U.S. crude fell 1.54% today to close at $50.44 per barrel. U.S. oil topped $51 a barrel yesterday, which marked an eleven-month high and investors remain bullish that the commodity will push even higher heading into summer.

In regards to the current nosebleed level of the markets, here’s the latest S&P 500 price chart compared to its earnings per share (EPS) expectations, courtesy of ZH:

Read More

Energy Component Top Performer For S&P 500

Ulli Market Commentary Contact

Wed pic

[Chart courtesy of MarketWatch.com]

1. Moving the Markets

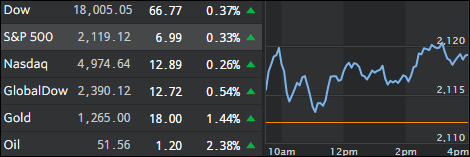
The S&P 500 continued to push towards its all-time high of 2,130.82 today, as the index closed at 2,119.12. Surprising as it may seem, energy has been the main driver for the S&P 500 this year. The Standard & Poor’s 500 index energy sector is up 14.8% to date, which makes it the best of the 10 sectors in the market by far.

Partly driving energy performance higher lately has been oil. The black gold commodity hasn’t settled above $51 since July of 2015, but passed that mark today to close at $51.17 a barrel. This is a notable gain, especially considering that prices were around $30 a barrel for the better part of Q1.

The weaker outlook for global growth continues to be a drag on the market though confirming that the lofty levels of the indexes are simply a function of manipulation. The health of the global economy has just been unable to break out of its low growth trajectory and dangerously low inflation despite massive stimulus and intervention from government authorities worldwide, particularly the ECB and Bank of Japan. It goes to show that the stimulus programs have done nothing but elevate market levels and have had no positive effect on underlying US macro data.

As I posted before, as long as bad economic news abound, translating into continued dovish Fed behavior, the S&P 500 is scheduled to make new all-time highs by next Tuesday at the latest. The question is: Then what?

Read More

Stocks Rock And Drop

Ulli Uncategorized Contact

Tue pic

[Chart courtesy of MarketWatch.com]

1. Moving the Markets

An early rally failed but left the major indexes near multi-months highs despite a late session pullback. It looks like the computer algos continue their push towards all-time highs on no news other than that oil not only climbed above the $50/bbl level but also closed there. The fly in the ointment was that volume was the lowest for the year 2016, which makes this rally suspect.

Investors continued to digest Fed chief Yellen’s remarks as to whether they might be at the verge of delaying the timing of future rate hikes because of last week’s horrific unemployment report. Eventually, Wall Street participants will have to realize that any delay of an interest rate hike is predominantly a function of a weak economy and a potential recession.

It means, as I have repeatedly posted, that the S&P 500, as the major benchmark index, is totally disconnected from underlying US Macro data. ZH featured an updated chart that posts the question “Who will be proven correct?” Take a look:

Read More